Estimated zip code population in 2022: 24,399 Zip code population in 2010: 23,729 Zip code population in 2000: 24,177
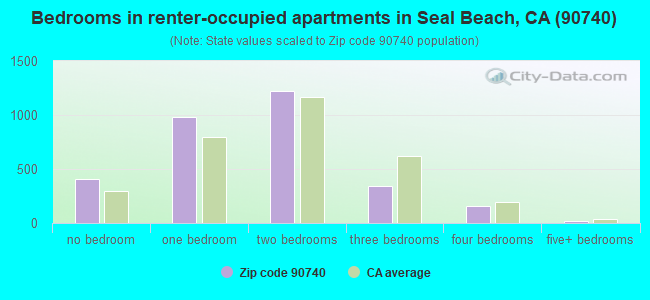
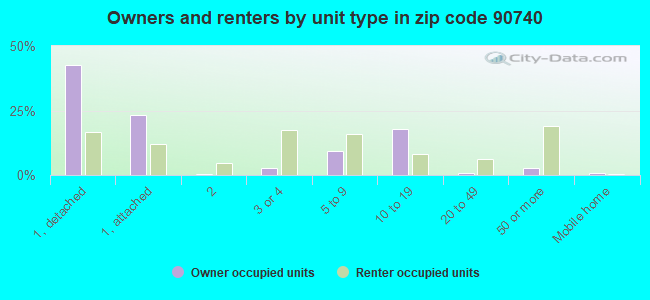
Houses and condos: 14,501 Renter-occupied apartments: 3,122
% of renters here:
24%
State:
44%
March 2022 cost of living index in zip code 90740: 86.8 (less than average, U.S. average is 100)
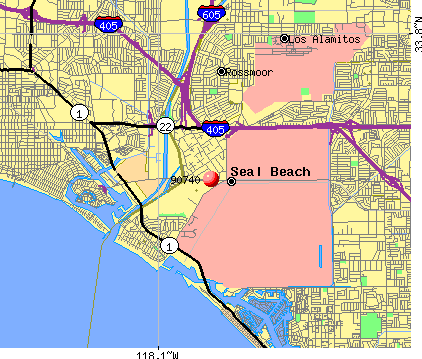
Land area: 8.8 sq. mi. Water area: 0.8 sq. mi.
Population density: 2,781 people per square mile
(average).
OSM Map
General Map
Google Map
MSN Map
OSM Map
General Map
Google Map
MSN Map
OSM Map
General Map
Google Map
MSN Map
OSM Map
General Map
Google Map
MSN Map
Please wait while loading the map...
Real estate property taxes paid for housing units in 2022:
This zip code:
0.6% ($2,855)
California:
0.7% ($4,831)
Median real estate property taxes paid for housing units with mortgages in 2022: $8,538 (0.7%) Median real estate property taxes paid for housing units with no mortgage in 2022: $2,212 (0.6%)
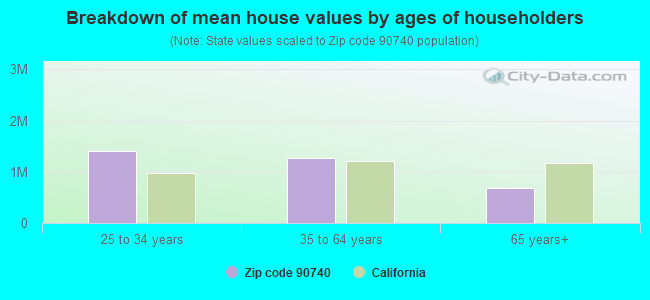
Estimated median house/condo value in 2022: $517,515
90740:
$517,515
California:
$715,900
According to our research of California and other state lists, there were 8 registered sex offenders living in 90740 zip code as of April 26, 2024. The ratio of all residents to sex offenders in zip code 90740 is 3,081 to 1. The ratio of registered sex offenders to all residents in this zip code is much lower than the state average.
Median resident age:
This zip code:
61.8 years
California median age:
37.9 years
Average household size:
This zip code:
1.8 people
California:
2.8 people
Averages for the 2020 tax year for zip code 90740, filed in 2021:
Average Adjusted Gross Income (AGI) in 2020: $111,656 (Individual Income Tax Returns)
Here:
$111,656
State:
$95,910
Salary/wage: $95,516 (reported on 56.8% of returns)
Here:
$95,516
State:
$77,331
(% of AGI for various income ranges: 853.6% for AGIs below $25k, 2982.4% for AGIs $25k-50k, 5553.6% for AGIs $50k-75k, 8900.7% for AGIs $75k-100k, 17915.0% for AGIs $100k-200k, 84545.9% for AGIs over 200k)
Taxable interest for individuals: $3,098 (reported on 57.6% of returns)
This zip code:
$3,098
California:
$2,294
(% of AGI for various income ranges: 108.1% for AGIs below $25k, 144.1% for AGIs $25k-50k, 193.7% for AGIs $50k-75k, 274.9% for AGIs $75k-100k, 543.8% for AGIs $100k-200k, 2451.7% for AGIs over 200k)
Ordinary dividends: $8,415 (reported on 39.9% of returns)
Here:
$8,415
State:
$10,949
(% of AGI for various income ranges: 135.4% for AGIs below $25k, 216.6% for AGIs $25k-50k, 432.2% for AGIs $50k-75k, 526.9% for AGIs $75k-100k, 983.7% for AGIs $100k-200k, 4973.9% for AGIs over 200k)
Net capital gain/loss in AGI: +$22,776 (reported on 37.7% of returns)
Here:
+$22,776
State:
+$49,306
(% of AGI for various income ranges: 35.8% for AGIs below $25k, 145.2% for AGIs $25k-50k, 273.8% for AGIs $50k-75k, 464.0% for AGIs $75k-100k, 1421.2% for AGIs $100k-200k, 20731.1% for AGIs over 200k)
Profit/loss from business: +$19,732 (reported on 16.8% of returns)
Here:
+$19,732
State:
+$15,671
(% of AGI for various income ranges: 172.3% for AGIs below $25k, 254.4% for AGIs $25k-50k, 453.8% for AGIs $50k-75k, 433.9% for AGIs $75k-100k, 996.8% for AGIs $100k-200k, 4674.6% for AGIs over 200k)
Taxable individual retirement arrangement distribution: $20,910 (reported on 21.1% of returns)
90740:
$20,910
California:
$23,505
(% of AGI for various income ranges: 262.4% for AGIs below $25k, 491.6% for AGIs $25k-50k, 643.9% for AGIs $50k-75k, 966.9% for AGIs $75k-100k, 1782.0% for AGIs $100k-200k, 3861.5% for AGIs over 200k)
Self-employed (Keogh) retirement plans: $28,224 (reported on 1.5% of returns)
90740:
$28,224
California:
$30,163
(% of AGI for various income ranges: 38.1% for AGIs $50k-75k, 74.6% for AGIs $100k-200k, 1031.3% for AGIs over 200k)
Total itemized deductions: $39,856 (reported on 21.9% of returns)
Here:
$39,856
State:
$39,517
(% of AGI for various income ranges: 272.1% for AGIs below $25k, 469.5% for AGIs $25k-50k, 963.5% for AGIs $50k-75k, 1546.1% for AGIs $75k-100k, 3060.5% for AGIs $100k-200k, 12307.8% for AGIs over 200k)
Charity contributions: $11,138 (reported on 19.0% of returns)
Here:
$11,138
State:
$12,598
(% of AGI for various income ranges: 13.2% for AGIs below $25k, 62.3% for AGIs $25k-50k, 129.3% for AGIs $50k-75k, 242.7% for AGIs $75k-100k, 546.0% for AGIs $100k-200k, 4225.4% for AGIs over 200k)
Taxes paid: $8,454 (reported on 21.7% of returns)
90740:
$8,454
State:
$8,807
(% of AGI for various income ranges: 38.2% for AGIs below $25k, 99.4% for AGIs $25k-50k, 185.9% for AGIs $50k-75k, 363.7% for AGIs $75k-100k, 793.5% for AGIs $100k-200k, 2289.6% for AGIs over 200k)
Earned income credit: $1,156 (reported on 4.5% of returns)
Here:
$1,156
State:
$2,074
(% of AGI for various income ranges: 26.8% for AGIs below $25k, 19.1% for AGIs $25k-50k)
Percentage of individuals using paid preparers for their 2020 taxes: 92.5%
Here:
93%
State:
92%
(% for various income ranges: 91.6% for AGIs below $25k, 92.0% for AGIs $25k-50k, 92.5% for AGIs $50k-75k, 92.2% for AGIs $75k-100k, 92.8% for AGIs $100k-200k, 94.9% for AGIs over 200k)
Averages for the 2012 tax year for zip code 90740, filed in 2013:
Average Adjusted Gross Income (AGI) in 2012: $86,976 (Individual Income Tax Returns)
Here:
$86,976
State:
$72,726
Salary/wage: $79,238 (reported on 58.7% of returns)
Here:
$79,238
State:
$59,079
(% of AGI for various income ranges: 40.1% for AGIs below $25k, 48.1% for AGIs $25k-50k, 52.2% for AGIs $50k-75k, 55.5% for AGIs $75k-100k, 61.7% for AGIs $100k-200k, 50.4% for AGIs over 200k)
Taxable interest for individuals: $2,620 (reported on 60.5% of returns)
This zip code:
$2,620
California:
$2,146
(% of AGI for various income ranges: 4.7% for AGIs below $25k, 2.2% for AGIs $25k-50k, 2.2% for AGIs $50k-75k, 1.8% for AGIs $75k-100k, 1.4% for AGIs $100k-200k, 1.6% for AGIs over 200k)
Ordinary dividends: $7,412 (reported on 38.6% of returns)
Here:
$7,412
State:
$9,308
(% of AGI for various income ranges: 6.0% for AGIs below $25k, 3.6% for AGIs $25k-50k, 3.4% for AGIs $50k-75k, 2.8% for AGIs $75k-100k, 2.2% for AGIs $100k-200k, 3.7% for AGIs over 200k)
Net capital gain/loss in AGI: +$18,172 (reported on 34.4% of returns)
Here:
+$18,172
State:
+$30,460
(% of AGI for various income ranges: 0.3% for AGIs $25k-50k, 0.5% for AGIs $50k-75k, 1.3% for AGIs $75k-100k, 1.7% for AGIs $100k-200k, 16.1% for AGIs over 200k)
Profit/loss from business: +$19,332 (reported on 16.7% of returns)
Here:
+$19,332
State:
+$17,064
(% of AGI for various income ranges: 9.9% for AGIs below $25k, 4.5% for AGIs $25k-50k, 3.5% for AGIs $50k-75k, 3.2% for AGIs $75k-100k, 3.8% for AGIs $100k-200k, 3.0% for AGIs over 200k)
Taxable individual retirement arrangement distribution: $16,182 (reported on 24.1% of returns)
90740:
$16,182
California:
$19,557
(% of AGI for various income ranges: 11.3% for AGIs below $25k, 6.4% for AGIs $25k-50k, 5.6% for AGIs $50k-75k, 5.5% for AGIs $75k-100k, 4.8% for AGIs $100k-200k, 2.6% for AGIs over 200k)
Self-employment retirement plans: $21,758 (reported on 1.4% of returns)
90740:
$21,758
California:
$24,530
(% of AGI for various income ranges: 0.5% for AGIs $50k-75k, 0.4% for AGIs $100k-200k, 0.5% for AGIs over 200k)
Total itemized deductions: $34,015 (23% of AGI, reported on 44.6% of returns)
Here:
$34,015
State:
$34,004
Here:
22.5% of AGI
State:
22.7% of AGI
(% of AGI for various income ranges: 21.0% for AGIs below $25k, 15.4% for AGIs $25k-50k, 15.3% for AGIs $50k-75k, 17.6% for AGIs $75k-100k, 19.3% for AGIs $100k-200k, 16.7% for AGIs over 200k)
Charity contributions: $4,438 (reported on 39.4% of returns)
Here:
$4,438
State:
$4,659
(% of AGI for various income ranges: 1.8% for AGIs below $25k, 1.9% for AGIs $25k-50k, 2.0% for AGIs $50k-75k, 2.2% for AGIs $75k-100k, 2.2% for AGIs $100k-200k, 1.9% for AGIs over 200k)
Taxes paid: $14,201 (reported on 44.4% of returns)
90740:
$14,201
State:
$14,448
(% of AGI for various income ranges: 3.8% for AGIs below $25k, 2.9% for AGIs $25k-50k, 4.1% for AGIs $50k-75k, 5.7% for AGIs $75k-100k, 7.7% for AGIs $100k-200k, 9.4% for AGIs over 200k)
Earned income credit: $1,376 (reported on 6.1% of returns)
Here:
$1,376
State:
$2,286
(% of AGI for various income ranges: 1.7% for AGIs below $25k, 0.3% for AGIs $25k-50k)
Percentage of individuals using paid preparers for their 2012 taxes: 65.6%
Here:
66%
State:
64%
(% for various income ranges: 56.6% for AGIs below $25k, 63.0% for AGIs $25k-50k, 68.2% for AGIs $50k-75k, 71.1% for AGIs $75k-100k, 74.0% for AGIs $100k-200k, 80.0% for AGIs over 200k)
Averages for the 2004 tax year for zip code 90740, filed in 2005:
Average Adjusted Gross Income (AGI) in 2004: $65,234 (Individual Income Tax Returns)
Here:
$65,234
State:
$58,600
Salary/wage: $65,549 (reported on 58.1% of returns)
Here:
$65,549
State:
$49,455
(% of AGI for various income ranges: 92.3% for AGIs below $10k, 35.5% for AGIs $10k-25k, 50.8% for AGIs $25k-50k, 56.9% for AGIs $50k-75k, 61.7% for AGIs $75k-100k, 61.4% for AGIs over 100k)
Taxable interest for individuals: $3,043 (reported on 71.6% of returns)
This zip code:
$3,043
California:
$2,365
(% of AGI for various income ranges: 28.9% for AGIs below $10k, 9.3% for AGIs $10k-25k, 5.0% for AGIs $25k-50k, 3.3% for AGIs $50k-75k, 3.0% for AGIs $75k-100k, 2.2% for AGIs over 100k)
Taxable dividends: $3,862 (reported on 45.3% of returns)
Here:
$3,862
State:
$4,746
(% of AGI for various income ranges: 20.8% for AGIs below $10k, 6.3% for AGIs $10k-25k, 3.8% for AGIs $25k-50k, 2.9% for AGIs $50k-75k, 2.0% for AGIs $75k-100k, 2.0% for AGIs over 100k)
Net capital gain/loss: +$8,799 (reported on 39.8% of returns)
Here:
+$8,799
State:
+$23,418
(% of AGI for various income ranges: -6.0% for AGIs below $10k, 0.2% for AGIs $10k-25k, 0.9% for AGIs $25k-50k, 1.7% for AGIs $50k-75k, 3.0% for AGIs $75k-100k, 8.3% for AGIs over 100k)
Profit/loss from business: +$20,752 (reported on 16.4% of returns)
Here:
+$20,752
State:
+$16,826
(% of AGI for various income ranges: 11.8% for AGIs below $10k, 5.6% for AGIs $10k-25k, 4.9% for AGIs $25k-50k, 4.1% for AGIs $50k-75k, 4.2% for AGIs $75k-100k, 5.6% for AGIs over 100k)
IRA payment deduction: $3,521 (reported on 3.1% of returns)
90740:
$3,521
California:
$3,192
(% of AGI for various income ranges: 0.8% for AGIs below $10k, 0.3% for AGIs $10k-25k, 0.3% for AGIs $25k-50k, 0.2% for AGIs $50k-75k, 0.2% for AGIs $75k-100k, 0.1% for AGIs over 100k)
Self-employed pension: $17,336 (reported on 1.9% of returns)
Here:
$17,336
California:
$17,688
(% of AGI for various income ranges: 0.3% for AGIs $25k-50k, 0.2% for AGIs $50k-75k, 0.3% for AGIs $75k-100k, 0.7% for AGIs over 100k)
Total itemized deductions: $27,398 (24% of AGI, reported on 43.8% of returns)
Here:
$27,398
State:
$28,113
Here:
24.4% of AGI
State:
25.3% of AGI
(% of AGI for various income ranges: 55.4% for AGIs below $10k, 19.8% for AGIs $10k-25k, 15.1% for AGIs $25k-50k, 16.9% for AGIs $50k-75k, 19.7% for AGIs $75k-100k, 18.6% for AGIs over 100k)
Charity contributions deductions: $4,004 (3% of AGI, reported on 40.3% of returns)
Here:
$4,004
State:
$3,923
Here:
3.4% of AGI
State:
3.3% of AGI
(% of AGI for various income ranges: 2.5% for AGIs below $10k, 2.4% for AGIs $10k-25k, 2.3% for AGIs $25k-50k, 2.4% for AGIs $50k-75k, 2.7% for AGIs $75k-100k, 2.5% for AGIs over 100k)
Total tax: $11,801 (reported on 82.1% of returns)
90740:
$11,801
State:
$10,761
(% of AGI for various income ranges: 5.8% for AGIs below $10k, 4.4% for AGIs $10k-25k, 8.6% for AGIs $25k-50k, 11.1% for AGIs $50k-75k, 12.0% for AGIs $75k-100k, 18.7% for AGIs over 100k)
Earned income credit: $952 (reported on 4.0% of returns)
Here:
$952
State:
$1,763
Percentage of individuals using paid preparers for their 2004 taxes: 72.0%
Here:
72%
State:
66%
(% for various income ranges: 67.0% for AGIs below $10k, 70.6% for AGIs $10k-25k, 69.7% for AGIs $25k-50k, 73.2% for AGIs $50k-75k, 74.8% for AGIs $75k-100k, 78.5% for AGIs over 100k)
Household received Food Stamps/SNAP in the past 12 months: 622 Household did not receive Food Stamps/SNAP in the past 12 months: 12,390
Women who had a birth in the past 12 months: 56 (55 now married, 0 unmarried) Women who did not have a birth in the past 12 months: 3,517 (1,621 now married, 1,886 unmarried)
Housing units in zip code 90740 with a mortgage: 3,228 (376 second mortgage, 364 both second mortgage and home equity loan) Houses without a mortgage: 174
Median monthly owner costs for units with a mortgage: $3,731 Median monthly owner costs for units without a mortgage: $636
Residents with income below the poverty level in 2022:
This zip code:
6.3%
Whole state:
12.2%
Residents with income below 50% of the poverty level in 2022:
This zip code:
3.5%
Whole state:
6.2%
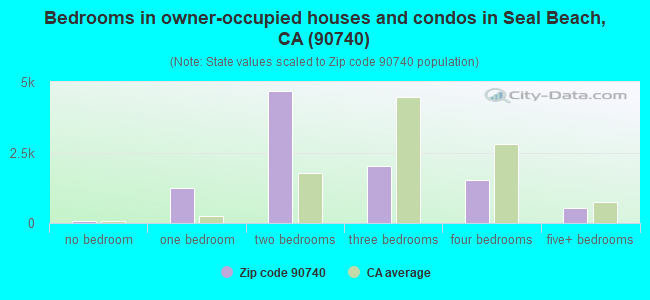
Median number of rooms in houses and condos:
Here:
4.8
State:
6.0
Median number of rooms in apartments:
Here:
3.6
State:
3.9
Notable locations in this zip code not listed on our city pages
Notable locations in zip code 90740: Anaheim Landing (A), Old Ranch Golf Course (B), Leisure World Golf Course (C), West Jetty (D), Seal Beach Pier (E), Seal Beach City Hall (F), Mary Wilson Branch Orange County Public Library (G), North Seal Beach Community Center (H), Los Alamitos-Rossmoor Branch Orange County Public Library (I), Leisure World Branch Orange County Public Library (J), Leisure World Amphitheatre (K), Seal Beach Naval Weapons Station Fire Department (L), Orange County Fire Authority Station 44 (M), Orange County Fire Authority Station 48 (N). Display/hide their locations on the map
Parks in zip code 90740 include: College Park (1), Edison Park (2), Gummere Park (3), Heather Park (4), Shapell Park (5), Eisenhower Park (6), Gum Grove Park (7), Marina Community Park (8), Zoeter Field (9). Display/hide their locations on the map
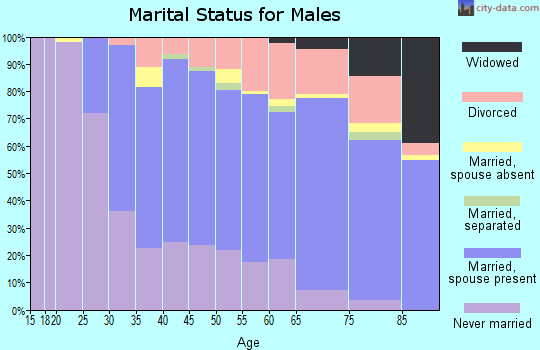
2,265 married couples with children.
517 single-parent households (156 men, 361 women).
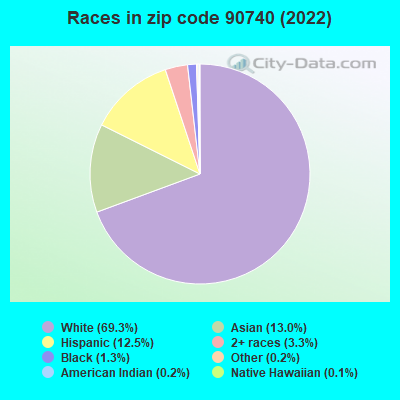
81.8% of residents of 90740 zip code speak English at home.
6.5% of residents speak Spanish at home (68% very well, 24% well, 7% not well).
3.7% of residents speak other Indo-European language at home (73% very well, 15% well, 11% not well, 1% not at all).
8.6% of residents speak Asian or Pacific Island language at home (32% very well, 32% well, 35% not well, 1% not at all).
0.8% of residents speak other language at home (42% very well, 58% well).
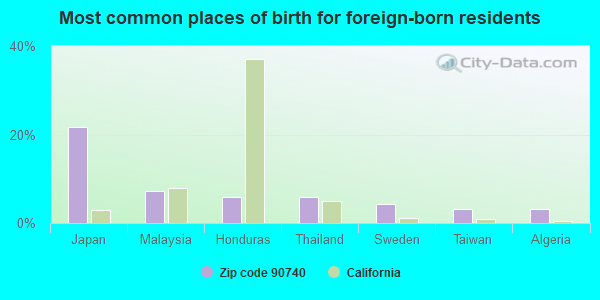
Foreign born population: 4,292 (17.6%) (87.1% of them are naturalized citizens)
This zip code:
17.6%
Whole state:
26.7%
22%Japan
7%Malaysia
6%Honduras
6%Thailand
4%Sweden
3%Taiwan
3%Algeria
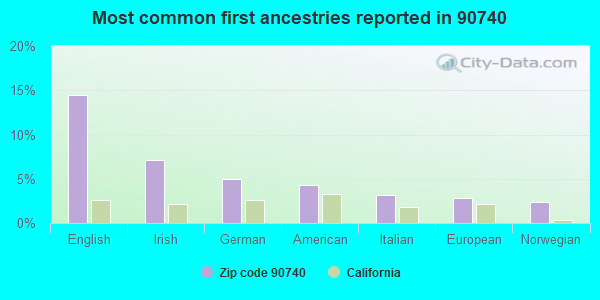
14%English
7%Irish
5%German
4%American
3%Italian
3%European
2%Norwegian
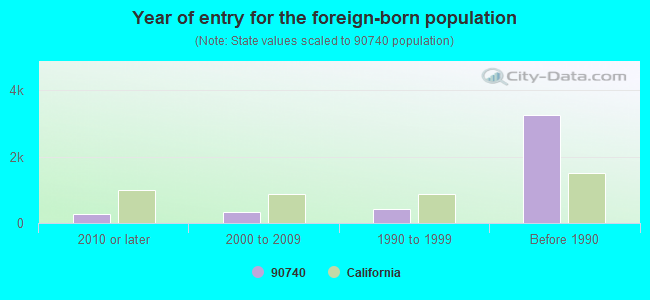
Year of entry for the foreign-born population
2592010 or later
3292000 to 2009
4251990 to 1999
3,252Before 1990
Major facilities with environmental interests located in this zip code:
NWS SEAL BEACH (800 SEAL BEACH BOULEVARD in SEAL BEACH, CA) . Federal Facility. U.S. NAVY
SUPERFUND (Superfund database) STATE MASTER (California - Hazardous Waste Tracking) - HAZARDOU WASTE PROGRAM COMPLIANCE ACTIVITY (Tracking inspections of insecticide, fungicide, and rodenticide, and toxic substances) CRITERIA AND HAZARDOUS AIR POLLUTANT INVENTORY (Inventory of air pollution sources) HAZARDOUS WASTE BIENNIAL REPORTER (Resource Conservation and Recovery Act (tracking hazardous waste)) Large Quantity Generators, more that 1000 kg of hazardous waste/month (Resource Conservation and Recovery Act (tracking hazardous waste)) TSD (Resource Conservation and Recovery Act (tracking hazardous waste)) Large Quantity Generators, more that 1000 kg of hazardous waste/month (Resource Conservation and Recovery Act (tracking hazardous waste)) - notification Business SIC classification: NATIONAL SECURITY Organizations: US NAVY (CONTACT/OPERATOR)
, PALM ENTERPRISES NAVY (CONTACT/OWNER)
Alternative names: EXPLOSIVES BURNING GROUND, NAVAL WEAPONS STATION SEAL BEACH, PALM ENTERPRIESES TREATING, PUBLIC WORKS STORAGE YARD, SAND BLAST FACILITY, SEAL BEACH LDFL, SEAL BEACH NAVAL WEAPONS STA, U S NAVAL WEAPONS STATION, USNAVY NAVAL WEAPONS STATION/SDF, USNAVY WEAPONS STATION SEAL BEACH, USNAVY WPN SUP FAC DETACH FALLBROOK, WASTE WATER SETTLING POND #1, WASTE WATER SETTLING POND #2, WEAPONS SUPPORT FACILITY SEAL BEACH
GOLDEN RAIN FOUNDATION (1280 GOLDEN RAIN RD in SEAL BEACH, CA)
STATE MASTER (California - Hazardous Waste Tracking) - HAZARDOU WASTE PROGRAM Small Quantity Generators, between 100 kg and 1000 kg of hazardous waste/month (Resource Conservation and Recovery Act (tracking hazardous waste)) - notification
M & N COASTLINE AUTO & TIRE SERVICE (12239 SEAL BEACH BLVD in SEAL BEACH, CA)
Small Quantity Generators, between 100 kg and 1000 kg of hazardous waste/month (Resource Conservation and Recovery Act (tracking hazardous waste)) - notification STATE MASTER (California - Used Oil Recycling System ) - USED OIL RECYCLING Organizations: LOU VIGNES (CONTACT/OWNER)
Alternative names: GOODYEAR
CHEVRON STATION NO 95568 (12541 SEAL BEACH BLVD in SEAL BEACH, CA)
Small Quantity Generators, between 100 kg and 1000 kg of hazardous waste/month (Resource Conservation and Recovery Act (tracking hazardous waste)) - notification STATE MASTER (California - Used Oil Recycling System ) - USED OIL RECYCLING Organizations: CHEVRON PRODUCTS CO (CONTACT/OWNER)
Alternative names: SEAL BEACH CHEVRON, TOMMY FAUGHT CHEVRON SERVICE INC
MCGAUGH (J.H.) ELEMENTARY (1698 BOLSA AVE. in SEAL BEACH, CA)
(National Center for Education Statistics) - STATE ID-6030514 Organizations: LOS ALAMITOS UNIFIED (SCHOOL DISTRICT)
EXXONMOBIL OIL CORP. (12240 SEAL BEACH BLVD in SEAL BEACH, CA)
HAZARDOUS WASTE BIENNIAL REPORTER (Resource Conservation and Recovery Act (tracking hazardous waste)) Large Quantity Generators, more that 1000 kg of hazardous waste/month (Resource Conservation and Recovery Act (tracking hazardous waste)) Organizations: EXXONMOBIL OIL CORPORATION (CONTACT/OWNER)
CHEVRONTEXACO E&P CO (6208 WESTMINISTER BLVD in SEAL BEACH, CA)
Large Quantity Generators, more that 1000 kg of hazardous waste/month (Resource Conservation and Recovery Act (tracking hazardous waste)) Organizations: CHEVRONTEXACO E AND P CO (CONTACT/OPERATOR)
Alternative names: TEXACO - SEAL BEACH FIELD
HARBOUR SURFBOARDS (329 MAIN ST in SEAL BEACH, CA)
Small Quantity Generators, between 100 kg and 1000 kg of hazardous waste/month (Resource Conservation and Recovery Act (tracking hazardous waste)) Small Quantity Generators, between 100 kg and 1000 kg of hazardous waste/month (Resource Conservation and Recovery Act (tracking hazardous waste))
A 1 CLEARNERS (1198 PACIFIC COAST HWY in SEAL BEACH, CA)
Small Quantity Generators, between 100 kg and 1000 kg of hazardous waste/month (Resource Conservation and Recovery Act (tracking hazardous waste)) - notification Organizations: CHOI SUNG GIL (CONTACT/OWNER)
ED DIXON ENT INC (12240 SEAL BEACH in SEAL BEACH, CA)
Small Quantity Generators, between 100 kg and 1000 kg of hazardous waste/month (Resource Conservation and Recovery Act (tracking hazardous waste)) - notification Organizations: MOBIL OIL CORP (CONTACT/OWNER)
HARTWELL SHELL SER (347 MAIN ST in SEAL BEACH, CA)
Small Quantity Generators, between 100 kg and 1000 kg of hazardous waste/month (Resource Conservation and Recovery Act (tracking hazardous waste)) - notification Organizations: HARTWELL JAMES (CONTACT/OWNER)
INDUSTRIAL WASTE OIL (321 8TH ST in SEAL BEACH, CA)
TRANSPORTER (Resource Conservation and Recovery Act (tracking hazardous waste)) Organizations: KIM MARK DE MEIRE (CONTACT/OWNER)
JIMS CHEVRON SVC (2950 WESTMINSTER in SEAL BEACH, CA)
Small Quantity Generators, between 100 kg and 1000 kg of hazardous waste/month (Resource Conservation and Recovery Act (tracking hazardous waste)) - notification Organizations: HOLECHEK JIM (CONTACT/OWNER)
Housing units lacking complete plumbing facilities: 0.4% Housing units lacking complete kitchen facilities: 1.4%
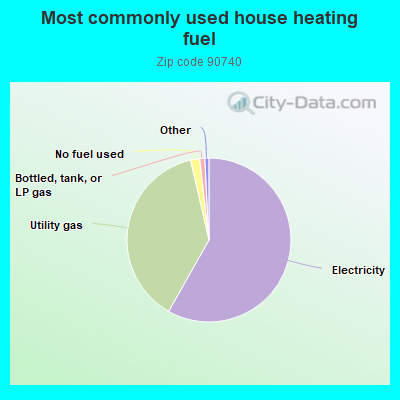
58.2%Electricity
38.2%Utility gas
1.8%No fuel used
1.0%Bottled, tank, or LP gas
Population in 1990: 24,537.
Place of birth for U.S.-born residents:
This state: 12,494
Northeast: 1,684
Midwest: 2,613
South: 1,769
West: 1,224
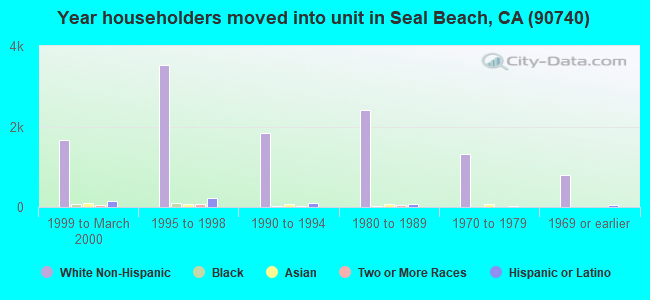
55% of the 90740 zip code residents lived in the same house 5 years ago. Out of people who lived in different houses, 40% lived in this county. Out of people who lived in different counties, 50% lived in California.
91% of the 90740 zip code residents lived in the same house 1 year ago. Out of people who lived in different houses, 43% moved from this county. Out of people who lived in different houses, 42% moved from different county within same state. Out of people who lived in different houses, 13% moved from different state. Out of people who lived in different houses, 4% moved from abroad.
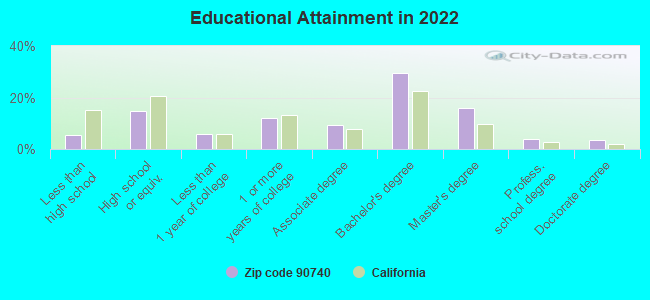
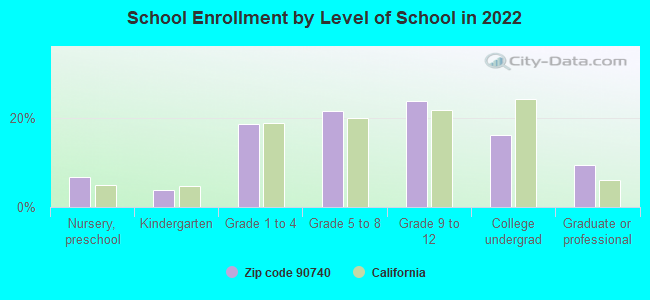
Private vs. public school enrollment:
Students in private schools in grades 1 to 8 (elementary and middle school): 119
Here:
7.9%
California:
10.5%
Students in private schools in grades 9 to 12 (high school): 105
Here:
11.9%
California:
8.5%
Students in private undergraduate colleges: 90
Here:
14.9%
California:
15.9%
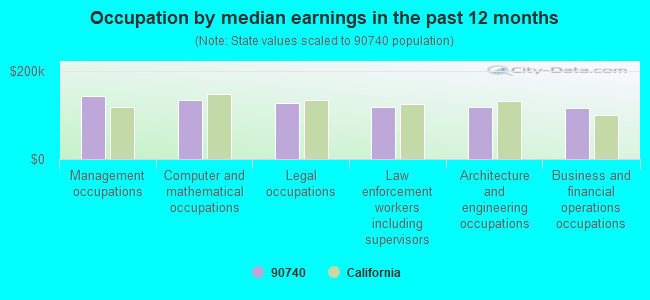
Occupation by median earnings in the past 12 months ($)
142,774Management occupations
132,622Computer and mathematical occupations
127,932Legal occupations
118,846Law enforcement workers including supervisors
117,832Architecture and engineering occupations
115,289Business and financial operations occupations
Companies with federal contracts located in this zip code (SEAL BEACH, CA):
THE BOEING COMPANY (2600 WESTMINSTER AVE) : $1,426,096,125 in 833 contractsfrom 1999 to 2006
Contracts for Aircraft, Fixed Wing, Systems Engineering Services, Airframe Structural Components, Modification of Equipment -- Miscellaneous, and moreby Air Force, Defense Logistics Agency, Navy Signed by year:2000: $175,533,296; 2001: $204,717,901; 2002: $218,355,186; 2003: $242,114,767; 2004: $164,676,554; 2005: $171,342,586; 2006: $150,754,613.
Biggest contracts:
$49,289,191 with Air Force for Aircraft, Fixed Wing. Signed on 2006-02-02. Completion date: 2008-05-30.
$47,261,969 with Air Force for Systems Engineering Services. Signed on 2003-08-01. Completion date: 2003-12-31.
$40,000,000 with Air Force for Aircraft, Fixed Wing. Signed on 1999-12-09. Completion date: 2002-02-28.
$33,744,000, same as above.Signed on 2005-06-13. Completion date: 2008-05-30.
THE BOEING COMPANY (2201 SEAL BEACH BLVD) : $21,188,442 in 48 contractsfrom 2000 to 2005
Contracts for Maintenance, Repair and Rebuilding of Equipment -- Miscellaneous, Weapons -- Advanced Development (R&D), Operation of Government-Owned Facilities -- Government-Owned Contractor-Operated (GOCO) R&D Facilities, Space Vehicles, and moreby Army, Air Force, ENERGY, Department of, Department of Defense, and others Signed by year:2000: -$800,000; 2001: $2,530,922; 2002: $3,634,500; 2003: $1,250,000; 2004: $14,573,020; 2005: $0; 2006: $0.
Biggest contracts:
$8,430,684 with Army for Maintenance, Repair and Rebuilding of Equipment -- Miscellaneous. Signed on 2004-01-16. Completion date: 2008-12-31.
$3,600,000, same as above.Signed on 2004-12-16. Completion date: 2008-12-31.
$1,502,019, same as above.Signed on 2004-03-03. Completion date: 2008-12-31.
$1,000,000, same as above.Signed on 2003-12-19. Completion date: 2008-12-31.
BOEING NORTH AMERICAN INC (2201SEAL BEACH BLVD) : $4,877,804 in 56 contractsfrom 1999 to 2001
Contracts for Space Vehicles, Weapons -- Advanced Development (R&D), Defense Missile and Space Systems -- Advanced Development (R&D) by Air Force, Army Signed by year:2000: $3,231,476; 2001: $1,084,328; 2002: $0; 2003: $0; 2004: $0; 2005: $0; 2006: $0.
Biggest contracts:
$650,000 with Air Force for Space Vehicles. Taking place in VA. Signed on 2000-09-28. Completion date: 2000-12-23.
$540,000 with Air Force for Weapons -- Advanced Development (R&D). Signed on 2000-01-20. Completion date: 2000-08-31.
$400,000, same as above.Signed on 2000-12-18. Completion date: 2003-03-04.
$400,000, same as above.Signed on 1999-12-09. Completion date: 2000-08-31.
SPECTRASCAN CORPORATION INC (909 ELECTRIC AVENUE, SUITE; small business) : $905,930 in 8 contractsfrom 2002 to 2005
Contracts for Other Defense -- Applied Research and Exploratory Development (R&D), Other Defense -- Operational Systems Development (R&D), Other Defense -- Advanced Development (R&D), Other Defense -- Management and Support (R&D) by Navy Signed by year:2000: $0; 2001: $0; 2002: $100,000; 2003: $220,000; 2004: $419,929; 2005: $166,001; 2006: $0.
Biggest contracts:
$220,000 with Navy for Other Defense -- Applied Research and Exploratory Development (R&D). Signed on 2003-06-30. Completion date: 2005-04-30.
$204,929 with Navy for Other Defense -- Operational Systems Development (R&D). Signed on 2004-11-23. Completion date: 2005-04-30.
$166,001 with Navy for Other Defense -- Advanced Development (R&D). Signed on 2005-06-09. Completion date: 2006-04-30.
$119,895, same as above.Signed on 2004-10-14. Completion date: 2005-04-30.
BAKER TANKS, INC (3020 OLD RANCH PKWY STE 22) : $291,766 in 26 contractsfrom 2002 to 2006
Contracts for Lease or Rental of Equipment -- Water Purification and Sewage Treatment Equipment, Lease or Rental of Equipment -- Prefabricated Structures and Scaffolding, Specialized Metal Container Manufacturing Machinery and Related Equipment, Lease or Rental of Equipment -- Pumps and Compressors, and moreby Federal Highway Administration, Navy, Army, Federal Emergency Management Agency, and others Signed by year:2000: $0; 2001: $0; 2002: $59,000; 2003: $0; 2004: $91,882; 2005: $105,963; 2006: $34,921.
Biggest contracts:
$32,000 with Federal Highway Administration for Lease or Rental of Equipment -- Water Purification and Sewage Treatment Equipment. Taking place in AK. Signed on 2002-09-15. Completion date: 2002-11-15.
$29,333 with Navy for Lease or Rental of Equipment -- Prefabricated Structures and Scaffolding. Signed on 2005-06-09. Completion date: 2005-02-17.
$27,000 with Federal Highway Administration for Lease or Rental of Equipment -- Water Purification and Sewage Treatment Equipment. Taking place in AK. Signed on 2002-04-15. Completion date: 2002-07-15.
$25,000 with Army for Specialized Metal Container Manufacturing Machinery and Related Equipment. Taking place in MD. Signed on 2004-12-29. Completion date: 2005-06-06.
ALPINE DESIGN AND PLASTICS (4284 ELDER AVE; small business)
$23,083 with Navy for Laboratory Equipment and Supplies. Signed on 2006-02-03. Completion date: 2006-04-14.
DELORES A, HUDSON (13342 DEL MONTE DRIVE 5L; small business) : $12,860 in 2 contractsin 2001
$12,860 with U.S. Army Corps of Engineers - civil program financing only for Financial Services (includes credit card services and any other financial services. See revision to description for code R703 above). Signed on 2001-11-13. Completion date: 2002-05-20.
$0, same as above.Signed on 2001-11-13. Completion date: 2002-05-20.
PINNACLE PETROLEUM INC (1500 EAST PACIFIC COAST HI; small business)
$12,682 with Army for Fuel Oils. Signed on 2004-09-23. Completion date: 2004-09-23.
COSMODYNE, LLC (3010 OLD RANCH PKWY # 300; small business) : -$140,297 in 31 contractsfrom 1999 to 2006
Contracts for Refrigeration and Air Conditioning Components, Maintenance, Repair and Rebuilding of Equipment -- Service and Trade Equipment, Valves, Nonpowered, Miscellaneous Items, and moreby Air Force, Minerals Management Service, Navy, Army, and others Signed by year:2000: -$1,628,840; 2001: $433,950; 2002: $324,422; 2003: $341,906; 2004: $177,346; 2005: $146,418; 2006: $29,960.
Biggest contracts:
$374,924 with Air Force for Refrigeration and Air Conditioning Components. Signed on 2001-12-17. Completion date: 2002-01-15.
$112,000 with Minerals Management Service for Maintenance, Repair and Rebuilding of Equipment -- Service and Trade Equipment. Signed on 2002-09-15. Completion date: 2002-11-15.
$97,783 with Navy for Valves, Nonpowered. Signed on 2002-02-21. Completion date: 2002-08-24.
$93,582 with Air Force for Miscellaneous Items. Signed on 2003-09-29. Completion date: 2003-11-29.
Top industries in this zip code by the number of employees in 2005:
Health Care and Social Assistance: Nursing Care Facilities (100-249: 1, 1-4: 2)
Other Services (except Public Administration): Other Similar Organizations (except Business, Professional, Labor, and Political Organizations) (100-249: 1, 1-4: 1)
Arts, Entertainment, and Recreation: Golf Courses and Country Clubs (100-249: 1)
People in group quarters in 2010:
183 people in nursing facilities/skilled-nursing facilities
14 people in military barracks and dormitories (nondisciplinary)
13 people in local jails and other municipal confinement facilities
7 people in in-patient hospice facilities
4 people in residential treatment centers for adults
4 people in other noninstitutional facilities
People in group quarters in 2000:
188 people in nursing homes
34 people in military barracks, etc.
25 people in local jails and other confinement facilities (including police lockups)
4 people in other noninstitutional group quarters
2 people in religious group quarters
Fatal accident statistics in 2014:
Fatal accident count: 1
Vehicles involved in fatal accidents: 1
Fatal accidents caused by drunken drivers: 0
Fatalities: 1
Persons involved in fatal accidents: 1
Pedestrians involved in fatal accidents: 0
Fatal accident statistics in 2013:
Fatal accident count: 3
Vehicles involved in fatal accidents: 5
Fatal accidents caused by drunken drivers: 0
Fatalities: 3
Persons involved in fatal accidents: 5
Pedestrians involved in fatal accidents: 0
Home Mortgage Disclosure Act Aggregated Statistics For Year 2009 (Based on 7 full and 10 partial tracts)
A) FHA, FSA/RHS & VA Home Purchase Loans
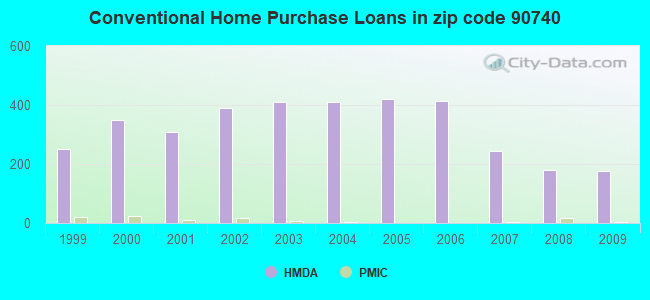
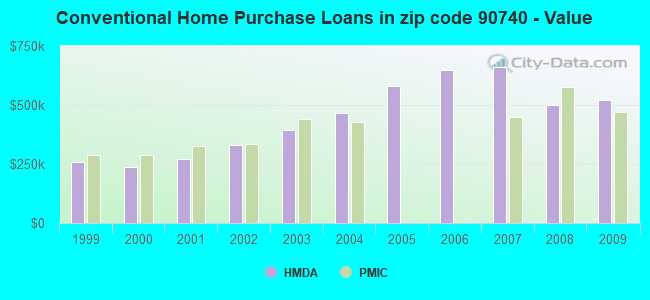
B) Conventional Home Purchase Loans
C) Refinancings
D) Home Improvement Loans
E) Loans on Dwellings For 5+ Families
F) Non-occupant Loans on < 5 Family Dwellings (A B C & D)
G) Loans On Manufactured Home Dwelling (A B C & D)
Number
Average Value
Number
Average Value
Number
Average Value
Number
Average Value
Number
Average Value
Number
Average Value
Number
Average Value
LOANS ORIGINATED
18
$550,048
175
$520,072
1,129
$406,414
55
$288,031
6
$669,637
63
$383,011
0
$0
APPLICATIONS APPROVED, NOT ACCEPTED
0
$0
20
$598,264
112
$477,243
0
$0
0
$0
7
$401,806
2
$54,440
APPLICATIONS DENIED
8
$588,252
44
$568,589
222
$498,632
15
$311,561
5
$674,184
19
$257,096
0
$0
APPLICATIONS WITHDRAWN
5
$347,536
17
$567,564
178
$429,409
7
$301,577
0
$0
8
$346,791
2
$135,245
FILES CLOSED FOR INCOMPLETENESS
6
$573,875
7
$479,716
61
$414,888
7
$147,253
0
$0
5
$436,150
0
$0
Aggregated Statistics For Year 2008 (Based on 7 full and 10 partial tracts)
A) FHA, FSA/RHS & VA Home Purchase Loans
B) Conventional Home Purchase Loans
C) Refinancings
D) Home Improvement Loans
E) Loans on Dwellings For 5+ Families
F) Non-occupant Loans on < 5 Family Dwellings (A B C & D)
G) Loans On Manufactured Home Dwelling (A B C & D)
Number
Average Value
Number
Average Value
Number
Average Value
Number
Average Value
Number
Average Value
Number
Average Value
Number
Average Value
LOANS ORIGINATED
6
$664,748
179
$501,667
416
$447,832
38
$328,600
5
$813,516
70
$530,988
3
$237,523
APPLICATIONS APPROVED, NOT ACCEPTED
2
$579,260
39
$461,360
80
$391,617
9
$95,744
0
$0
9
$338,647
4
$58,920
APPLICATIONS DENIED
2
$667,015
45
$537,561
146
$527,584
19
$307,616
2
$401,300
25
$470,389
5
$91,864
APPLICATIONS WITHDRAWN
1
$459,940
23
$468,094
69
$479,985
3
$137,467
2
$1,074,310
15
$266,083
0
$0
FILES CLOSED FOR INCOMPLETENESS
0
$0
10
$645,807
29
$457,361
0
$0
0
$0
5
$403,316
0
$0
Aggregated Statistics For Year 2007 (Based on 7 full and 10 partial tracts)
B) Conventional Home Purchase Loans
C) Refinancings
D) Home Improvement Loans
E) Loans on Dwellings For 5+ Families
F) Non-occupant Loans on < 5 Family Dwellings (A B C & D)
G) Loans On Manufactured Home Dwelling (A B C & D)
Number
Average Value
Number
Average Value
Number
Average Value
Number
Average Value
Number
Average Value
Number
Average Value
LOANS ORIGINATED
244
$659,735
524
$511,413
72
$300,855
3
$1,565,070
68
$680,612
2
$56,140
APPLICATIONS APPROVED, NOT ACCEPTED
57
$648,238
129
$590,203
28
$253,430
0
$0
17
$510,752
7
$183,424
APPLICATIONS DENIED
82
$556,856
191
$599,550
45
$289,721
0
$0
35
$675,580
10
$147,603
APPLICATIONS WITHDRAWN
32
$770,101
120
$469,225
31
$237,394
0
$0
17
$616,508
0
$0
FILES CLOSED FOR INCOMPLETENESS
5
$636,470
59
$568,866
2
$192,520
0
$0
7
$619,223
0
$0
Aggregated Statistics For Year 2006 (Based on 7 full and 10 partial tracts)
B) Conventional Home Purchase Loans
C) Refinancings
D) Home Improvement Loans
E) Loans on Dwellings For 5+ Families
F) Non-occupant Loans on < 5 Family Dwellings (A B C & D)
G) Loans On Manufactured Home Dwelling (A B C & D)
Number
Average Value
Number
Average Value
Number
Average Value
Number
Average Value
Number
Average Value
Number
Average Value
LOANS ORIGINATED
414
$649,817
609
$493,972
115
$351,812
10
$542,783
115
$580,629
6
$56,315
APPLICATIONS APPROVED, NOT ACCEPTED
89
$631,565
93
$467,032
15
$358,358
0
$0
14
$665,299
7
$163,270
APPLICATIONS DENIED
88
$612,394
199
$552,201
25
$250,500
0
$0
39
$592,255
4
$43,722
APPLICATIONS WITHDRAWN
89
$817,892
148
$476,542
6
$262,383
0
$0
17
$841,790
0
$0
FILES CLOSED FOR INCOMPLETENESS
20
$652,369
46
$553,254
3
$182,913
0
$0
13
$670,285
0
$0
Aggregated Statistics For Year 2005 (Based on 7 full and 10 partial tracts)
B) Conventional Home Purchase Loans
C) Refinancings
D) Home Improvement Loans
E) Loans on Dwellings For 5+ Families
F) Non-occupant Loans on < 5 Family Dwellings (A B C & D)
G) Loans On Manufactured Home Dwelling (A B C & D)
Number
Average Value
Number
Average Value
Number
Average Value
Number
Average Value
Number
Average Value
Number
Average Value
LOANS ORIGINATED
421
$578,570
815
$444,404
138
$296,359
8
$875,070
123
$510,605
2
$64,645
APPLICATIONS APPROVED, NOT ACCEPTED
73
$454,642
97
$468,417
12
$82,798
0
$0
17
$518,253
10
$138,243
APPLICATIONS DENIED
164
$579,213
190
$452,634
25
$249,991
2
$561,820
47
$583,093
1
$47,130
APPLICATIONS WITHDRAWN
84
$521,868
214
$417,370
18
$297,435
2
$988,805
23
$677,494
0
$0
FILES CLOSED FOR INCOMPLETENESS
32
$575,672
66
$520,980
2
$309,780
0
$0
10
$599,484
0
$0
Aggregated Statistics For Year 2004 (Based on 7 full and 10 partial tracts)
B) Conventional Home Purchase Loans
C) Refinancings
D) Home Improvement Loans
E) Loans on Dwellings For 5+ Families
F) Non-occupant Loans on < 5 Family Dwellings (A B C & D)
G) Loans On Manufactured Home Dwelling (A B C & D)
Number
Average Value
Number
Average Value
Number
Average Value
Number
Average Value
Number
Average Value
Number
Average Value
LOANS ORIGINATED
411
$468,027
1,140
$387,584
106
$262,656
7
$564,741
159
$413,082
2
$99,410
APPLICATIONS APPROVED, NOT ACCEPTED
63
$399,021
174
$381,074
14
$288,655
0
$0
33
$333,371
7
$118,079
APPLICATIONS DENIED
56
$446,159
173
$458,845
17
$193,844
0
$0
23
$578,757
5
$135,076
APPLICATIONS WITHDRAWN
84
$430,602
177
$451,048
18
$190,326
0
$0
23
$345,013
2
$54,920
FILES CLOSED FOR INCOMPLETENESS
17
$422,967
83
$395,981
16
$196,119
0
$0
2
$128,440
0
$0
Aggregated Statistics For Year 2003 (Based on 7 full and 10 partial tracts)
A) FHA, FSA/RHS & VA Home Purchase Loans
B) Conventional Home Purchase Loans
C) Refinancings
D) Home Improvement Loans
E) Loans on Dwellings For 5+ Families
F) Non-occupant Loans on < 5 Family Dwellings (A B C & D)
Number
Average Value
Number
Average Value
Number
Average Value
Number
Average Value
Number
Average Value
Number
Average Value
LOANS ORIGINATED
2
$268,690
409
$393,479
3,242
$308,072
59
$123,904
8
$1,002,336
226
$296,950
APPLICATIONS APPROVED, NOT ACCEPTED
0
$0
78
$359,179
378
$316,729
11
$146,350
2
$160,520
37
$315,473
APPLICATIONS DENIED
0
$0
76
$471,504
382
$381,537
8
$21,475
0
$0
33
$319,766
APPLICATIONS WITHDRAWN
2
$204,915
45
$414,151
371
$338,286
12
$213,628
2
$160,520
34
$270,971
FILES CLOSED FOR INCOMPLETENESS
0
$0
27
$405,118
86
$366,359
5
$62,464
0
$0
11
$216,205
Aggregated Statistics For Year 2002 (Based on 7 full and 6 partial tracts)
A) FHA, FSA/RHS & VA Home Purchase Loans
B) Conventional Home Purchase Loans
C) Refinancings
D) Home Improvement Loans
F) Non-occupant Loans on < 5 Family Dwellings (A B C & D)
Number
Average Value
Number
Average Value
Number
Average Value
Number
Average Value
Number
Average Value
LOANS ORIGINATED
3
$203,670
391
$332,129
1,695
$275,221
33
$127,338
68
$245,530
APPLICATIONS APPROVED, NOT ACCEPTED
2
$188,010
50
$367,591
221
$278,876
7
$97,276
9
$175,242
APPLICATIONS DENIED
0
$0
36
$338,899
218
$313,965
15
$55,457
7
$290,804
APPLICATIONS WITHDRAWN
2
$165,565
40
$283,046
250
$276,690
7
$127,530
7
$223,779
FILES CLOSED FOR INCOMPLETENESS
0
$0
19
$369,645
82
$295,554
1
$32,950
2
$619,795
Aggregated Statistics For Year 2001 (Based on 7 full and 6 partial tracts)
A) FHA, FSA/RHS & VA Home Purchase Loans
B) Conventional Home Purchase Loans
C) Refinancings
D) Home Improvement Loans
F) Non-occupant Loans on < 5 Family Dwellings (A B C & D)
Number
Average Value
Number
Average Value
Number
Average Value
Number
Average Value
Number
Average Value
LOANS ORIGINATED
9
$208,296
309
$271,307
1,017
$242,444
55
$59,335
37
$211,175
APPLICATIONS APPROVED, NOT ACCEPTED
0
$0
48
$230,069
120
$246,215
5
$41,758
9
$122,741
APPLICATIONS DENIED
1
$82,580
39
$293,038
118
$240,034
13
$54,101
6
$370,957
APPLICATIONS WITHDRAWN
1
$137,090
24
$248,321
154
$259,268
6
$55,208
3
$185,297
FILES CLOSED FOR INCOMPLETENESS
0
$0
17
$460,551
37
$243,146
1
$137,760
0
$0
Aggregated Statistics For Year 2000 (Based on 7 full and 6 partial tracts)
A) FHA, FSA/RHS & VA Home Purchase Loans
B) Conventional Home Purchase Loans
C) Refinancings
D) Home Improvement Loans
F) Non-occupant Loans on < 5 Family Dwellings (A B C & D)
Number
Average Value
Number
Average Value
Number
Average Value
Number
Average Value
Number
Average Value
LOANS ORIGINATED
6
$149,553
348
$238,457
278
$180,232
83
$43,288
12
$162,237
APPLICATIONS APPROVED, NOT ACCEPTED
2
$84,850
56
$246,621
43
$175,969
12
$39,638
1
$121,950
APPLICATIONS DENIED
4
$87,518
49
$287,720
99
$179,342
23
$52,119
2
$315,735
APPLICATIONS WITHDRAWN
0
$0
28
$236,427
67
$151,668
15
$46,127
3
$91,110
FILES CLOSED FOR INCOMPLETENESS
2
$217,585
16
$211,420
15
$164,867
3
$44,273
0
$0
Aggregated Statistics For Year 1999 (Based on 3 full and 5 partial tracts)
A) FHA, FSA/RHS & VA Home Purchase Loans
B) Conventional Home Purchase Loans
C) Refinancings
D) Home Improvement Loans
E) Loans on Dwellings For 5+ Families
F) Non-occupant Loans on < 5 Family Dwellings (A B C & D)

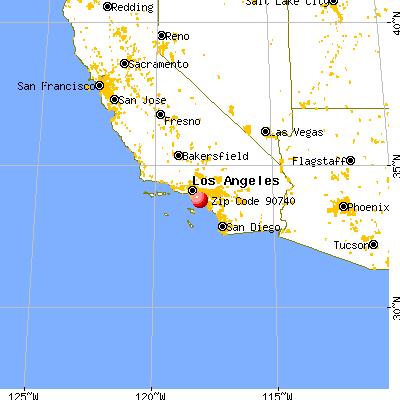


 Nearest zip codes: 90743, 90720, 92649, 90742, 90822, 92845.


 . Federal Facility. U.S. NAVY