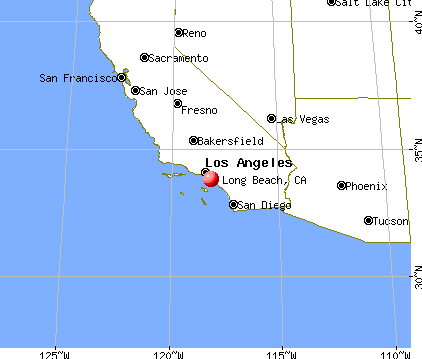
Long Beach, California

Long Beach: Queen Mary with an active Cruise Ship right behind

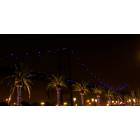
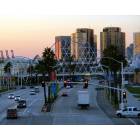
Long Beach: Downtown NightLife

Long Beach: Shoreline Village Light House, Long Beach, CA

Long Beach: Queen Mary, Long Beach, CA

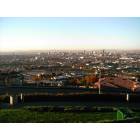
Long Beach: Ocean Blvd, shot from Wells Fargo Building terrace
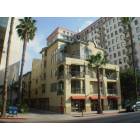
Long Beach: Long Beach
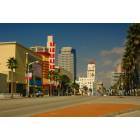
Long Beach: Pine Avenue
Long Beach: port of LA at long beach
Long Beach: Downtown
Long Beach: downtown LBC

Long Beach: The New Skyline from the New Pike's Footbridge.
- see
64
more - add
your
Submit your own pictures of this city and show them to the world
- OSM Map
- General Map
- Google Map
- MSN Map
Population change since 2000: -2.2%
 |
| Males: 222,838 | |
| Females: 228,469 |
| Median resident age: | 36.7 years |
| California median age: | 37.9 years |
Zip codes: 90731, 90755, 90802, 90803, 90804, 90806, 90808, 90813, 90814, 90815, 90822, 90831.
Long Beach Zip Code Map| Long Beach: | $80,493 |
| CA: | $91,551 |
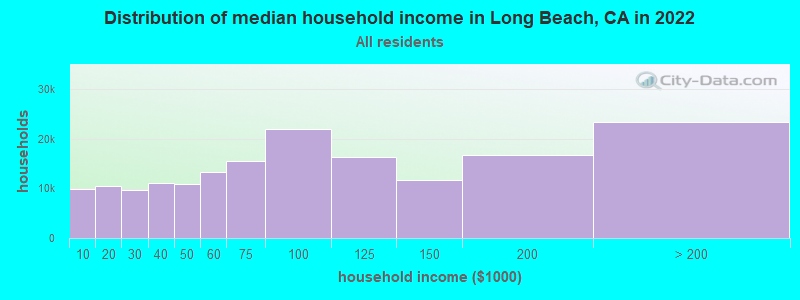
Estimated per capita income in 2022: $41,896 (it was $19,040 in 2000)
Long Beach city income, earnings, and wages data
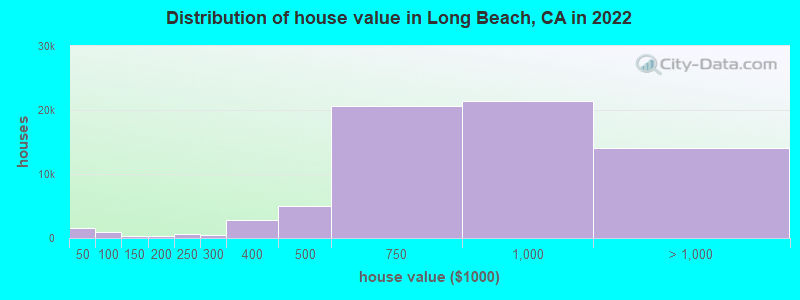
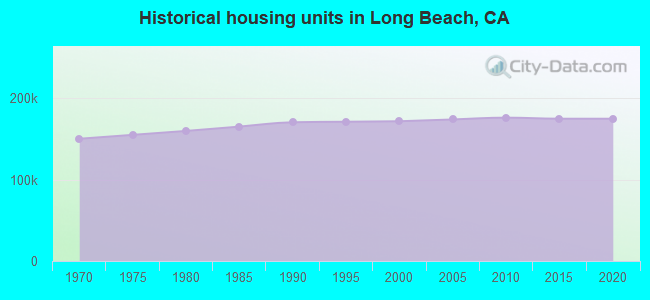
Estimated median house or condo value in 2022: $772,500 (it was $198,600 in 2000)
| Long Beach: | $772,500 |
| CA: | $715,900 |
Mean prices in 2022: all housing units: $835,726; detached houses: $921,752; townhouses or other attached units: $680,027; in 2-unit structures: over $1,000,000; in 3-to-4-unit structures: $523,902; in 5-or-more-unit structures: $514,129; mobile homes: $225,621; occupied boats, rvs, vans, etc.: $22,411
Median gross rent in 2022: $1,743.
(9.9% for White Non-Hispanic residents, 17.6% for Black residents, 16.0% for Hispanic or Latino residents, 13.6% for American Indian residents, 7.1% for Native Hawaiian and other Pacific Islander residents, 16.9% for other race residents, 15.2% for two or more races residents)
Detailed information about poverty and poor residents in Long Beach, CA


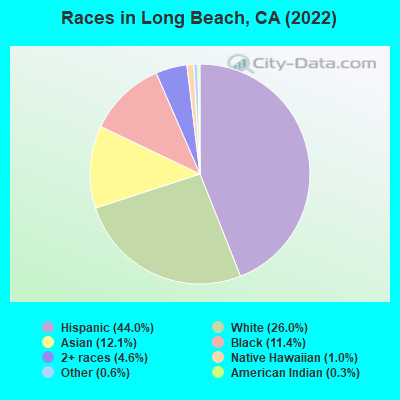
- 198,73744.0%Hispanic
- 117,42126.0%White alone
- 54,56212.1%Asian alone
- 51,44711.4%Black alone
- 20,9374.6%Two or more races
- 4,3021.0%Native Hawaiian and Other
Pacific Islander alone - 2,5230.6%Other race alone
- 1,3900.3%American Indian alone
According to our research of California and other state lists, there were 807 registered sex offenders living in Long Beach, California as of April 26, 2024.
The ratio of all residents to sex offenders in Long Beach is 583 to 1.
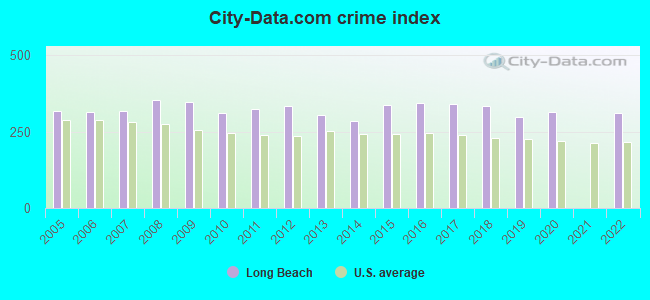
The City-Data.com crime index weighs serious crimes and violent crimes more heavily. Higher means more crime, U.S. average is 246.1. It adjusts for the number of visitors and daily workers commuting into cities.
- means the value is smaller than the state average.- means the value is about the same as the state average.
- means the value is bigger than the state average.
- means the value is much bigger than the state average.
Crime rate in Long Beach detailed stats: murders, rapes, robberies, assaults, burglaries, thefts, arson
Full-time law enforcement employees in 2021, including police officers: 1,023 (772 officers - 679 male; 93 female).
| Officers per 1,000 residents here: | 1.70 |
| California average: | 2.30 |
 Recent articles from our blog. Our writers, many of them Ph.D. graduates or candidates, create easy-to-read articles on a wide variety of topics.

 | Moving out of Long Beach - Torrance vs. Redondo Beach vs. Another Option? (8 replies) |
| Relocation Santa Monica vs Long Beach (13 replies) |
| May be moving to Long Beach after COVID. How long are these commutes? (6 replies) |
| Moving to Long Beach area (5 replies) |
| considering moving to Long Beach (3 replies) |
| Sacramento,CA VS. Long Beach,CA (147 replies) |
Latest news from Long Beach, CA collected exclusively by city-data.com from local newspapers, TV, and radio stations
Long Beach, CA City Guides:
Ancestries: Irish (2.2%), German (2.0%), English (1.9%), American (1.6%), Italian (1.5%), European (1.4%).
Current Local Time: PST time zone
Elevation: 29 feet
Land area: 50.4 square miles.
Population density: 8,947 people per square mile (high).
110,588 residents are foreign born (14.9% Latin America, 7.5% Asia).
| This city: | 24.5% |
| California: | 26.5% |
Median real estate property taxes paid for housing units with mortgages in 2022: $5,715 (0.7%)
Median real estate property taxes paid for housing units with no mortgage in 2022: $3,830 (0.5%)
Nearest city with pop. 1,000,000+: Los Angeles, CA  (23.2 miles , pop. 3,694,820).
Nearest cities:
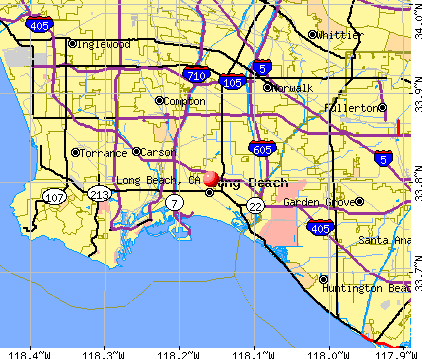
), ), ), )Latitude: 33.80 N, Longitude: 118.16 W
Daytime population change due to commuting: -34,355 (-7.6%)
Workers who live and work in this city: 93,457 (41.0%)
Area code: 562
Property values in Long Beach, CA
Long Beach tourist attractions:
- Aquarium of the Pacific in Long Beach, California
- Residence Inn by Marriott Long Beach Downtown
- California State University Long Beach
- Bixby Park
- City Beach
- Downtown Long Beach
- Earl Burns Miller Japanese Garden
- East 4th Street
- Laugh Factory
- Leeway Sailing Center
- Long Beach Convention & Entertainment Center
- Long Beach East Village Arts District
- Long Beach Museum of Art
- Long Beach Playhouse
- Long Beach Sportfishing
- Long Beach Waterfront
- Museum of Latin American Art
- Naples Island
- Hotel Maya
- International City Theatre
- Pine Avenue
- Rancho Los Alamitos
- Rancho Los Cerritos
- The Westin Long Beach
- The Queen Mary
- The Terrace Theater
- The Walter Pyramid
- Shoreline Pedestrian Bikepath
- Skinny House
- Skylinks Golf Course
- World's Largest Flag
- AVIA Long Beach
- Toyota Grand Prix of Long Beach
- Scorpion Submarine
- Shoreline Village
- Renaissance Long Beach Hotel
Long Beach, California accommodation & food services, waste management - Economy and Business Data
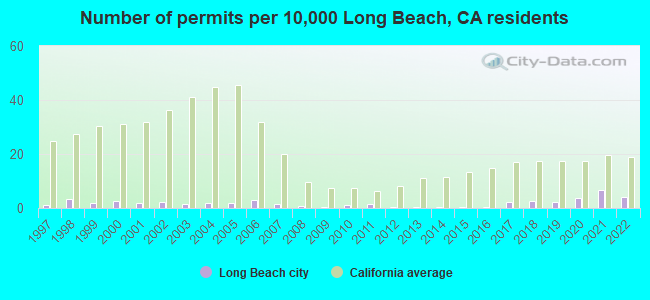
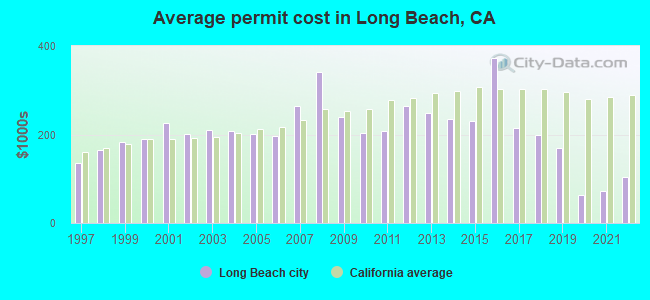
Single-family new house construction building permits:
- 2022: 192 buildings, average cost: $103,000
- 2021: 304 buildings, average cost: $72,800
- 2020: 174 buildings, average cost: $62,600
- 2019: 100 buildings, average cost: $169,400
- 2018: 128 buildings, average cost: $198,100
- 2017: 104 buildings, average cost: $215,300
- 2016: 22 buildings, average cost: $371,900
- 2015: 20 buildings, average cost: $230,900
- 2014: 25 buildings, average cost: $234,600
- 2013: 20 buildings, average cost: $248,600
- 2012: 23 buildings, average cost: $264,500
- 2011: 66 buildings, average cost: $209,100
- 2010: 44 buildings, average cost: $203,700
- 2009: 14 buildings, average cost: $238,500
- 2008: 31 buildings, average cost: $341,100
- 2007: 60 buildings, average cost: $264,900
- 2006: 129 buildings, average cost: $197,100
- 2005: 85 buildings, average cost: $201,900
- 2004: 84 buildings, average cost: $208,300
- 2003: 67 buildings, average cost: $210,000
- 2002: 107 buildings, average cost: $202,400
- 2001: 91 buildings, average cost: $225,700
- 2000: 114 buildings, average cost: $190,100
- 1999: 81 buildings, average cost: $182,500
- 1998: 161 buildings, average cost: $163,700
- 1997: 55 buildings, average cost: $134,500
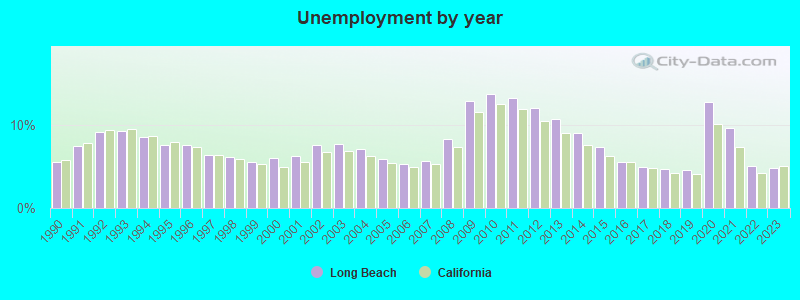
| Here: | 4.8% |
| California: | 5.1% |
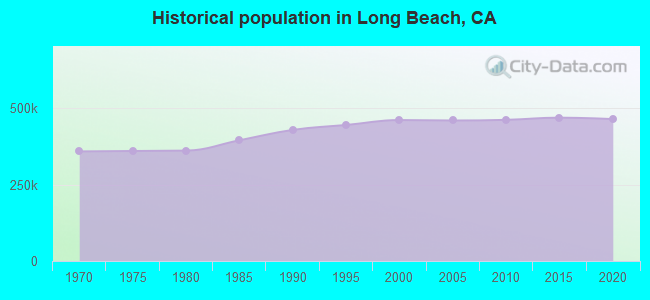
Population change in the 1990s: +31,064 (+7.2%).
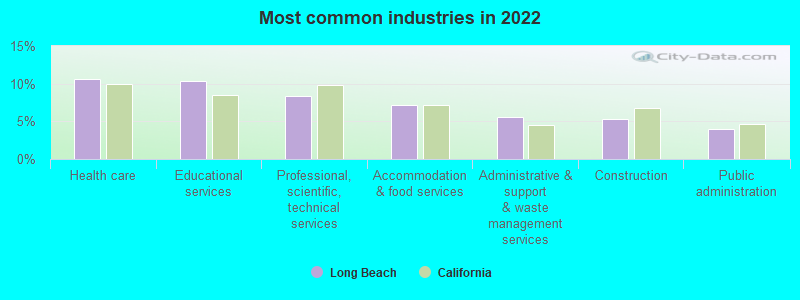
- Health care (10.6%)
- Educational services (10.3%)
- Professional, scientific, technical services (8.3%)
- Accommodation & food services (7.2%)
- Administrative & support & waste management services (5.5%)
- Construction (5.3%)
- Public administration (4.0%)
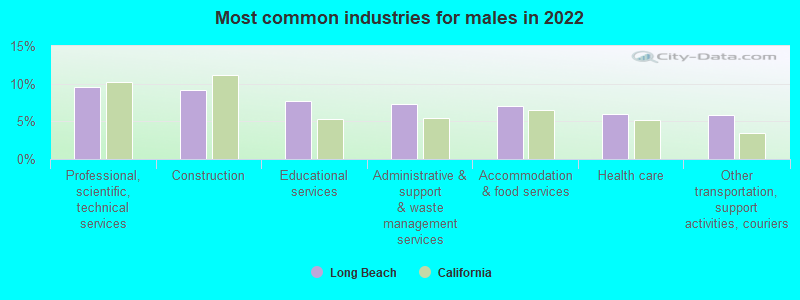
- Professional, scientific, technical services (9.6%)
- Construction (9.2%)
- Educational services (7.7%)
- Administrative & support & waste management services (7.3%)
- Accommodation & food services (7.0%)
- Health care (5.9%)
- Other transportation, support activities, couriers (5.8%)
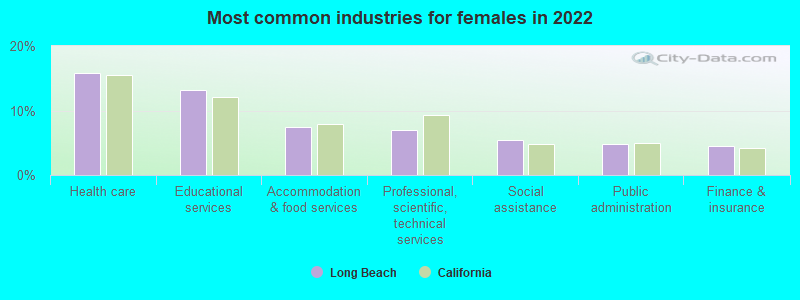
- Health care (15.8%)
- Educational services (13.2%)
- Accommodation & food services (7.4%)
- Professional, scientific, technical services (6.9%)
- Social assistance (5.5%)
- Public administration (4.8%)
- Finance & insurance (4.4%)
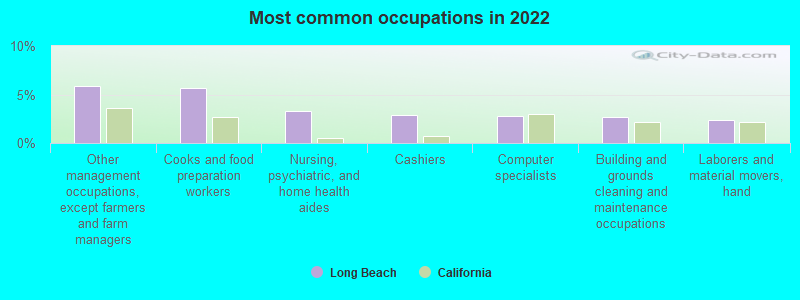
- Other management occupations, except farmers and farm managers (5.9%)
- Cooks and food preparation workers (5.7%)
- Nursing, psychiatric, and home health aides (3.3%)
- Cashiers (2.8%)
- Computer specialists (2.8%)
- Building and grounds cleaning and maintenance occupations (2.7%)
- Laborers and material movers, hand (2.4%)
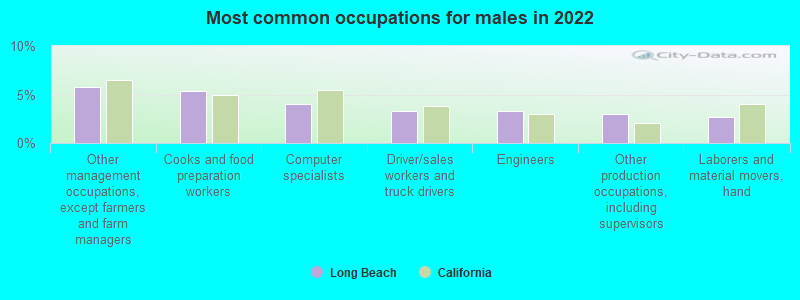
- Other management occupations, except farmers and farm managers (5.8%)
- Cooks and food preparation workers (5.4%)
- Computer specialists (4.0%)
- Driver/sales workers and truck drivers (3.3%)
- Engineers (3.3%)
- Other production occupations, including supervisors (3.0%)
- Laborers and material movers, hand (2.7%)
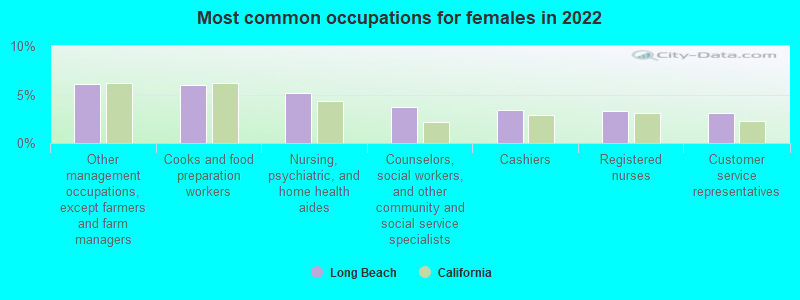
- Other management occupations, except farmers and farm managers (6.0%)
- Cooks and food preparation workers (5.9%)
- Nursing, psychiatric, and home health aides (5.2%)
- Counselors, social workers, and other community and social service specialists (3.7%)
- Cashiers (3.4%)
- Registered nurses (3.2%)
- Customer service representatives (3.1%)
Average climate in Long Beach, California
Based on data reported by over 4,000 weather stations


|
|

(lower is better)
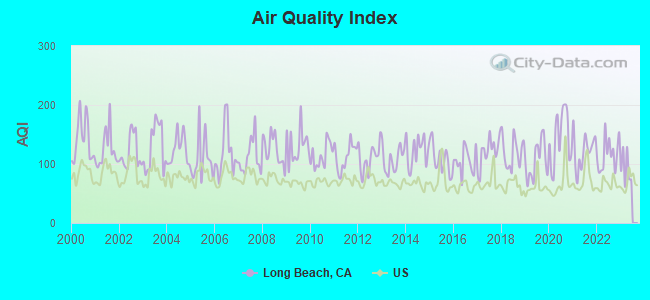
Air Quality Index (AQI) level in 2022 was 116. This is significantly worse than average.
| City: | 116 |
| U.S.: | 73 |
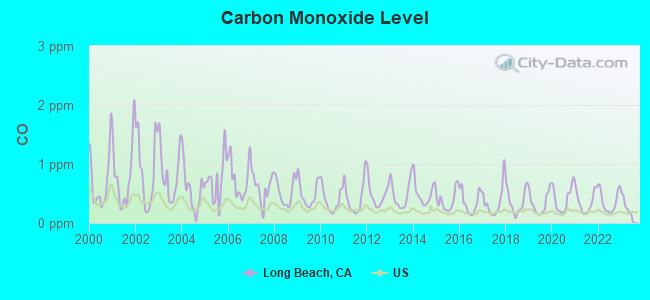
Carbon Monoxide (CO) [ppm] level in 2022 was 0.366. This is significantly worse than average. Closest monitor was 2.2 miles away from the city center.
| City: | 0.366 |
| U.S.: | 0.251 |

Nitrogen Dioxide (NO2) [ppb] level in 2022 was 12.9. This is significantly worse than average. Closest monitor was 1.0 miles away from the city center.
| City: | 12.9 |
| U.S.: | 5.1 |
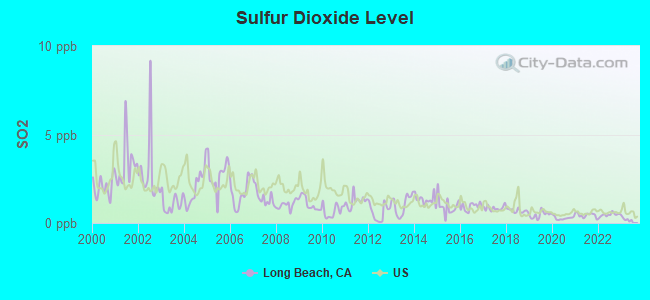
Sulfur Dioxide (SO2) [ppb] level in 2022 was 0.465. This is significantly better than average. Closest monitor was 1.0 miles away from the city center.
| City: | 0.465 |
| U.S.: | 1.515 |
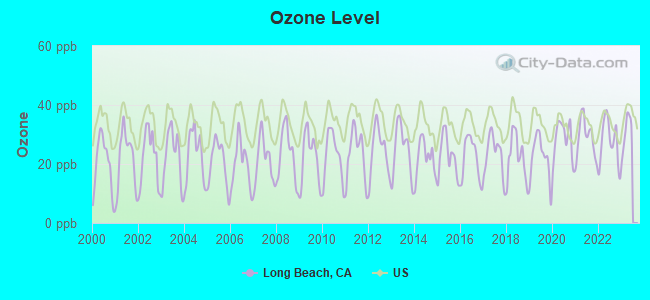
Ozone [ppb] level in 2022 was 27.4. This is better than average. Closest monitor was 1.0 miles away from the city center.
| City: | 27.4 |
| U.S.: | 33.3 |
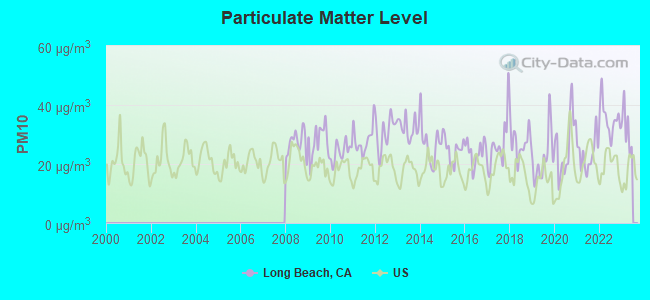
Particulate Matter (PM10) [µg/m3] level in 2022 was 35.4. This is significantly worse than average. Closest monitor was 1.0 miles away from the city center.
| City: | 35.4 |
| U.S.: | 19.2 |
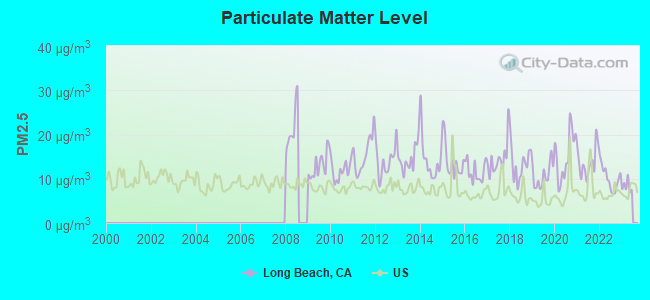
Particulate Matter (PM2.5) [µg/m3] level in 2022 was 10.2. This is worse than average. Closest monitor was 1.0 miles away from the city center.
| City: | 10.2 |
| U.S.: | 8.1 |
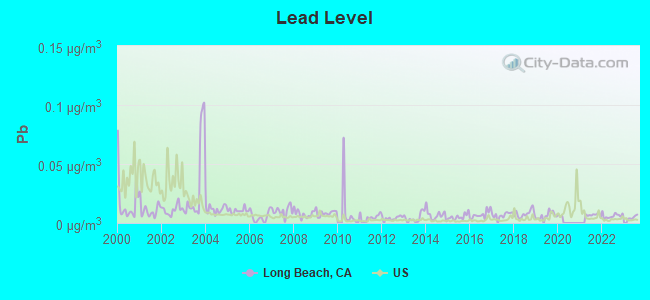
Lead (Pb) [µg/m3] level in 2022 was 0.00604. This is significantly better than average. Closest monitor was 1.3 miles away from the city center.
| City: | 0.00604 |
| U.S.: | 0.00931 |
Earthquake activity:
Long Beach-area historical earthquake activity is significantly above California state average. It is 6775% greater than the overall U.S. average.On 7/21/1952 at 11:52:14, a magnitude 7.7 (7.7 UK, Class: Major, Intensity: VIII - XII) earthquake occurred 95.7 miles away from Long Beach center, causing $50,000,000 total damage
On 6/28/1992 at 11:57:34, a magnitude 7.6 (6.2 MB, 7.6 MS, 7.3 MW, Depth: 0.7 mi) earthquake occurred 96.9 miles away from Long Beach center, causing 3 deaths (1 shaking deaths, 2 other deaths) and 400 injuries, causing $100,000,000 total damage and $40,000,000 insured losses
On 10/16/1999 at 09:46:44, a magnitude 7.4 (6.3 MB, 7.4 MS, 7.2 MW, 7.3 ML) earthquake occurred 110.2 miles away from the city center
On 11/4/1927 at 13:51:53, a magnitude 7.5 (7.5 UK) earthquake occurred 181.1 miles away from the city center
On 1/17/1994 at 12:30:55, a magnitude 6.8 (6.4 MB, 6.8 MS, 6.7 MW, Depth: 11.4 mi, Class: Strong, Intensity: VII - IX) earthquake occurred 34.1 miles away from the city center, causing 60 deaths (60 shaking deaths) and 7000 injuries
On 4/21/1918 at 22:32:30, a magnitude 6.8 (6.8 UK) earthquake occurred 41.3 miles away from Long Beach center
Magnitude types: body-wave magnitude (MB), local magnitude (ML), surface-wave magnitude (MS), moment magnitude (MW)
Natural disasters:
The number of natural disasters in Los Angeles County (57) is a lot greater than the US average (15).Major Disasters (Presidential) Declared: 27
Emergencies Declared: 3
Causes of natural disasters: Fires: 37, Floods: 16, Storms: 9, Winter Storms: 6, Landslides: 5, Mudslides: 5, Earthquakes: 3, Freeze: 1, Heavy Rain: 1, Hurricane: 1, Snow: 1, Tornado: 1, Wind: 1, Other: 1 (Note: some incidents may be assigned to more than one category).
Main business address for: DSI REALTY INCOME FUND IX (REAL ESTATE), FIRST CONSULTING GROUP INC (SERVICES-MANAGEMENT CONSULTING SERVICES), DUCOMMUN INC /DE/ (AIRCRAFT PART & AUXILIARY EQUIPMENT, NEC), HEALTH CARE PROPERTY INVESTORS INC (REAL ESTATE INVESTMENT TRUSTS), Real Mex Restaurants, Inc. (RETAIL-EATING & DRINKING PLACES), DSI REALTY INCOME FUND XI (REAL ESTATE), MOLINA HEALTHCARE INC (HOSPITAL & MEDICAL SERVICE PLANS), DSI REALTY INCOME FUND VI (REAL ESTATE) and 3 other public companies.
Hospitals in Long Beach:
- BEST CARE HOME II (6467 CALIFORNIA AVENUE)
- CHARTER HOSPITAL OF LONG BEACH (6060 PARAMOUNT BLVD)
- HOMEREACH HOSPICE (4647 LONG BEACH BLVD, SUITE C3)
- LONG BEACH DOCTORS HOSPITAL (1725 PACIFIC AVENUE)
- LONG BEACH MEMORIAL MEDICAL CENTER (Voluntary non-profit - Other, provides emergency services, 2801 ATLANTIC AVE)
- MEMORIAL HOSPICE PROGRAM (450 E SPRING ST)
- PACIFIC HOSPITAL OF LONG BEACH (Proprietary, 2776 PACIFIC AVE)
- ST MARY MEDICAL CENTER (Voluntary non-profit - Church, 1050 LINDEN AVE)
- TENDER LOVING CARE HOME HOSPICE (3300 EAST SOUTH STREET, SUITE 205)
- VNS OF LONG BEACH HOSPICE (3295 PACIFIC AVE)
- WELLS HOUSE (245 CHERRY AVENUE)
Airports and heliports located in Long Beach:
- Long Beach /Daugherty Field/ Airport (LGB) (Runways: 11, Commercial Ops: 24,032, Air Taxi Ops: 5,895, Local Ops: 112,158, Military Ops: 1,574)
- Heliports: 6
Colleges/Universities in Long Beach:
- California State University-Long Beach (Full-time enrollment: 28,287; Location: 1250 Bellflower Blvd; Public; Website: www.csulb.edu; Offers Doctor's degree)
- Long Beach City College (Full-time enrollment: 15,602; Location: 4901 E. Carson St.; Public; Website: www.lbcc.edu)
- Wyotech-Long Beach (Full-time enrollment: 2,453; Location: 2161 Technology Place; Private, for-profit; Website: www.wyotech.edu/campus/long_beach)
- John Wesley International Barber and Beauty College (Full-time enrollment: 124; Location: 717 Pine Ave; Private, for-profit; Website: johnwesleybarberandbeauty.com)
- American Career College-Long Beach (Full-time enrollment: 41; Location: 236 East 3rd Street; Private, for-profit; Website: americancareercollege.edu/)
- Newbridge College-Long Beach (Location: 3799 E. Burnett St.; Private, for-profit)
- California State University-Chancellors Office (Location: Analytic Studies 401 Golden Shore, 6th Floor; Public; Website: www.calstate.edu/; Offers Doctor's degree)
Other colleges/universities with over 2000 students near Long Beach:
- El Camino College-Compton Center (about 6 miles; Compton, CA; Full-time enrollment: 4,506)
- Cerritos College (about 7 miles; Norwalk, CA; FT enrollment: 13,090)
- Trident University International (about 8 miles; Cypress, CA; FT enrollment: 5,974)
- California State University-Dominguez Hills (about 8 miles; Carson, CA; FT enrollment: 9,862)
- Los Angeles Harbor College (about 8 miles; Wilmington, CA; FT enrollment: 5,285)
- Cypress College (about 8 miles; Cypress, CA; FT enrollment: 8,732)
- Golden West College (about 11 miles; Huntington Beach, CA; FT enrollment: 7,358)
Biggest public high schools in Long Beach:
- POLYTECHNIC HIGH (Students: 3,403, Location: 1600 ATLANTIC AVE., Grades: 9-12)
- WILSON HIGH (Students: 3,069, Location: 4400 E. TENTH ST., Grades: 9-12)
- JORDAN HIGH (Students: 2,789, Location: 6500 ATLANTIC AVE., Grades: 9-12)
- RENAISSANCE HIGH SCHOOL FOR THE ARTS (Students: 349, Location: 235 E. EIGHTH ST., Grades: 9-12)
- EDUCATIONAL PARTNERSHIP HIGH (Students: 201, Location: 1794 CEDAR AVE., Grades: 9-12)
- SELECT COMMUNITY DAY (SECONDARY) (Students: 2, Location: 2221 ARGONNE AVE., Grades: 7-12)
- LONG BEACH UNIFIED SCHOOL DISTRICT ROP (Location: 3701B E. WILLOW ST., Grades: 10-12)
- MILLIKAN HIGH (Location: 2800 SNOWDEN AVE., Grades: 9-12)
- REID HIGH (Location: 2153 W. HILL ST., Grades: 11-12)
- CABRILLO HIGH (Location: 2001 SANTA FE AVE., Grades: 9-12)
Private high schools in Long Beach:
- ST ANTHONY HIGH SCHOOL (Students: 437, Location: 620 OLIVE AVE, Grades: 9-12)
- PACIFIC BAPTIST SCHOOL (Students: 192, Location: 3332 MAGNOLIA AVE, Grades: PK-12)
- FIRST BAPTIST CHURCH SCHOOL (Students: 188, Location: 1000 PINE AVE, Grades: PK-12)
- GETHSEMANE BAPTIST CHRISTIAN SCHOOL (Students: 62, Location: 6095 ORANGE AVE, Grades: PK-12)
- PARKRIDGE PRIVATE SCHOOL (Students: 47, Location: 3605 LONG BEACH BLVD # 304, Grades: 3-12)
- REGENCY HIGH SCHOOL (Students: 42, Location: 490 W 14TH ST, Grades: 8-12)
- ZINSMEYER ACADEMY (Students: 33, Location: 4223 E ANAHEIM ST, Grades: 5-12)
- ZINSMEYER ACADEMY (Students: 23, Location: 4223 E ANAHEIM STREE, Grades: 6-12)
Biggest public elementary/middle schools in Long Beach:
- HUGHES MIDDLE (Students: 1,511, Location: 3846 CALIFORNIA AVE., Grades: 6-8)
- STANFORD MIDDLE (Students: 1,283, Location: 5871 E. LOS ARCOS ST., Grades: 6-8)
- BANCROFT MIDDLE (Students: 1,180, Location: 5301 E. CENTRALIA ST., Grades: 6-8)
- HAMILTON MIDDLE (Students: 1,029, Location: 1060 E. 70TH ST., Grades: 6-8)
- STEPHENS MIDDLE (Students: 998, Location: 1830 W. COLUMBIA ST., Grades: 6-8)
- FRANKLIN CLASSICAL MIDDLE (Students: 864, Location: 540 CERRITOS AVE., Grades: 6-8)
- WASHINGTON MIDDLE (Students: 859, Location: 1450 CEDAR AVE., Grades: 6-8)
- POWELL ACADEMY FOR SUCCESS (Students: 855, Location: 150 VICTORIA ST., Grades: KG-8)
- ROGERS MIDDLE (Students: 852, Location: 365 MONROVIA AVE., Grades: 6-8)
- HUDSON K-8 (Students: 852, Location: 2335 WEBSTER AVE., Grades: KG-8)
Biggest private elementary/middle schools in Long Beach:
- LAKEWOOD CHRISTIAN SCHOOLS (Students: 404, Location: 5336 E ARBOR RD, Grades: PK-8)
- BETHANY SCHOOL (Students: 354, Location: 2244 CLARK AVE, Grades: PK-8)
- ST CORNELIUS ELEMENTARY (Students: 305, Location: 3330 N BELLFLOWER BLVD, Grades: KG-8)
- ST JOSEPH ELEMENTARY SCHOOL (Students: 290, Location: 6200 E WILLOW ST, Grades: KG-8)
- ST BARNABAS PARISH SCHOOL (Students: 258, Location: 3980 MARRON AVE, Grades: PK-8)
- LOS ALTOS GRACE BRETHREN SCHOOL (Students: 232, Location: 6565 E STEARNS ST, Grades: PK-7)
- ST CYPRIAN ELEMENTARY SCHOOL (Students: 204, Location: 5133 E ARBOR RD, Grades: KG-8)
- ST ANTHONY PARISH SCHOOL (Students: 200, Location: 855 E 5TH ST, Grades: PK-8)
- ST LUCY SCHOOL (Students: 198, Location: 2320 COTA AVE, Grades: PK-8)
- ST ATHANASIUS ELEMENTARY SCHOOL (Students: 185, Location: 5369 LINDEN AVE, Grades: KG-8)
Library in Long Beach:
User-submitted facts and corrections:
- AMERICAN INSTITUTE OF HEALTH SCIENCES (FT enrollment: 90; Location: 3501 Atlantic Ave.; Private, for-profit; Website: http://www.aihs.edu)
- Clerk, Maitenance Assistant,Office Systems Analyst,Homeless Service Coordinator added by Zeke
- Website for Cal State University of Long Beach is not www.acs.csulb.edu it is www.csulb.edu. added by Skitt
Points of interest:
Notable locations in Long Beach: Long Beach Water Reclamation Plant (A), Los Alamitos Circle (B), Queen Mary (C), Queensway Landing (D), Virginia Country Club (E), Bixby Ranch (F), Skyline Golf Course (G), Lighthipe Substation (H), Terminal Island Marina (I), Recreation Park Golf Course (J), Shoreline Village (K), Pier T (L), Pier S (M), Pier H (N), Pier G (O), Pier F (P), Pier E (Q), Pier D (R), Pier C (S), Pier B (T). Display/hide their locations on the map
Shopping Centers: Bixby Knolls Shopping Center (1), The Market Place Shopping Center (2). Display/hide their locations on the map
Main business address in Long Beach include: DSI REALTY INCOME FUND IX (A), DUCOMMUN INC /DE/ (B), HEALTH CARE PROPERTY INVESTORS INC (C), Real Mex Restaurants, Inc. (D), DSI REALTY INCOME FUND XI (E), MOLINA HEALTHCARE INC (F), DSI REALTY INCOME FUND VI (G). Display/hide their locations on the map
Churches in Long Beach include: Bible Presbyterian Church (A), Blessed Hope Assembly of God Church (B), California Heights Baptist Church (C), California Heights United Methodist Church (D), Church of Christ (E), Church of Jesus Christ of Latter Day Saints (F), Community Presbyterian Church (G), Faith Tabernacle (H), Filipino-American Christian Fellowship Church (I). Display/hide their locations on the map
Cemeteries: Long Beach Cemetery (1), Table Top (2), Forest Lawn Memorial Cemetery - Long Beach (3), All Souls Cemetery (4). Display/hide their locations on the map
Lake: Colorado Lagoon (A). Display/hide its location on the map
Rivers and creeks: Coyote Creek (A), Compton Creek (B), Los Angeles River (C). Display/hide their locations on the map
Parks in Long Beach include: Joe Rodgers Field (1), Bruin Stadium (2), David Burcham Field (3), Admiral Kidd Park (4), Bixby Park (5), Bluff Park (6), Camp Suanga (7), Carroll Parks (8), Cherry Avenue Park (9). Display/hide their locations on the map
Beach: Alamitos Bay Beach (A). Display/hide its location on the map
Tourist attractions: Dr Job's Mission To the Persecuted Church (Historical Places & Services; 5555 East Stearns Street) (1), Domiguez Rancho Adobe Museum (Cultural Attractions- Events- & Facilities; 18127 South Alameda) (2), Comet Hale-Bopp Dramatic Photo Gallery (Nature Centers; 5733 Lanai Street) (3), Aquarium of the Pacific (Amusement & Theme Parks; 100 Aquarium Way) (4), Adventure Tour Lines (Tours & Charters; 1471 Long Beach Boulevard) (5). Display/hide their approximate locations on the map
Hotels: Alpine Motel (4870 Long Beach Boulevard) (1), Bel Shore Motel (4312 E 2nd St) (2), Atlantic Blvd Motel (6141 Atlantic Avenue) (3), Aloha Motel (2860 Long Beach Boulevard) (4), American Inn of Long Beach Blvd (4860 Long Beach Boulevard) (5), Beachrunners' Inn (231 Kennebec Ave) (6), All 8 Motel (2400 East Pacific Coast Highway) (7), Agua Venture Inn (848 East Pacific Coast Hwy) (8), Best Western Golden Sails Htl (6285 East Pacific Coast Highway) (9). Display/hide their approximate locations on the map
Court: Federal Bureau Of Investigation - Long Beach (1 World Trade Centre) (1). Display/hide its approximate location on the map
Birthplace of: Jesse James (customizer) - Television personality, Richard Cromwell (actor) - Film actor, Jonathon Blum - Ice hockey player, Scout Taylor-Compton - Child actor, James Robert Baker - Author, Ken Block - World Renowned Rally Driver, Russell Westbrook - Basketball player, Mark Sanchez - Professional football player, Jessica Hardy - Swimmer., Eric Carter - Bicycle motocross rider.
Drinking water stations with addresses in Long Beach and their reported violations in the past:
BEAR VALLEY MHP (Population served: 150, Groundwater):Past health violations:Past monitoring violations:
- MCL, Monthly (TCR) - In JUN-2009, Contaminant: Coliform. Follow-up actions: St Compliance achieved (JUL-10-2009), St Violation/Reminder Notice (AUG-18-2009)
- Initial Tap Sampling for Pb and Cu - In JUL-01-1993, Contaminant: Lead and Copper Rule. Follow-up actions: Fed Compliance achieved (SEP-30-2005)
- One minor monitoring violation
Drinking water stations with addresses in Long Beach that have no violations reported:
- LONE WOLF COLONY (Population served: 300, Primary Water Source Type: Groundwater)
- SKYLAND RANCH CAMP (Population served: 40, Primary Water Source Type: Groundwater)
| This city: | 2.8 people |
| California: | 2.9 people |
| This city: | 60.7% |
| Whole state: | 68.7% |
| This city: | 9.4% |
| Whole state: | 7.2% |
Likely homosexual households (counted as self-reported same-sex unmarried-partner households)
- Lesbian couples: 0.9% of all households
- Gay men: 1.1% of all households
People in group quarters in Long Beach in 2010:
- 2,370 people in nursing facilities/skilled-nursing facilities
- 2,029 people in college/university student housing
- 1,363 people in other noninstitutional facilities
- 771 people in group homes intended for adults
- 487 people in emergency and transitional shelters (with sleeping facilities) for people experiencing homelessness
- 413 people in residential treatment centers for adults
- 219 people in mental (psychiatric) hospitals and psychiatric units in other hospitals
- 217 people in workers' group living quarters and job corps centers
- 146 people in local jails and other municipal confinement facilities
- 111 people in hospitals with patients who have no usual home elsewhere
- 41 people in maritime/merchant vessels
- 34 people in in-patient hospice facilities
- 27 people in residential treatment centers for juveniles (non-correctional)
- 21 people in correctional residential facilities
- 21 people in group homes for juveniles (non-correctional)
- 7 people in correctional facilities intended for juveniles
People in group quarters in Long Beach in 2000:
- 2,371 people in nursing homes
- 2,281 people in college dormitories (includes college quarters off campus)
- 2,049 people in other noninstitutional group quarters
- 1,650 people in homes or halfway houses for drug/alcohol abuse
- 356 people in hospitals/wards and hospices for chronically ill
- 342 people in homes for the mentally ill
- 205 people in mental (psychiatric) hospitals or wards
- 203 people in local jails and other confinement facilities (including police lockups)
- 173 people in job corps and vocational training facilities
- 168 people in military hospitals or wards for chronically ill
- 152 people in other hospitals or wards for chronically ill
- 92 people in homes for the mentally retarded
- 84 people in other nonhousehold living situations
- 79 people in hospitals or wards for drug/alcohol abuse
- 73 people in religious group quarters
- 49 people in other group homes
- 46 people in schools, hospitals, or wards for the intellectually disabled
- 36 people in hospices or homes for chronically ill
- 35 people in unknown juvenile institutions
- 30 people in wards in military hospitals for patients who have no usual home elsewhere
- 28 people in state prisons
- 13 people in institutions for the deaf
- 6 people in wards in general hospitals for patients who have no usual home elsewhere
- 6 people in homes for abused, dependent, and neglected children
- 5 people in military barracks, etc.
- 3 people in homes for the physically handicapped
Banks with most branches in Long Beach (2011 data):
- Wells Fargo Bank, National Association: 10 branches. Info updated 2011/04/05: Bank assets: $1,161,490.0 mil, Deposits: $905,653.0 mil, headquarters in Sioux Falls, SD, positive income, 6395 total offices, Holding Company: Wells Fargo & Company
- U.S. Bank National Association: 9 branches. Info updated 2012/01/30: Bank assets: $330,470.8 mil, Deposits: $236,091.5 mil, headquarters in Cincinnati, OH, positive income, 3121 total offices, Holding Company: U.S. Bancorp
- Bank of America, National Association: 9 branches. Info updated 2009/11/18: Bank assets: $1,451,969.3 mil, Deposits: $1,077,176.8 mil, headquarters in Charlotte, NC, positive income, 5782 total offices, Holding Company: Bank Of America Corporation
- JPMorgan Chase Bank, National Association: 9 branches. Info updated 2011/11/10: Bank assets: $1,811,678.0 mil, Deposits: $1,190,738.0 mil, headquarters in Columbus, OH, positive income, International Specialization, 5577 total offices, Holding Company: Jpmorgan Chase & Co.
- Farmers and Merchants Bank of Long Beach: 7 branches. Info updated 2006/11/03: Bank assets: $4,659.3 mil, Deposits: $3,393.5 mil, local headquarters, positive income, Commercial Lending Specialization, 22 total offices, Holding Company: Palomar Enterprises, Llc
- First Bank: Oceangate Branch, Bixby Knolls Branch, Pacific Coast Hwy Branch. Info updated 2007/12/04: Bank assets: $6,579.8 mil, Deposits: $5,800.6 mil, headquarters in Creve Coeur, MO, negative income in the last year, Commercial Lending Specialization, 148 total offices, Holding Company: First Banks, Inc.
- Union Bank, National Association: Long Beach Renaissance-Cash And Save, Naples Branch, Long Beach Branch. Info updated 2011/09/01: Bank assets: $88,967.5 mil, Deposits: $65,286.4 mil, headquarters in San Francisco, CA, positive income, Commercial Lending Specialization, 403 total offices, Holding Company: Mitsubishi Ufj Financial Group, Inc.
- Citibank, National Association: N. Bellflower Blvd. Branch, Long Beach Branch, North Long Beach Branch. Info updated 2012/01/10: Bank assets: $1,288,658.0 mil, Deposits: $882,541.0 mil, headquarters in Sioux Falls, SD, positive income, International Specialization, 1048 total offices, Holding Company: Citigroup Inc.
- Comerica Bank: Long Beach Branch, Marketplace Long Beach Banking Cente, East Long Beach Branch. Info updated 2011/07/29: Bank assets: $60,970.5 mil, Deposits: $48,300.9 mil, headquarters in Dallas, TX, positive income, Commercial Lending Specialization, 497 total offices, Holding Company: Comerica Incorporated
- 9 other banks with 11 local branches
For population 15 years and over in Long Beach:
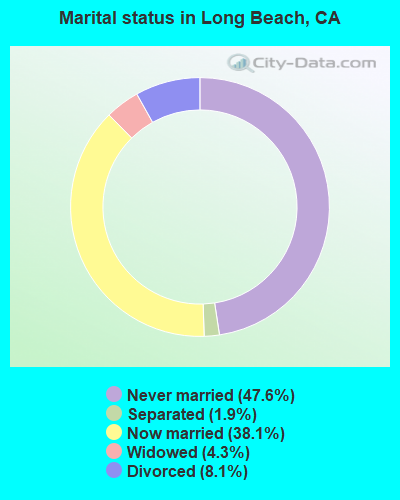
- Never married: 47.6%
- Now married: 38.1%
- Separated: 1.9%
- Widowed: 4.3%
- Divorced: 8.1%
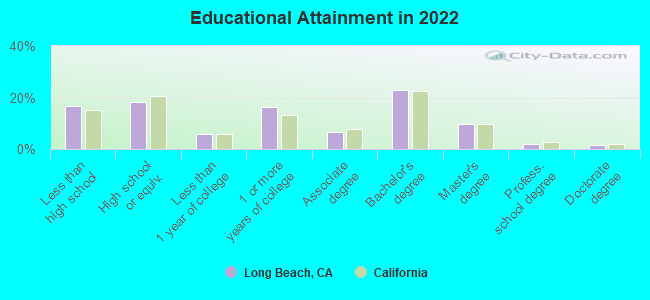
For population 25 years and over in Long Beach:
- High school or higher: 83.3%
- Bachelor's degree or higher: 36.2%
- Graduate or professional degree: 13.2%
- Unemployed: 4.6%
- Mean travel time to work (commute): 25.0 minutes
| Here: | 17.3 |
| California average: | 15.5 |


Graphs represent county-level data. Detailed 2008 Election Results
Neighborhoods in Long Beach:
(Long Beach, California Neighborhood Map)Religion statistics for Long Beach, CA (based on Los Angeles County data)


| Religion | Adherents | Congregations |
|---|---|---|
| Catholic | 3,542,994 | 275 |
| Evangelical Protestant | 814,611 | 3,249 |
| Other | 451,594 | 1,023 |
| Mainline Protestant | 229,056 | 860 |
| Black Protestant | 112,338 | 290 |
| Orthodox | 63,517 | 76 |
| None | 4,604,495 | - |
Food Environment Statistics:
| This county: | 2.12 / 10,000 pop. |
| California: | 2.14 / 10,000 pop. |
| This county: | 0.03 / 10,000 pop. |
| California: | 0.04 / 10,000 pop. |
| Los Angeles County: | 0.58 / 10,000 pop. |
| California: | 0.62 / 10,000 pop. |
| Here: | 1.23 / 10,000 pop. |
| California: | 1.49 / 10,000 pop. |
| Los Angeles County: | 7.15 / 10,000 pop. |
| California: | 7.42 / 10,000 pop. |
| Los Angeles County: | 7.5% |
| California: | 7.3% |
| Here: | 20.4% |
| State: | 21.3% |
| Here: | 18.6% |
| California: | 17.9% |
Health and Nutrition:
| This city: | 48.7% |
| State: | 49.4% |
| Long Beach: | 48.2% |
| California: | 48.0% |
| This city: | 28.0 |
| California: | 28.1 |
| Here: | 20.1% |
| California: | 20.2% |
| Long Beach: | 11.1% |
| California: | 11.2% |
| This city: | 6.7 |
| California: | 6.8 |
| Here: | 30.7% |
| California: | 31.5% |
| This city: | 56.6% |
| California: | 56.4% |
| Long Beach: | 81.8% |
| California: | 80.9% |
More about Health and Nutrition of Long Beach, CA Residents
| Local government employment and payroll (March 2022) | |||||
| Function | Full-time employees | Monthly full-time payroll | Average yearly full-time wage | Part-time employees | Monthly part-time payroll |
|---|---|---|---|---|---|
| Police Protection - Officers | 771 | $10,316,041 | $160,561 | 0 | $0 |
| Transit | 666 | $3,898,995 | $70,252 | 15 | $33,341 |
| Water Transport and Terminals | 509 | $4,896,034 | $115,427 | 12 | $18,013 |
| Other and Unallocable | 480 | $3,920,506 | $98,013 | 79 | $196,972 |
| Health | 398 | $2,554,872 | $77,031 | 171 | $461,754 |
| Firefighters | 374 | $6,279,976 | $201,497 | 0 | $0 |
| Other Government Administration | 304 | $2,512,577 | $99,181 | 62 | $154,442 |
| Financial Administration | 228 | $1,647,661 | $86,719 | 14 | $57,067 |
| Parks and Recreation | 203 | $1,224,400 | $72,378 | 316 | $494,957 |
| Police - Other | 201 | $1,357,105 | $81,021 | 39 | $164,189 |
| Water Supply | 193 | $1,733,179 | $107,762 | 20 | $65,399 |
| Gas Supply | 191 | $1,073,842 | $67,467 | 10 | $27,982 |
| Streets and Highways | 128 | $768,045 | $72,004 | 6 | $6,967 |
| Solid Waste Management | 113 | $701,785 | $74,526 | 9 | $31,217 |
| Fire - Other | 106 | $857,214 | $97,043 | 79 | $171,479 |
| Judicial and Legal | 100 | $935,259 | $112,231 | 11 | $50,247 |
| Airports | 90 | $686,918 | $91,589 | 2 | $7,099 |
| Local Libraries | 77 | $470,443 | $73,316 | 86 | $155,210 |
| Housing and Community Development (Local) | 56 | $474,486 | $101,676 | 9 | $18,941 |
| Sewerage | 30 | $269,127 | $107,651 | 1 | $2,042 |
| Totals for Government | 5,218 | $46,578,462 | $107,118 | 941 | $2,117,317 |
Long Beach government finances - Expenditure in 2021 (per resident):
- Construction - Health - Other: $21,828,000 ($48.37)
Regular Highways: $10,899,000 ($24.15)
Police Protection: $1,013,000 ($2.24)
- Current Operations - General - Other: $455,747,000 ($1009.84)
Police Protection: $276,684,000 ($613.07)
Regular Highways: $149,178,000 ($330.55)
Sea and Inland Port Facilities: $134,723,000 ($298.52)
Housing and Community Development: $130,132,000 ($288.34)
Transit Utilities: $106,230,000 ($235.38)
Health - Other: $105,867,000 ($234.58)
Local Fire Protection: $99,047,000 ($219.47)
Solid Waste Management: $76,573,000 ($169.67)
Water Utilities: $76,019,000 ($168.44)
Central Staff Services: $65,795,000 ($145.79)
Gas Utilities: $40,877,000 ($90.57)
Air Transportation: $30,371,000 ($67.30)
Parks and Recreation: $28,177,000 ($62.43)
Libraries: $20,860,000 ($46.22)
Sewerage: $11,806,000 ($26.16)
Judicial and Legal Services: $8,379,000 ($18.57)
Protective Inspection and Regulation - Other: $4,831,000 ($10.70)
- Gas Utilities - Interest on Debt: $28,689,000 ($63.57)
- General - Interest on Debt: $104,717,000 ($232.03)
- Transit Utilities - Interest on Debt: $366,000 ($0.81)
- Water Utilities - Interest on Debt: $1,394,000 ($3.09)
Long Beach government finances - Revenue in 2021 (per resident):
- Charges - Sea and Inland Port Facilities: $434,644,000 ($963.08)
Other: $339,286,000 ($751.79)
Solid Waste Management: $82,722,000 ($183.29)
Air Transportation: $33,054,000 ($73.24)
Sewerage: $18,283,000 ($40.51)
Parks and Recreation: $782,000 ($1.73)
- Federal Intergovernmental - Other: $255,027,000 ($565.09)
Transit Utilities: $31,442,000 ($69.67)
Air Transportation: $21,964,000 ($48.67)
Housing and Community Development: $20,150,000 ($44.65)
Water Utilities: $110,000 ($0.24)
- Local Intergovernmental - Transit Utilities: $62,521,000 ($138.53)
Other: $24,469,000 ($54.22)
- Miscellaneous - General Revenue - Other: $40,645,000 ($90.06)
Rents: $40,140,000 ($88.94)
Fines and Forfeits: $14,395,000 ($31.90)
Interest Earnings: $5,979,000 ($13.25)
Donations From Private Sources: $5,971,000 ($13.23)
Special Assessments: $2,049,000 ($4.54)
Sale of Property: $1,556,000 ($3.45)
Royalties: $758,000 ($1.68)
- Revenue - Water Utilities: $119,797,000 ($265.44)
Gas Utilities: $112,276,000 ($248.78)
Transit Utilities: $1,988,000 ($4.40)
- State Intergovernmental - Other: $122,474,000 ($271.38)
Transit Utilities: $20,762,000 ($46.00)
Highways: $19,686,000 ($43.62)
Public Welfare: $9,137,000 ($20.25)
General Local Government Support: $475,000 ($1.05)
- Tax - Property: $219,757,000 ($486.93)
General Sales and Gross Receipts: $109,542,000 ($242.72)
Other: $85,305,000 ($189.02)
Public Utilities Sales: $62,280,000 ($138.00)
Other License: $30,347,000 ($67.24)
Other Selective Sales: $20,324,000 ($45.03)
Occupation and Business License - Other: $12,756,000 ($28.26)
Documentary and Stock Transfer: $2,691,000 ($5.96)
Severance: $1,350,000 ($2.99)
Long Beach government finances - Debt in 2021 (per resident):
- Long Term Debt - Beginning Outstanding - Unspecified Public Purpose: $3,903,550,000 ($8649.43)
Outstanding Unspecified Public Purpose: $3,560,763,000 ($7889.89)
Retired Unspecified Public Purpose: $355,041,000 ($786.70)
Beginning Outstanding - Public Debt for Private Purpose: $20,284,000 ($44.95)
Outstanding Nonguaranteed - Industrial Revenue: $20,284,000 ($44.95)
Issue, Unspecified Public Purpose: $12,253,000 ($27.15)
Long Beach government finances - Cash and Securities in 2021 (per resident):
- Bond Funds - Cash and Securities: $186,607,000 ($413.48)
- Other Funds - Cash and Securities: $571,199,000 ($1265.66)
- Sinking Funds - Cash and Securities: $36,513,000 ($80.91)
2.98% of this county's 2021 resident taxpayers lived in other counties in 2020 ($81,235 average adjusted gross income)
| Here: | 2.98% |
| California average: | 5.19% |
0.01% of residents moved from foreign countries ($155 average AGI)
Los Angeles County: 0.01% California average: 0.03%
Top counties from which taxpayers relocated into this county between 2020 and 2021:
| from Orange County, CA | |
| from San Bernardino County, CA | |
| from Riverside County, CA |
4.68% of this county's 2020 resident taxpayers moved to other counties in 2021 ($97,324 average adjusted gross income)
| Here: | 4.68% |
| California average: | 6.14% |
0.01% of residents moved to foreign countries ($196 average AGI)
Los Angeles County: 0.01% California average: 0.02%
Top counties to which taxpayers relocated from this county between 2020 and 2021:
| to Orange County, CA | |
| to San Bernardino County, CA | |
| to Riverside County, CA |
| Businesses in Long Beach, CA | ||||
| Name | Count | Name | Count | |
|---|---|---|---|---|
| 24 Hour Fitness | 2 | Lane Bryant | 1 | |
| 7-Eleven | 21 | Lane Furniture | 2 | |
| 99 Cents Only Stores | 4 | Little Caesars Pizza | 4 | |
| AT&T | 2 | Lowe's | 2 | |
| Ace Hardware | 4 | Marriott | 5 | |
| Albertsons | 5 | Marshalls | 2 | |
| Arby's | 2 | MasterBrand Cabinets | 9 | |
| Audi | 1 | McDonald's | 13 | |
| AutoZone | 7 | Motel 6 | 2 | |
| Avenue | 1 | New Balance | 5 | |
| Baja Fresh Mexican Grill | 1 | Nike | 12 | |
| Bally Total Fitness | 2 | Nordstrom | 1 | |
| Banana Republic | 1 | Old Navy | 1 | |
| Barnes & Noble | 2 | Outback | 1 | |
| Baskin-Robbins | 7 | Outback Steakhouse | 1 | |
| Bath & Body Works | 1 | Pac Sun | 1 | |
| Ben & Jerry's | 1 | Panda Express | 6 | |
| Best Western | 3 | Payless | 5 | |
| Big O Tires | 1 | Penske | 3 | |
| Blockbuster | 4 | PetSmart | 1 | |
| Budget Car Rental | 1 | Pier 1 Imports | 2 | |
| Burger King | 4 | Pizza Hut | 8 | |
| CVS | 11 | Popeyes | 3 | |
| Carl\s Jr. | 10 | Quality | 1 | |
| Casual Male XL | 1 | Quiznos | 3 | |
| Chevrolet | 1 | RadioShack | 6 | |
| Chick-Fil-A | 1 | Rite Aid | 10 | |
| Chipotle | 1 | Rodeway Inn | 1 | |
| Church's Chicken | 4 | SAS Shoes | 2 | |
| Circle K | 2 | Safeway | 5 | |
| Cold Stone Creamery | 2 | Sam's Club | 1 | |
| Comfort Inn | 1 | Sears | 3 | |
| Curves | 5 | Sprint Nextel | 4 | |
| DHL | 3 | Staples | 3 | |
| Days Inn | 1 | Starbucks | 24 | |
| Decora Cabinetry | 3 | Subaru | 1 | |
| Dennys | 4 | Subway | 24 | |
| Discount Tire | 1 | Super 8 | 1 | |
| Domino's Pizza | 5 | T-Mobile | 18 | |
| El Pollo Loco | 7 | T.G.I. Driday's | 1 | |
| Extended Stay America | 1 | T.J.Maxx | 2 | |
| Famous Footwear | 1 | Taco Bell | 9 | |
| Fashion Bug | 1 | Target | 2 | |
| FedEx | 46 | Toyota | 2 | |
| Firestone Complete Auto Care | 3 | Toys"R"Us | 2 | |
| GNC | 7 | Trader Joe's | 3 | |
| GameStop | 6 | Travelodge | 1 | |
| H&R Block | 12 | True Value | 1 | |
| Hilton | 2 | U-Haul | 14 | |
| Holiday Inn | 2 | UPS | 47 | |
| HomeTown Buffet | 1 | Vans | 8 | |
| Hyatt | 1 | Verizon Wireless | 1 | |
| IHOP | 3 | Volkswagen | 1 | |
| Jamba Juice | 4 | Vons | 5 | |
| Johnny Rockets | 1 | Walgreens | 5 | |
| Jones New York | 13 | Walmart | 2 | |
| Justice | 1 | Wendy's | 1 | |
| KFC | 7 | Westin | 1 | |
| Kmart | 1 | Whole Foods Market | 1 | |
| Kroger | 10 | YMCA | 6 | |
| LA Fitness | 4 | |||
Strongest AM radio stations in Long Beach:
- KFI (640 AM; 50 kW; LOS ANGELES, CA; Owner: CAPSTAR TX LIMITED PARTNERSHIP)
- KNX (1070 AM; 50 kW; LOS ANGELES, CA; Owner: INFINITY BROADCASTING OPERATIONS, INC.)
- KLAC (570 AM; 50 kW; LOS ANGELES, CA; Owner: AMFM RADIO LICENSES, L.L.C.)
- KFWB (980 AM; 50 kW; LOS ANGELES, CA; Owner: INFINITY BROADCASTING OPERATIONS, INC.)
- KTNQ (1020 AM; 50 kW; LOS ANGELES, CA; Owner: KTNQ-AM LICENSE CORP.)
- KXTA (1150 AM; 50 kW; LOS ANGELES, CA; Owner: CITICASTERS LICENSES, L.P.)
- KLTX (1390 AM; 5 kW; LONG BEACH, CA; Owner: HI-FAVOR BROADCASTING, LLC)
- KMPC (1540 AM; 50 kW; LOS ANGELES, CA; Owner: ROSE CITY RADIO CORPORATION)
- KDIS (1110 AM; 50 kW; PASADENA, CA; Owner: ABC,INC.)
- KBLA (1580 AM; 50 kW; SANTA MONICA, CA)
- KSPN (710 AM; 50 kW; LOS ANGELES, CA; Owner: KABC-AM RADIO, INC.)
- KPLS (830 AM; 50 kW; ORANGE, CA; Owner: CRN LICENSES, LLC)
- KXMX (1190 AM; 25 kW; ANAHEIM, CA; Owner: NEW INSPIRATION BROADCASTING COMPANY)
Strongest FM radio stations in Long Beach:
- KLAX-FM (97.9 FM; EAST LOS ANGELES, CA; Owner: KLAX LICENSING, INC.)
- KKJZ (88.1 FM; LONG BEACH, CA; Owner: CALIF. STATE UNIV LONG BEACH FOUND.)
- KBUE (105.5 FM; LONG BEACH, CA; Owner: LBI RADIO LICENSE CORP.)
- KZLA-FM (93.9 FM; LOS ANGELES, CA; Owner: EMMIS RADIO LICENSE CORPORATION)
- KPWR (105.9 FM; LOS ANGELES, CA; Owner: EMMIS RADIO LICENSE CORPORATION)
- KLSX (97.1 FM; LOS ANGELES, CA; Owner: INFINITY BROADCASTING OPERATIONS, INC.)
- KUSC (91.5 FM; LOS ANGELES, CA; Owner: UNIVERSITY OF SOUTHERN CALIFORNIA)
- KKBT (100.3 FM; LOS ANGELES, CA; Owner: RADIO ONE LICENSES, LLC)
- KKLA-FM (99.5 FM; LOS ANGELES, CA; Owner: NEW INSPIRATION BROADCASTING CO., INC.)
- KCBS-FM (93.1 FM; LOS ANGELES, CA; Owner: INFINITY BROADCASTING OPERATIONS, INC.)
- KRTH-FM (101.1 FM; LOS ANGELES, CA; Owner: INFINITY BROADCASTING OPERATIONS, INC.)
- KSCA (101.9 FM; GLENDALE, CA; Owner: HBC LICENSE CORPORATION)
- KLOS (95.5 FM; LOS ANGELES, CA; Owner: KLOS-FM RADIO, INC.)
- K212FA (90.3 FM; TEMPLE CITY, CA; Owner: EDUCATIONAL MEDIA FOUNDATION)
- KOST (103.5 FM; LOS ANGELES, CA; Owner: CAPSTAR TX LIMITED PARTNERSHIP)
- KLVE (107.5 FM; LOS ANGELES, CA; Owner: KLVE-FM LICENSE CORP.)
- KIIS-FM (102.7 FM; LOS ANGELES, CA; Owner: CITICASTERS LICENSES, L.P.)
- KPCC (89.3 FM; PASADENA, CA; Owner: PASADENA AREA COMMUNITY COLLEGE DISTRICT)
- KHHT (92.3 FM; LOS ANGELES, CA; Owner: AMFM RADIO LICENSES, L.L.C.)
- KBIG-FM (104.3 FM; LOS ANGELES, CA; Owner: AMFM RADIO LICENSES, L.L.C.)
TV broadcast stations around Long Beach:
- KTRO-LP (Channel 50; LANCASTER, CA; Owner: ROBERT D. ADELMAN)
- KCBS-TV (Channel 2; LOS ANGELES, CA; Owner: CBS BROADCASTING INC.)
- KTLA-TV (Channel 5; LOS ANGELES, CA; Owner: KTLA INC.)
- KABC-TV (Channel 7; LOS ANGELES, CA; Owner: ABC HOLDING COMPANY, INC.)
- KNBC (Channel 4; LOS ANGELES, CA; Owner: NBC SUBSIDIARY (KNBC-TV), INC.)
- National Bridge Inventory (NBI) Statistics
- 341Number of bridges
- 6,841ft / 2,085mTotal length
- $47,963,000Total costs
- 21,650,589Total average daily traffic
- 1,770,721Total average daily truck traffic
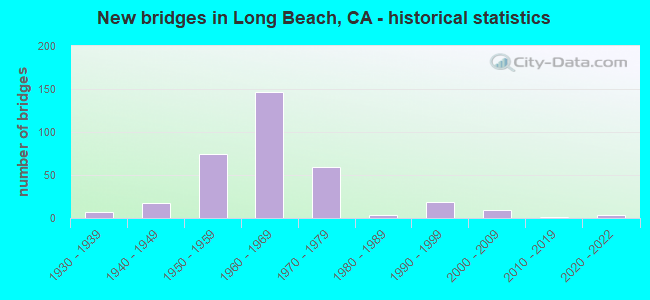
- New bridges - historical statistics
- 71930-1939
- 171940-1949
- 751950-1959
- 1461960-1969
- 591970-1979
- 41980-1989
- 191990-1999
- 92000-2009
- 12010-2019
- 42020-2022
FCC Registered Private Land Mobile Towers: 12 (See the full list of FCC Registered Private Land Mobile Towers in Long Beach, CA)
FCC Registered Broadcast Land Mobile Towers: 253 (See the full list of FCC Registered Broadcast Land Mobile Towers)
FCC Registered Microwave Towers: 394 (See the full list of FCC Registered Microwave Towers in this town)
FCC Registered Paging Towers: 18 (See the full list of FCC Registered Paging Towers)
FCC Registered Maritime Coast & Aviation Ground Towers: 104 (See the full list of FCC Registered Maritime Coast & Aviation Ground Towers)
FCC Registered Amateur Radio Licenses: 2,595 (See the full list of FCC Registered Amateur Radio Licenses in Long Beach)
FAA Registered Aircraft Manufacturers and Dealers: 29 (See the full list of FAA Registered Manufacturers and Dealers in Long Beach)
FAA Registered Aircraft: 311 (See the full list of FAA Registered Aircraft)
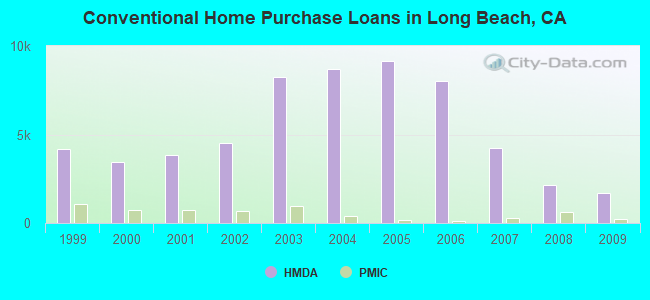
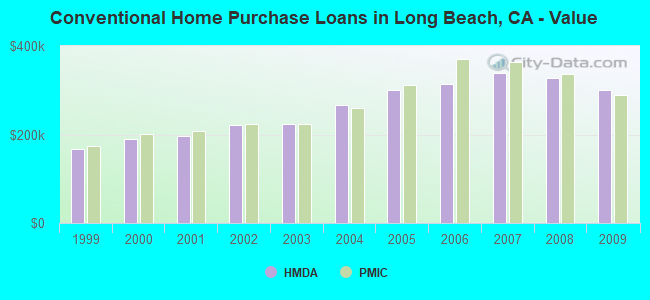
| Home Mortgage Disclosure Act Aggregated Statistics For Year 2009 (Based on 101 full and 4 partial tracts) | ||||||||||||||
| A) FHA, FSA/RHS & VA Home Purchase Loans | B) Conventional Home Purchase Loans | C) Refinancings | D) Home Improvement Loans | E) Loans on Dwellings For 5+ Families | F) Non-occupant Loans on < 5 Family Dwellings (A B C & D) | G) Loans On Manufactured Home Dwelling (A B C & D) | ||||||||
|---|---|---|---|---|---|---|---|---|---|---|---|---|---|---|
| Number | Average Value | Number | Average Value | Number | Average Value | Number | Average Value | Number | Average Value | Number | Average Value | Number | Average Value | |
| LOANS ORIGINATED | 1,411 | $295,026 | 1,720 | $301,440 | 6,338 | $311,988 | 336 | $243,464 | 86 | $1,506,312 | 755 | $270,221 | 8 | $183,875 |
| APPLICATIONS APPROVED, NOT ACCEPTED | 134 | $270,008 | 245 | $289,958 | 721 | $324,348 | 52 | $146,881 | 8 | $2,455,244 | 115 | $275,956 | 21 | $136,009 |
| APPLICATIONS DENIED | 358 | $291,107 | 475 | $287,865 | 2,371 | $334,629 | 163 | $123,480 | 33 | $890,173 | 364 | $271,119 | 29 | $107,997 |
| APPLICATIONS WITHDRAWN | 256 | $278,439 | 379 | $281,514 | 1,375 | $322,171 | 76 | $191,365 | 8 | $1,051,279 | 179 | $268,671 | 47 | $181,809 |
| FILES CLOSED FOR INCOMPLETENESS | 80 | $289,202 | 71 | $263,708 | 442 | $326,612 | 40 | $239,234 | 6 | $675,667 | 47 | $280,630 | 0 | $0 |
Detailed mortgage data for all 109 tracts in Long Beach, CA
| Private Mortgage Insurance Companies Aggregated Statistics For Year 2009 (Based on 90 full and 3 partial tracts) | ||||||
| A) Conventional Home Purchase Loans | B) Refinancings | C) Non-occupant Loans on < 5 Family Dwellings (A & B) | ||||
|---|---|---|---|---|---|---|
| Number | Average Value | Number | Average Value | Number | Average Value | |
| LOANS ORIGINATED | 209 | $289,511 | 46 | $367,495 | 1 | $276,000 |
| APPLICATIONS APPROVED, NOT ACCEPTED | 96 | $307,510 | 40 | $395,794 | 3 | $261,333 |
| APPLICATIONS DENIED | 38 | $301,440 | 19 | $407,626 | 0 | $0 |
| APPLICATIONS WITHDRAWN | 22 | $286,545 | 2 | $263,150 | 0 | $0 |
| FILES CLOSED FOR INCOMPLETENESS | 12 | $298,522 | 3 | $283,667 | 1 | $391,000 |
2005 - 2018 National Fire Incident Reporting System (NFIRS) incidents
- Fire incident types reported to NFIRS in Long Beach, CA
- 4,21937.5%Outside Fires
- 3,80833.9%Structure Fires
- 1,91117.0%Mobile Property/Vehicle Fires
- 1,30911.6%Other
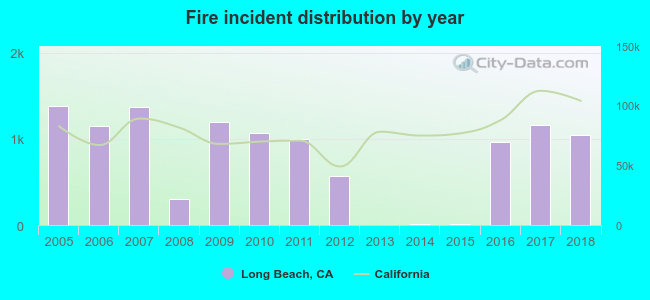 According to the data from the years 2005 - 2018 the average number of fires per year is 803. The highest number of reported fires - 1,385 took place in 2005, and the least - 3 in 2013. The data has a dropping trend.
 When looking into fire subcategories, the most reports belonged to: Outside Fires (37.5%), and Structure Fires (33.9%).
Fire-safe hotels and motels in Long Beach, California:
- Sandpiper Inn, 3624 E Pacific Coast Hwy, Long Beach, California 90804 , Phone: (562) 498-7544
- Best Western Golden Sails Hotel, 6285 E Pacific Coast Hwy, Long Beach, California 90803 , Phone: (562) 596-1631, Fax: (562) 594-0623
- Westin Long Beach Hotel, 333 E Ocean Blvd, Long Beach, California 90802 , Phone: (562) 436-3000, Fax: (562) 499-2068
- Renaissance Long Beach Hotel, 111 E Ocean Blvd, Long Beach, California 90802 , Phone: (562) 437-5900, Fax: (562) 499-2509
- Comfort Inn Long Beach, 3201 E Pacific Coast Hwy, Long Beach, California 90804 , Phone: (310) 597-3374, Fax: (562) 985-3142
- Holiday Inn Downtown Long Beach, 1133 Atlantic Ave, Long Beach, California 90813 , Phone: (562) 590-8858, Fax: (562) 983-1607
- Beach Inn Motel, 823 E 3RD St, Long Beach, California 90802 , Phone: (562) 437-3464, Fax: (562) 436-4541
- Hotel CURRENT, 5325 E Pacific Coast Hwy, Long Beach, California 90804 , Phone: (800) 990-9991
- 21 other hotels and motels
| Most common first names in Long Beach, CA among deceased individuals | ||
| Name | Count | Lived (average) |
|---|---|---|
| John | 2,889 | 73.9 years |
| William | 2,551 | 74.3 years |
| Mary | 2,400 | 79.7 years |
| Robert | 2,015 | 70.3 years |
| James | 2,004 | 71.0 years |
| Charles | 1,623 | 74.3 years |
| George | 1,561 | 75.3 years |
| Helen | 1,264 | 80.1 years |
| Margaret | 1,152 | 79.9 years |
| Joseph | 1,085 | 74.3 years |
| Most common last names in Long Beach, CA among deceased individuals | ||
| Last name | Count | Lived (average) |
|---|---|---|
| Smith | 1,093 | 76.3 years |
| Johnson | 866 | 74.6 years |
| Brown | 683 | 74.9 years |
| Williams | 654 | 74.1 years |
| Jones | 628 | 74.7 years |
| Miller | 575 | 77.0 years |
| Anderson | 521 | 76.7 years |
| Davis | 444 | 74.0 years |
| Moore | 392 | 74.8 years |
| Wilson | 366 | 75.5 years |
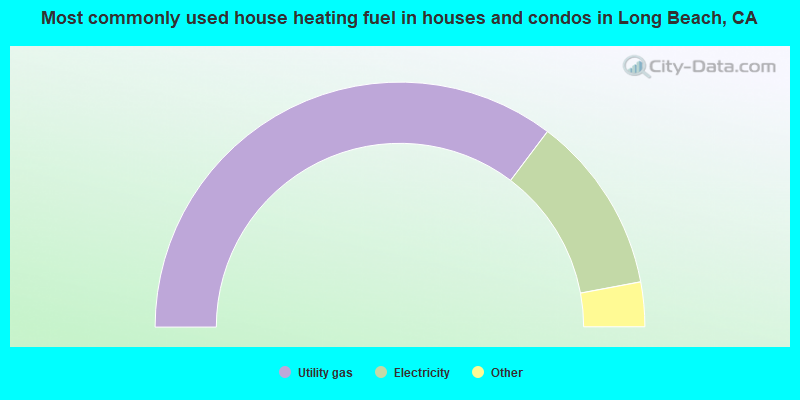
- 70.6%Utility gas
- 23.5%Electricity
- 3.8%No fuel used
- 1.1%Bottled, tank, or LP gas
- 0.7%Solar energy
- 0.2%Wood
- 0.2%Other fuel
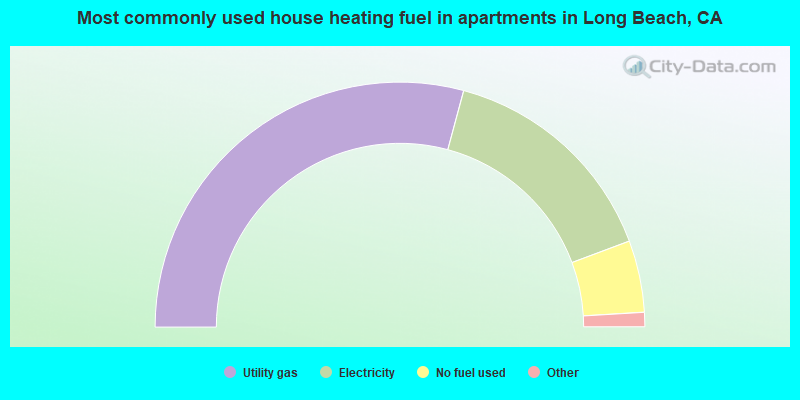
- 58.4%Utility gas
- 30.2%Electricity
- 9.5%No fuel used
- 1.5%Bottled, tank, or LP gas
- 0.1%Fuel oil, kerosene, etc.
Long Beach compared to California state average:
- Unemployed percentage significantly below state average.
- Black race population percentage above state average.
- House age above state average.
Long Beach, CA compared to other similar cities:
Long Beach on our top lists:
- #8 on the list of "Top 101 cities with the largest percentage of likely lesbian couples (counted as self-reported female-female unmarried-partner households) (population 50,000+)"
- #9 on the list of "Top 101 cities with the largest percentage of likely homosexual households (counted as self-reported same-sex unmarried-partner households) (population 50,000+)"
- #10 on the list of "Top 101 cities with the largest percentage of likely gay men couples (counted as self-reported male-male unmarried-partner households) (population 50,000+)"
- #20 on the list of "Top 101 cities with the largest percentage of people in military hospitals or wards for chronically ill (population 1,000+)"
- #22 on the list of "Top 101 cities with the most residents born in Cambodia (population 500+)"
- #23 on the list of "Top 101 cities with the largest percentage of people in wards in military hospitals for patients who have no usual home elsewhere (population 1,000+)"
- #23 on the list of "Top 100 cities with smallest houses (pop. 50,000+)"
- #41 on the list of "Top 101 cities with the largest percentage of people in institutions for the deaf (population 1,000+)"
- #43 on the list of "Top 100 most racially diverse cities (pop. 50,000+)"
- #44 on the list of "Top 100 biggest cities"
- #45 on the list of "Top 101 biggest cities in 2013"
- #53 on the list of "Top 101 cities with the largest percentage of unmarried partner households (population 50,000+)"
- #60 on the list of "Top 100 cities with highest ratio of median house value to median household income (pop. 50,000+)"
- #63 on the list of "Top 101 cities with fewest building permits per 10,000 residents (population 50,000+)"
- #69 on the list of "Top 100 cities with highest percentage of renters (pop. 50,000+)"
- #79 on the list of "Top 101 cities with largest percentage of males in industries: management of companies and enterprises (population 50,000+)"
- #89 on the list of "Top 101 larger cities with the highest increase in household income from 2000 (population 50,000+)"
- #90 on the list of "Top 101 cities with largest percentage of females in occupations: material moving occupations (population 50,000+)"
- #90 on the list of "Top 101 cities with the most local government spending on current operations of parks and recreation per resident (population 10,000+)"
- #98 on the list of "Top 101 cities with largest percentage of females in industries: utilities (population 50,000+)"
- #41 (90822) on the list of "Top 101 zip codes with the largest percentage of Greek first ancestries"
- #53 (90822) on the list of "Top 101 zip codes with the largest percentage of Russian first ancestries"
- #54 (90806) on the list of "Top 101 zip codes with the most offices of physicians in 2005"
- #1 on the list of "Top 101 counties with the most Evangelical Protestant congregations"
- #1 on the list of "Top 101 counties with the most Mainline Protestant congregations"
- #1 on the list of "Top 101 counties with the most Orthodox adherents"
- #1 on the list of "Top 101 counties with the highest ground withdrawal of fresh water for public supply (pop. 50,000+)"
- #1 on the list of "Top 101 counties with the most Catholic adherents (pop. 50,000+)"

|
|
Total of 2131 patent applications in 2008-2024.