Crime rate in Long Beach, California (CA): murders, rapes, robberies, assaults, burglaries, thefts, auto thefts, arson, law enforcement employees, police officers, crime map
Crime rate in Long Beach, CA
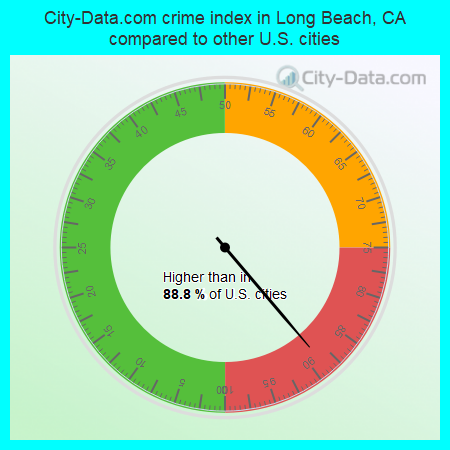
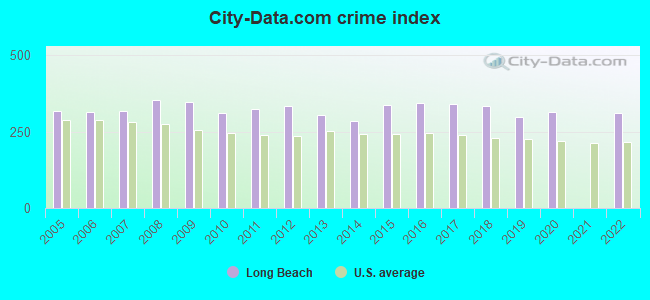
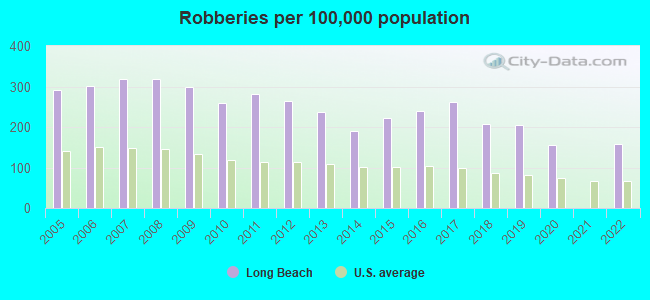
The 2022 crime rate in Long Beach, CA is 312 (City-Data.com crime index), which is 1.3 times higher than the U.S. average. It was higher than in 88.8% U.S. cities. The 2022 Long Beach crime rate rose by 177070% compared to 2021. In the last 5 years Long Beach has seen decreasing violent crime and rise of property crime.See how dangerous Long Beach, CA is compared to the nearest cities:
(Note: Higher means more crime)
(Note: Higher means more crime)
| Long Beach: | 312.2 |
| Signal Hill: | 521.3 |
| Lakewood: | 246.2 |
| Hawaiian Gardens: | 324.5 |
| Seal Beach: | 204.7 |
| Los Alamitos: | 258.8 |
| Bellflower: | 313.0 |
| Artesia: | 302.1 |
| Carson: | 290.0 |
The City-Data.com crime index weighs serious crimes and violent crimes more heavily. Higher means more crime, U.S. average is 246.1. It adjusts for the number of visitors and daily workers commuting into cities.
- means the value is smaller than the state average.- means the value is about the same as the state average.
- means the value is bigger than the state average.
- means the value is much bigger than the state average.
According to our research of California and other state lists, there were 807 registered sex offenders living in Long Beach, California as of April 26, 2024.
The ratio of all residents to sex offenders in Long Beach is 583 to 1.
Violent crime rate in 2022
| Long Beach: | 308.5 |
| U.S. Average: | 219.8 |
Violent crime rate in 2021
| Long Beach: | 0.2 |
| U.S. Average: | 224.8 |
Violent crime rate in 2020
| Long Beach: | 291.0 |
| U.S. Average: | 228.2 |
Violent crime rate in 2019
| Long Beach: | 290.6 |
| U.S. Average: | 219.9 |
Violent crime rate in 2018
| Long Beach: | 381.9 |
| U.S. Average: | 221.2 |
Violent crime rate in 2017
| Long Beach: | 357.4 |
| U.S. Average: | 226.2 |
Violent crime rate in 2016
| Long Beach: | 329.7 |
| U.S. Average: | 227.3 |
Violent crime rate in 2015
| Long Beach: | 320.3 |
| U.S. Average: | 219.3 |
Violent crime rate in 2014
| Long Beach: | 263.5 |
| U.S. Average: | 211.1 |
Violent crime rate in 2013
| Long Beach: | 271.6 |
| U.S. Average: | 214.2 |
Violent crime rate in 2012
| Long Beach: | 310.3 |
| U.S. Average: | 187.4 |
Violent crime rate in 2011
| Long Beach: | 325.4 |
| U.S. Average: | 187.1 |
Violent crime rate in 2010
| Long Beach: | 319.1 |
| U.S. Average: | 195.7 |
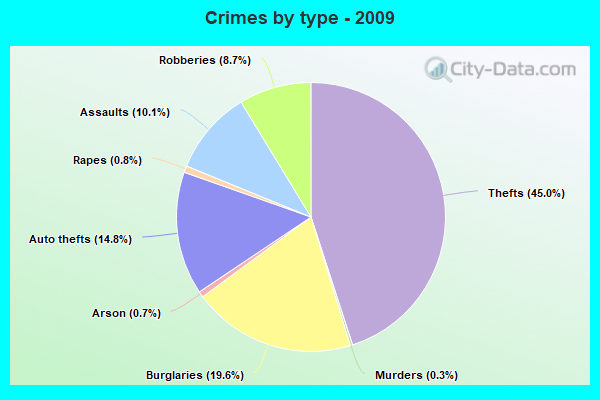
Violent crime rate in 2009
| Long Beach: | 367.7 |
| U.S. Average: | 208.9 |
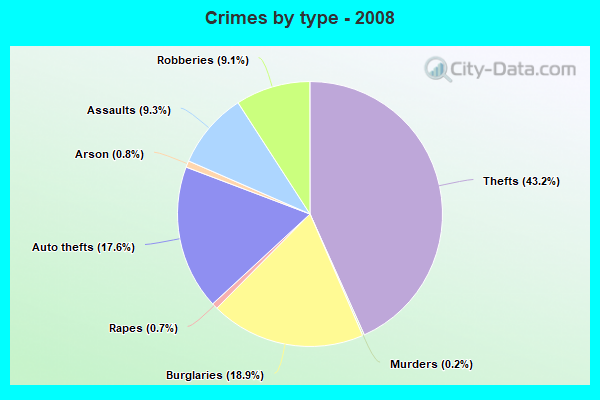
Violent crime rate in 2008
| Long Beach: | 363.8 |
| U.S. Average: | 222.5 |
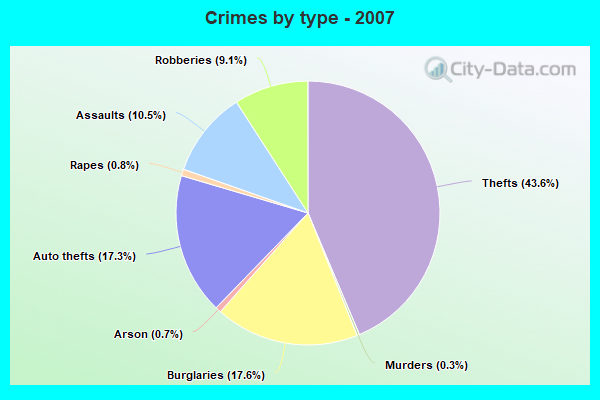
Violent crime rate in 2007
| Long Beach: | 340.3 |
| U.S. Average: | 229.1 |
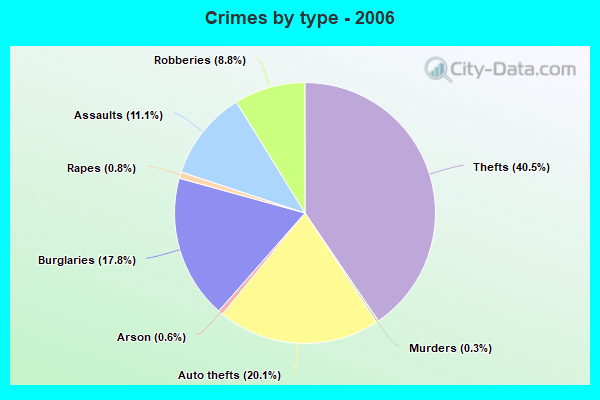
Violent crime rate in 2006
| Long Beach: | 336.0 |
| U.S. Average: | 232.6 |
Violent crime rate in 2005
| Long Beach: | 330.7 |
| U.S. Average: | 227.0 |
Property crime rate in 2022
| Long Beach: | 270.1 |
| U.S. Average: | 166.5 |
Property crime rate in 2021
| Long Beach: | 0.0 |
| U.S. Average: | 157.8 |
Property crime rate in 2020
| Long Beach: | 280.2 |
| U.S. Average: | 169.6 |
Property crime rate in 2019
| Long Beach: | 241.1 |
| U.S. Average: | 179.7 |
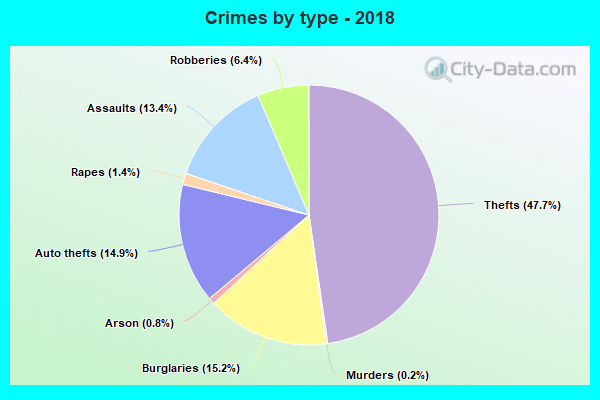
Property crime rate in 2018
| Long Beach: | 249.4 |
| U.S. Average: | 190.2 |
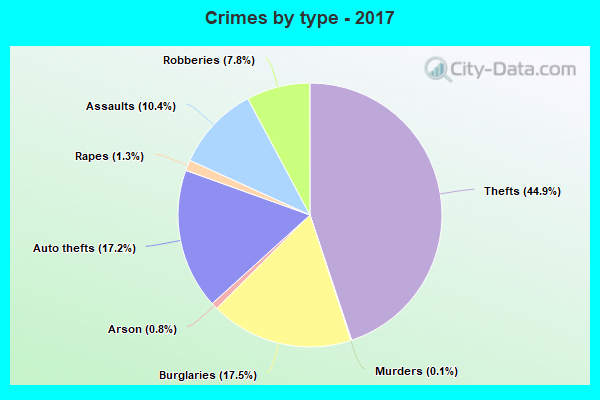
Property crime rate in 2017
| Long Beach: | 279.5 |
| U.S. Average: | 206.4 |
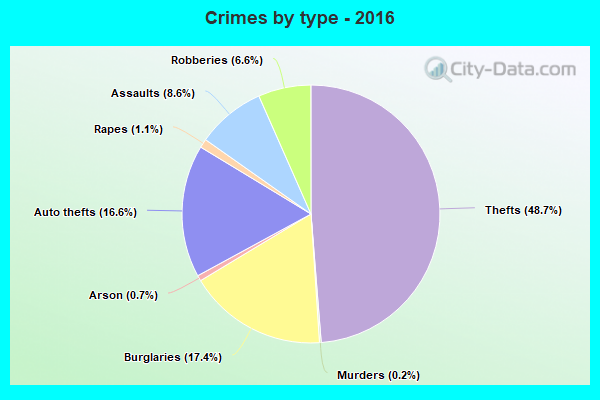
Property crime rate in 2016
| Long Beach: | 303.3 |
| U.S. Average: | 216.6 |
Property crime rate in 2015
| Long Beach: | 307.3 |
| U.S. Average: | 221.5 |
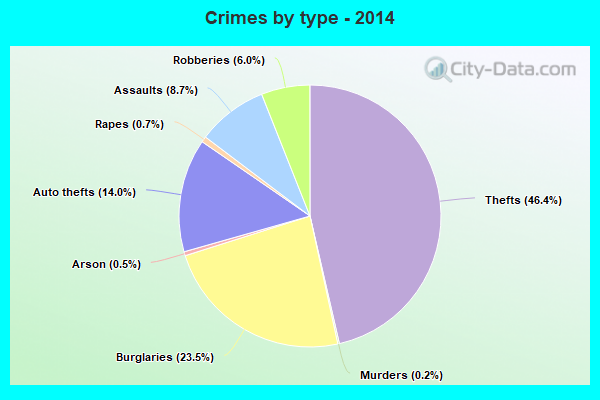
Property crime rate in 2014
| Long Beach: | 287.0 |
| U.S. Average: | 230.8 |
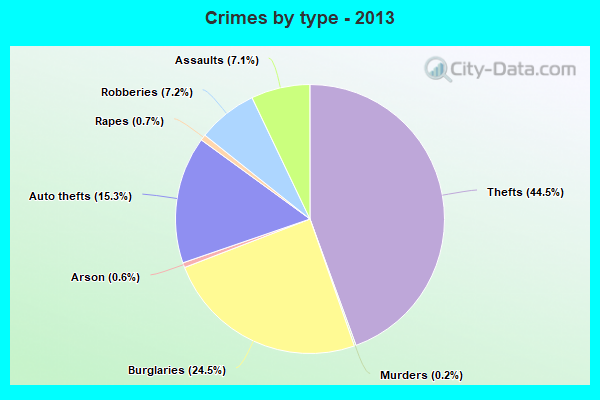
Property crime rate in 2013
| Long Beach: | 309.1 |
| U.S. Average: | 250.4 |
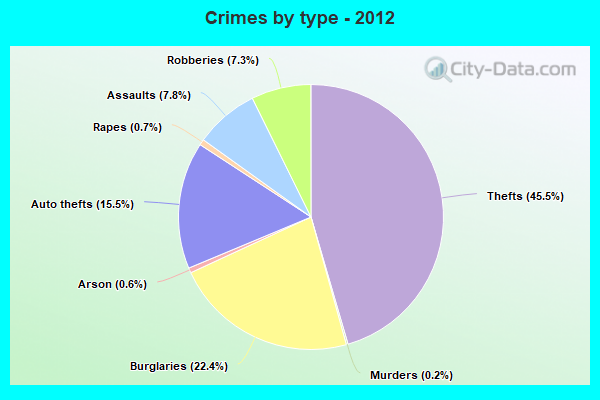
Property crime rate in 2012
| Long Beach: | 327.6 |
| U.S. Average: | 267.3 |
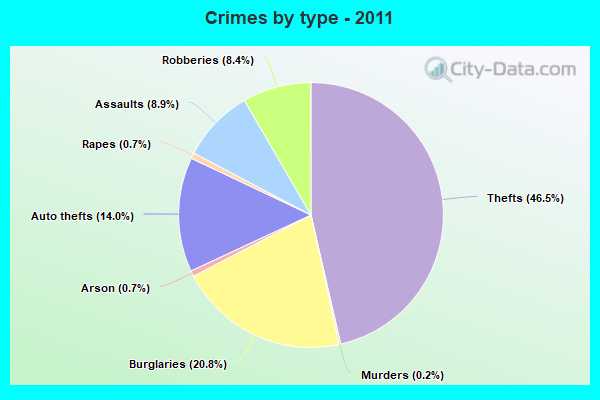
Property crime rate in 2011
| Long Beach: | 289.3 |
| U.S. Average: | 273.5 |
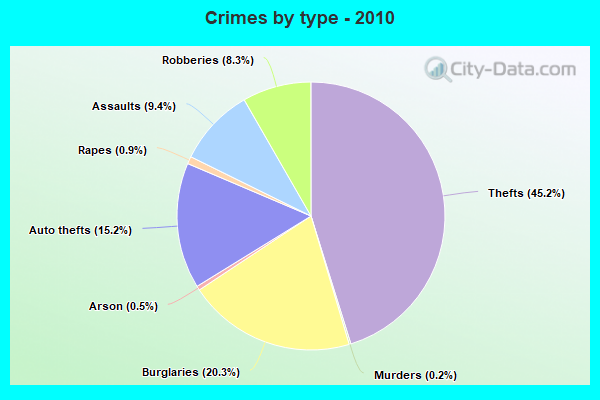
Property crime rate in 2010
| Long Beach: | 268.3 |
| U.S. Average: | 276.4 |
Property crime rate in 2009
| Long Beach: | 287.9 |
| U.S. Average: | 285.6 |
Property crime rate in 2008
| Long Beach: | 299.5 |
| U.S. Average: | 302.2 |
Property crime rate in 2007
| Long Beach: | 252.8 |
| U.S. Average: | 309.2 |
Property crime rate in 2006
| Long Beach: | 256.2 |
| U.S. Average: | 317.3 |
Property crime rate in 2005
| Long Beach: | 272.0 |
| U.S. Average: | 322.3 |


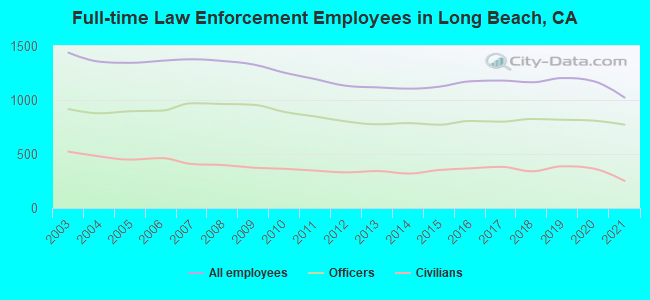
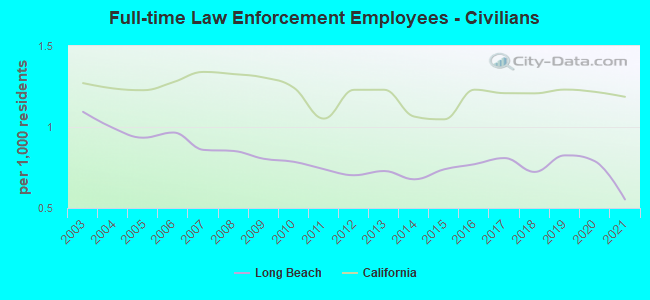
Full-time law enforcement employees in 2021, including police officers: 1,023 (772 officers - 679 male; 93 female).
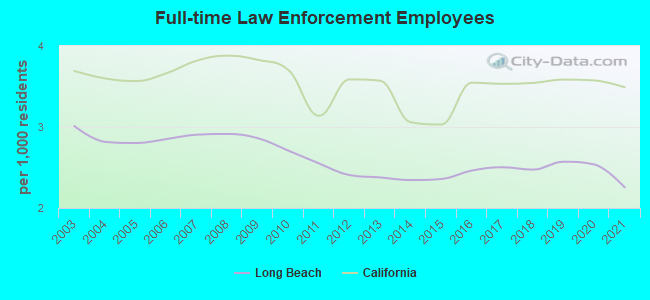
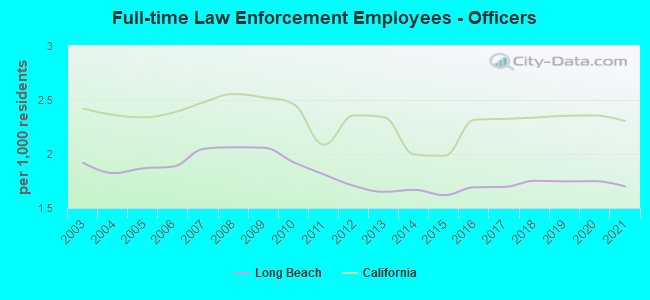
| Officers per 1,000 residents here: | 1.70 |
| California average: | 2.30 |
Full-time law enforcement employees in 2020, including police officers: 1,174 (809 officers - 718 male; 91 female).
| Officers per 1,000 residents here: | 1.75 |
| California average: | 2.36 |
Full-time law enforcement employees in 2019, including police officers: 1,203 (817 officers - 733 male; 84 female).
| Officers per 1,000 residents here: | 1.75 |
| California average: | 2.35 |
Full-time law enforcement employees in 2018, including police officers: 1,164 (824 officers - 739 male; 85 female).
| Officers per 1,000 residents here: | 1.75 |
| California average: | 2.34 |
Full-time law enforcement employees in 2017, including police officers: 1,180 (799 officers - 716 male; 83 female).
| Officers per 1,000 residents here: | 1.69 |
| California average: | 2.32 |
Full-time law enforcement employees in 2016, including police officers: 1,173 (806 officers - 725 male; 81 female).
| Officers per 1,000 residents here: | 1.69 |
| California average: | 2.32 |
Full-time law enforcement employees in 2015, including police officers: 1,123 (771 officers - 696 male; 75 female).
| Officers per 1,000 residents here: | 1.62 |
| California average: | 1.98 |
Full-time law enforcement employees in 2014, including police officers: 1,105 (786 officers - 710 male; 76 female).
| Officers per 1,000 residents here: | 1.67 |
| California average: | 2.00 |
Full-time law enforcement employees in 2013, including police officers: 1,117 (775 officers - 700 male; 75 female).
| Officers per 1,000 residents here: | 1.65 |
| California average: | 2.34 |
Full-time law enforcement employees in 2012, including police officers: 1,131 (801 officers - 723 male; 78 female).
| Officers per 1,000 residents here: | 1.70 |
| California average: | 2.36 |
Full-time law enforcement employees in 2011, including police officers: 1,193 (847 officers - 768 male; 79 female).
| Officers per 1,000 residents here: | 1.81 |
| California average: | 2.09 |
Full-time law enforcement employees in 2010, including police officers: 1,252 (889 officers - 806 male; 83 female).
| Officers per 1,000 residents here: | 1.92 |
| California average: | 2.46 |
Full-time law enforcement employees in 2009, including police officers: 1,328 (955 officers - 868 male; 87 female).
| Officers per 1,000 residents here: | 2.06 |
| California average: | 2.52 |
Full-time law enforcement employees in 2008, including police officers: 1,361 (963 officers - 873 male; 90 female).
| Officers per 1,000 residents here: | 2.06 |
| California average: | 2.55 |
Full-time law enforcement employees in 2007, including police officers: 1,377 (970 officers - 880 male; 90 female).
| Officers per 1,000 residents here: | 2.05 |
| California average: | 2.48 |
Full-time law enforcement employees in 2006, including police officers: 1,363 (901 officers - 817 male; 84 female).
| Officers per 1,000 residents here: | 1.88 |
| California average: | 2.38 |
Full-time law enforcement employees in 2005, including police officers: 1,344 (896 officers - 807 male; 89 female).
| Officers per 1,000 residents here: | 1.87 |
| California average: | 2.34 |
Full-time law enforcement employees in 2004, including police officers: 1,355 (877 officers - 792 male; 85 female).
| Officers per 1,000 residents here: | 1.82 |
| California average: | 2.36 |
Full-time law enforcement employees in 2003, including police officers: 1,438 (916 officers - 826 male; 90 female).
| Officers per 1,000 residents here: | 1.92 |
| California average: | 2.42 |

Zip codes: 90731, 90755, 90802, 90803, 90804, 90806, 90808, 90813, 90814, 90815, 90822, 90831.