Estimated zip code population in 2022: 36,989 Zip code population in 2010: 40,311 Zip code population in 2000: 43,466
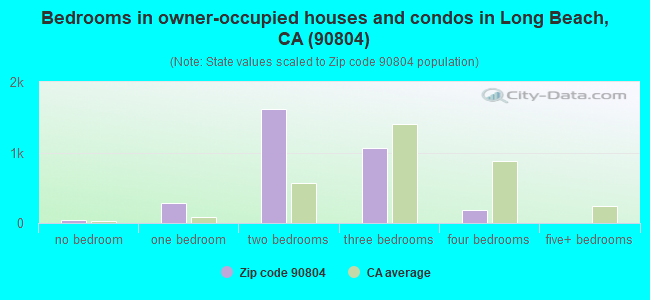
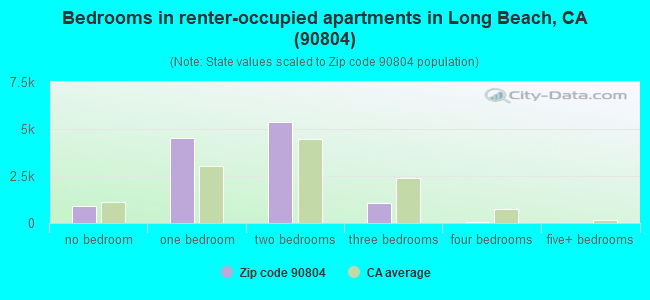
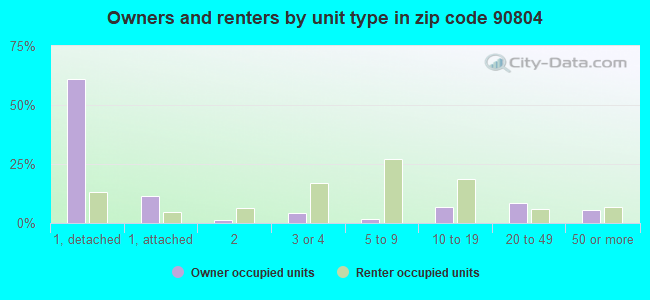
Houses and condos: 16,141 Renter-occupied apartments: 11,966
% of renters here:
79%
State:
44%
March 2022 cost of living index in zip code 90804: 137.5 (high, U.S. average is 100)
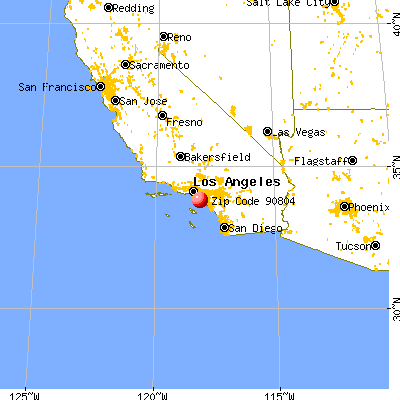
Land area: 2.1 sq. mi. Water area: 0.0 sq. mi.
Population density: 17,490 people per square mile
(very high).
OSM Map
General Map
Google Map
MSN Map
OSM Map
General Map
Google Map
MSN Map
OSM Map
General Map
Google Map
MSN Map
OSM Map
General Map
Google Map
MSN Map
Please wait while loading the map...
Real estate property taxes paid for housing units in 2022:
This zip code:
0.6% ($4,388)
California:
0.7% ($4,831)
Median real estate property taxes paid for housing units with mortgages in 2022: $4,798 (0.7%) Median real estate property taxes paid for housing units with no mortgage in 2022: $3,453 (0.5%)
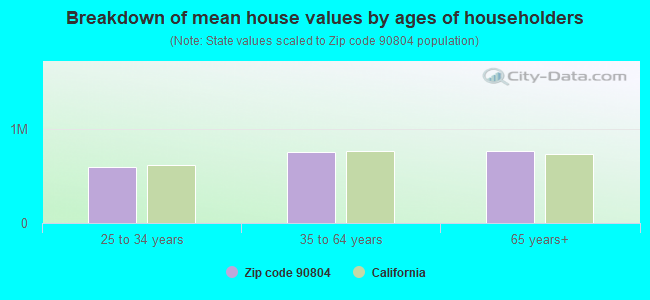
Estimated median house/condo value in 2022: $684,410
90804:
$684,410
California:
$715,900
According to our research of California and other state lists, there were 57 registered sex offenders living in 90804 zip code as of April 27, 2024. The ratio of all residents to sex offenders in zip code 90804 is 725 to 1. The ratio of registered sex offenders to all residents in this zip code is near the state average.
Median resident age:
This zip code:
34.5 years
California median age:
37.9 years
Average household size:
This zip code:
2.3 people
California:
2.8 people
Averages for the 2020 tax year for zip code 90804, filed in 2021:
Average Adjusted Gross Income (AGI) in 2020: $49,360 (Individual Income Tax Returns)
Here:
$49,360
State:
$95,910
Salary/wage: $46,583 (reported on 86.2% of returns)
Here:
$46,583
State:
$77,331
(% of AGI for various income ranges: 1232.0% for AGIs below $25k, 4077.8% for AGIs $25k-50k, 7718.3% for AGIs $50k-75k, 11205.1% for AGIs $75k-100k, 19988.9% for AGIs $100k-200k, 78033.6% for AGIs over 200k)
Taxable interest for individuals: $656 (reported on 18.5% of returns)
This zip code:
$656
California:
$2,294
(% of AGI for various income ranges: 4.2% for AGIs below $25k, 7.2% for AGIs $25k-50k, 10.9% for AGIs $50k-75k, 49.3% for AGIs $75k-100k, 65.0% for AGIs $100k-200k, 466.4% for AGIs over 200k)
Ordinary dividends: $2,505 (reported on 8.8% of returns)
Here:
$2,505
State:
$10,949
(% of AGI for various income ranges: 5.2% for AGIs below $25k, 8.0% for AGIs $25k-50k, 18.0% for AGIs $50k-75k, 55.2% for AGIs $75k-100k, 152.0% for AGIs $100k-200k, 1207.3% for AGIs over 200k)
Net capital gain/loss in AGI: +$7,526 (reported on 10.1% of returns)
Here:
+$7,526
State:
+$49,306
(% of AGI for various income ranges: 2.5% for AGIs below $25k, 10.2% for AGIs $25k-50k, 34.5% for AGIs $50k-75k, 132.9% for AGIs $75k-100k, 329.1% for AGIs $100k-200k, 8146.4% for AGIs over 200k)
Profit/loss from business: +$7,132 (reported on 18.7% of returns)
Here:
+$7,132
State:
+$15,671
(% of AGI for various income ranges: 147.6% for AGIs below $25k, 116.4% for AGIs $25k-50k, 129.6% for AGIs $50k-75k, 177.6% for AGIs $75k-100k, 402.7% for AGIs $100k-200k, 4826.4% for AGIs over 200k)
Taxable individual retirement arrangement distribution: $13,474 (reported on 2.0% of returns)
90804:
$13,474
California:
$23,505
(% of AGI for various income ranges: 8.2% for AGIs below $25k, 17.7% for AGIs $25k-50k, 38.5% for AGIs $50k-75k, 93.7% for AGIs $75k-100k, 174.9% for AGIs $100k-200k, 762.7% for AGIs over 200k)
Self-employed (Keogh) retirement plans: $23,367 (reported on 0.2% of returns)
90804:
$23,367
California:
$30,163
(% of AGI for various income ranges: 79.7% for AGIs $100k-200k)
Total itemized deductions: $27,599 (reported on 8.1% of returns)
Here:
$27,599
State:
$39,517
(% of AGI for various income ranges: 33.5% for AGIs below $25k, 92.6% for AGIs $25k-50k, 301.9% for AGIs $50k-75k, 784.5% for AGIs $75k-100k, 1664.7% for AGIs $100k-200k, 7757.3% for AGIs over 200k)
Charity contributions: $4,746 (reported on 6.6% of returns)
Here:
$4,746
State:
$12,598
(% of AGI for various income ranges: 2.2% for AGIs below $25k, 12.6% for AGIs $25k-50k, 41.5% for AGIs $50k-75k, 96.4% for AGIs $75k-100k, 249.4% for AGIs $100k-200k, 1210.0% for AGIs over 200k)
Taxes paid: $8,374 (reported on 8.1% of returns)
90804:
$8,374
State:
$8,807
(% of AGI for various income ranges: 7.4% for AGIs below $25k, 20.9% for AGIs $25k-50k, 90.1% for AGIs $50k-75k, 269.3% for AGIs $75k-100k, 557.7% for AGIs $100k-200k, 1998.2% for AGIs over 200k)
Earned income credit: $1,993 (reported on 19.7% of returns)
Here:
$1,993
State:
$2,074
(% of AGI for various income ranges: 96.4% for AGIs below $25k, 65.4% for AGIs $25k-50k, 0.9% for AGIs $50k-75k)
Percentage of individuals using paid preparers for their 2020 taxes: 93.2%
Here:
93%
State:
92%
(% for various income ranges: 92.2% for AGIs below $25k, 93.0% for AGIs $25k-50k, 93.6% for AGIs $50k-75k, 94.7% for AGIs $75k-100k, 95.5% for AGIs $100k-200k, 94.7% for AGIs over 200k)
Averages for the 2012 tax year for zip code 90804, filed in 2013:
Average Adjusted Gross Income (AGI) in 2012: $37,514 (Individual Income Tax Returns)
Here:
$37,514
State:
$72,726
Salary/wage: $36,766 (reported on 88.4% of returns)
Here:
$36,766
State:
$59,079
(% of AGI for various income ranges: 81.6% for AGIs below $25k, 91.0% for AGIs $25k-50k, 90.7% for AGIs $50k-75k, 89.1% for AGIs $75k-100k, 85.9% for AGIs $100k-200k, 67.5% for AGIs over 200k)
Taxable interest for individuals: $660 (reported on 18.4% of returns)
This zip code:
$660
California:
$2,146
(% of AGI for various income ranges: 0.3% for AGIs below $25k, 0.1% for AGIs $25k-50k, 0.4% for AGIs $50k-75k, 0.2% for AGIs $75k-100k, 0.5% for AGIs $100k-200k, 0.6% for AGIs over 200k)
Ordinary dividends: $2,060 (reported on 6.6% of returns)
Here:
$2,060
State:
$9,308
(% of AGI for various income ranges: 0.3% for AGIs below $25k, 0.2% for AGIs $25k-50k, 0.3% for AGIs $50k-75k, 0.4% for AGIs $75k-100k, 0.7% for AGIs $100k-200k, 0.6% for AGIs over 200k)
Net capital gain/loss in AGI: +$3,489 (reported on 6.0% of returns)
Here:
+$3,489
State:
+$30,460
(% of AGI for various income ranges: 0.2% for AGIs $50k-75k, 1.1% for AGIs $100k-200k, 5.2% for AGIs over 200k)
Profit/loss from business: +$8,936 (reported on 17.3% of returns)
Here:
+$8,936
State:
+$17,064
(% of AGI for various income ranges: 11.5% for AGIs below $25k, 3.0% for AGIs $25k-50k, 1.3% for AGIs $50k-75k, 2.1% for AGIs $75k-100k, 2.9% for AGIs $100k-200k, 5.0% for AGIs over 200k)
Taxable individual retirement arrangement distribution: $9,982 (reported on 2.4% of returns)
90804:
$9,982
California:
$19,557
(% of AGI for various income ranges: 0.5% for AGIs below $25k, 0.5% for AGIs $25k-50k, 0.6% for AGIs $50k-75k, 0.8% for AGIs $75k-100k, 1.0% for AGIs $100k-200k)
Self-employment retirement plans: $11,675 (reported on 0.2% of returns)
90804:
$11,675
California:
$24,530
Total itemized deductions: $21,371 (27% of AGI, reported on 21.1% of returns)
Here:
$21,371
State:
$34,004
Here:
27.1% of AGI
State:
22.7% of AGI
(% of AGI for various income ranges: 4.8% for AGIs below $25k, 7.7% for AGIs $25k-50k, 12.9% for AGIs $50k-75k, 17.1% for AGIs $75k-100k, 19.4% for AGIs $100k-200k, 17.6% for AGIs over 200k)
Charity contributions: $2,653 (reported on 16.9% of returns)
Here:
$2,653
State:
$4,659
(% of AGI for various income ranges: 0.4% for AGIs below $25k, 0.8% for AGIs $25k-50k, 1.3% for AGIs $50k-75k, 1.8% for AGIs $75k-100k, 1.7% for AGIs $100k-200k, 1.9% for AGIs over 200k)
Taxes paid: $6,922 (reported on 21.0% of returns)
90804:
$6,922
State:
$14,448
(% of AGI for various income ranges: 0.8% for AGIs below $25k, 1.6% for AGIs $25k-50k, 3.6% for AGIs $50k-75k, 5.9% for AGIs $75k-100k, 7.7% for AGIs $100k-200k, 8.6% for AGIs over 200k)
Earned income credit: $2,310 (reported on 28.9% of returns)
Here:
$2,310
State:
$2,286
(% of AGI for various income ranges: 8.5% for AGIs below $25k, 1.3% for AGIs $25k-50k)
Percentage of individuals using paid preparers for their 2012 taxes: 64.8%
Here:
65%
State:
64%
(% for various income ranges: 64.4% for AGIs below $25k, 64.6% for AGIs $25k-50k, 63.9% for AGIs $50k-75k, 66.0% for AGIs $75k-100k, 67.5% for AGIs $100k-200k, 84.6% for AGIs over 200k)
Averages for the 2004 tax year for zip code 90804, filed in 2005:
Average Adjusted Gross Income (AGI) in 2004: $30,895 (Individual Income Tax Returns)
Here:
$30,895
State:
$58,600
Salary/wage: $30,307 (reported on 90.4% of returns)
Here:
$30,307
State:
$49,455
(% of AGI for various income ranges: 101.5% for AGIs below $10k, 88.3% for AGIs $10k-25k, 94.0% for AGIs $25k-50k, 91.3% for AGIs $50k-75k, 87.1% for AGIs $75k-100k, 70.8% for AGIs over 100k)
Taxable interest for individuals: $754 (reported on 25.0% of returns)
This zip code:
$754
California:
$2,365
(% of AGI for various income ranges: 1.8% for AGIs below $10k, 0.5% for AGIs $10k-25k, 0.3% for AGIs $25k-50k, 0.6% for AGIs $50k-75k, 0.8% for AGIs $75k-100k, 1.2% for AGIs over 100k)
Taxable dividends: $1,383 (reported on 8.2% of returns)
Here:
$1,383
State:
$4,746
(% of AGI for various income ranges: 1.1% for AGIs below $10k, 0.3% for AGIs $10k-25k, 0.2% for AGIs $25k-50k, 0.3% for AGIs $50k-75k, 0.7% for AGIs $75k-100k, 0.8% for AGIs over 100k)
Net capital gain/loss: +$6,333 (reported on 7.3% of returns)
Here:
+$6,333
State:
+$23,418
(% of AGI for various income ranges: -0.3% for AGIs below $10k, 0.1% for AGIs $10k-25k, -0.1% for AGIs $25k-50k, 0.4% for AGIs $50k-75k, 1.3% for AGIs $75k-100k, 9.2% for AGIs over 100k)
Profit/loss from business: +$8,625 (reported on 14.6% of returns)
Here:
+$8,625
State:
+$16,826
(% of AGI for various income ranges: 13.1% for AGIs below $10k, 6.9% for AGIs $10k-25k, 2.6% for AGIs $25k-50k, 2.2% for AGIs $50k-75k, 4.2% for AGIs $75k-100k, 4.8% for AGIs over 100k)
IRA payment deduction: $2,453 (reported on 1.6% of returns)
90804:
$2,453
California:
$3,192
(% of AGI for various income ranges: 0.1% for AGIs $10k-25k, 0.2% for AGIs $25k-50k, 0.1% for AGIs $50k-75k, 0.1% for AGIs $75k-100k, 0.1% for AGIs over 100k)
Self-employed pension: $10,338 (reported on 0.5% of returns)
Here:
$10,338
California:
$17,688
(% of AGI for various income ranges: 0.3% for AGIs below $10k, 0.1% for AGIs $25k-50k, 0.1% for AGIs $50k-75k, 0.3% for AGIs $75k-100k, 0.6% for AGIs over 100k)
Total itemized deductions: $18,856 (31% of AGI, reported on 22.6% of returns)
Here:
$18,856
State:
$28,113
Here:
31.4% of AGI
State:
25.3% of AGI
(% of AGI for various income ranges: 7.4% for AGIs below $10k, 5.2% for AGIs $10k-25k, 11.7% for AGIs $25k-50k, 18.7% for AGIs $50k-75k, 20.7% for AGIs $75k-100k, 19.7% for AGIs over 100k)
Charity contributions deductions: $2,724 (4% of AGI, reported on 19.6% of returns)
Here:
$2,724
State:
$3,923
Here:
4.4% of AGI
State:
3.3% of AGI
(% of AGI for various income ranges: 0.3% for AGIs below $10k, 0.6% for AGIs $10k-25k, 1.6% for AGIs $25k-50k, 2.3% for AGIs $50k-75k, 2.4% for AGIs $75k-100k, 2.5% for AGIs over 100k)
Total tax: $3,934 (reported on 66.3% of returns)
90804:
$3,934
State:
$10,761
(% of AGI for various income ranges: 4.5% for AGIs below $10k, 3.7% for AGIs $10k-25k, 6.4% for AGIs $25k-50k, 9.7% for AGIs $50k-75k, 12.0% for AGIs $75k-100k, 16.2% for AGIs over 100k)
Earned income credit: $1,869 (reported on 26.1% of returns)
Here:
$1,869
State:
$1,763
Percentage of individuals using paid preparers for their 2004 taxes: 66.5%
Here:
66%
State:
66%
(% for various income ranges: 62.0% for AGIs below $10k, 68.1% for AGIs $10k-25k, 66.2% for AGIs $25k-50k, 66.7% for AGIs $50k-75k, 69.2% for AGIs $75k-100k, 76.3% for AGIs over 100k)
Likely homosexual households (counted as self-reported same-sex unmarried-partner households)
Lesbian couples: 0.5% of all households
Gay men: 0.4% of all households
Household received Food Stamps/SNAP in the past 12 months: 2,230 Household did not receive Food Stamps/SNAP in the past 12 months: 13,062
Women who had a birth in the past 12 months: 344 (232 now married, 112 unmarried) Women who did not have a birth in the past 12 months: 10,832 (3,317 now married, 7,555 unmarried)
Housing units in zip code 90804 with a mortgage: 2,452 (219 second mortgage, 5 home equity loan, 199 both second mortgage and home equity loan) Median monthly owner costs for units with a mortgage: $2,719 Median monthly owner costs for units without a mortgage: $581
Residents with income below the poverty level in 2022:
This zip code:
19.8%
Whole state:
12.2%
Residents with income below 50% of the poverty level in 2022:
This zip code:
10.3%
Whole state:
6.2%
Median number of rooms in houses and condos:
Here:
4.9
State:
6.0
Median number of rooms in apartments:
Here:
3.8
State:
3.9
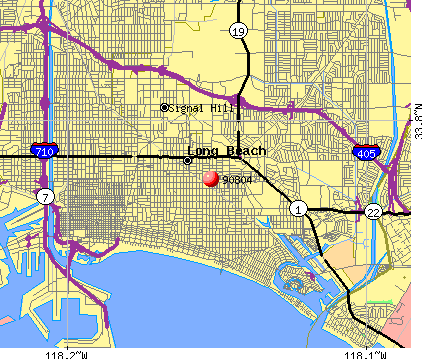
Notable locations in this zip code not listed on our city pages
Notable locations in zip code 90804: Los Alamitos Circle (A), Recreation Park Golf Course (B), Brewitt Branch Long Beach Public Library (C). Display/hide their locations on the map
Churches in zip code 90804 include: East Long Beach Methodist Episcopal Church (A), First Foursquare Church (B), Temple Baptist Church (C), Church of God (D), The Church of Jesus Christ of Latter Day Saints (E), East Long Beach Church of Christ (F), Glesin Methodist Church (G). Display/hide their locations on the map
Parks in zip code 90804 include: Joe Rodgers Field (1), Bruin Stadium (2), Orizaba Park (3), Recreation Park (4), Rose Park (5), Blair Field (6). Display/hide their locations on the map
2,938 married couples with children.
2,669 single-parent households (730 men, 1,939 women).
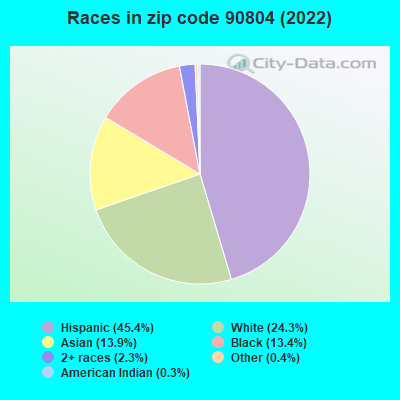
50.8% of residents of 90804 zip code speak English at home.
36.5% of residents speak Spanish at home (68% very well, 17% well, 11% not well, 3% not at all).
1.8% of residents speak other Indo-European language at home (77% very well, 19% well, 3% not well, 1% not at all).
10.0% of residents speak Asian or Pacific Island language at home (43% very well, 34% well, 16% not well, 6% not at all).
0.4% of residents speak other language at home (72% very well, 28% well).
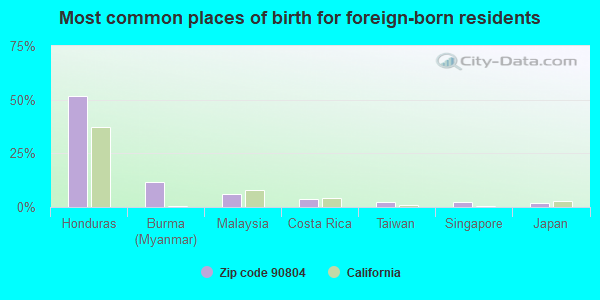
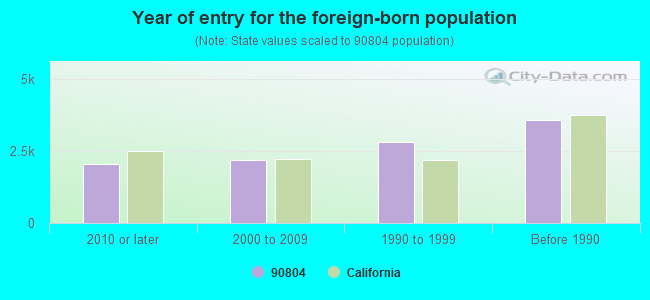
Foreign born population: 10,172 (27.5%) (43.0% of them are naturalized citizens)
Major facilities with environmental interests located in this zip code:
CHEVRON STATION NO 90817 (700 REDONDO AVENUE in LONG BEACH, CA)
STATE MASTER (California - Hazardous Waste Tracking) - HAZARDOU WASTE PROGRAM Small Quantity Generators, between 100 kg and 1000 kg of hazardous waste/month (Resource Conservation and Recovery Act (tracking hazardous waste)) - notification Small Quantity Generators, between 100 kg and 1000 kg of hazardous waste/month (Resource Conservation and Recovery Act (tracking hazardous waste)) - notification STATE MASTER (California - Used Oil Recycling System ) - USED OIL RECYCLING Organizations: CHEVRON PRODUCTS CO (CONTACT/OWNER)
, BAHRAM KASRAVI (CONTACT/OWNER)
Alternative names: BOB S CHEVRON #1, BOBS CHEVRON SVC
NESS GARMAN AUTO (4417 E ANAHIEM in LONG BEACH, CA)
STATE MASTER (California - Hazardous Waste Tracking) - HAZARDOU WASTE PROGRAM (Resource Conservation and Recovery Act (tracking hazardous waste)) Organizations: NOKLIS TERZIS (CONTACT/OWNER)
Alternative names: NESS GERMAN AUTO
CALEB BRETT USA INCORPORATED (1941,FREEMAN AVE., SUITE#A in SIGNAL HILL, CA)
STATE MASTER (California - Hazardous Waste Tracking) - HAZARDOU WASTE PROGRAM Large Quantity Generators, more that 1000 kg of hazardous waste/month (Resource Conservation and Recovery Act (tracking hazardous waste)) Business NAICS classification: ALL OTHER BUSINESS SUPPORT SERVICES. Alternative names: INTERTEK CALEB BRETT
LASZLOS SPORT CAR CENTER INC (2625 E ANAHEIM ST in LONG BEACH, CA)
STATE MASTER (California - Hazardous Waste Tracking) - HAZARDOU WASTE PROGRAM Small Quantity Generators, between 100 kg and 1000 kg of hazardous waste/month (Resource Conservation and Recovery Act (tracking hazardous waste)) - notification Business NAICS classification: AUTOMOTIVE BODY, PAINT, AND INTERIOR REPAIR AND MAINTENANCE. Organizations: ALTMAN J & BATKILIN J (CONTACT/OWNER)
EAST LONG BEACH BRAKE SVC (4401 E ANAHEIM ST in LONG BEACH, CA)
STATE MASTER (California - Hazardous Waste Tracking) - HAZARDOU WASTE PROGRAM Small Quantity Generators, between 100 kg and 1000 kg of hazardous waste/month (Resource Conservation and Recovery Act (tracking hazardous waste)) - notification Organizations: GARY LYNCH (CONTACT/OWNER)
LONG BEACH USD-LEE ELEMENTARY (1620 TEMPLE AVENUE in LONG BEACH, CA)
(National Center for Education Statistics) - STATE ID-6015432 Small Quantity Generators, between 100 kg and 1000 kg of hazardous waste/month (Resource Conservation and Recovery Act (tracking hazardous waste)) Organizations: LONG BEACH UNIFIED (SCHOOL DISTRICT)
LONG BEACH USD-BRYANT ELEMENTARY (4101 E FOUNTAIN STREET in LONG BEACH, CA)
(National Center for Education Statistics) - STATE ID-6015168 Small Quantity Generators, between 100 kg and 1000 kg of hazardous waste/month (Resource Conservation and Recovery Act (tracking hazardous waste)) Organizations: LONG BEACH UNIFIED (SCHOOL DISTRICT)
LONG BEACH USD-WILLARD ELEMENTARY (1055 FREEMAN AVENUE in LONG BEACH, CA)
(National Center for Education Statistics) - STATE ID-6015697 Small Quantity Generators, between 100 kg and 1000 kg of hazardous waste/month (Resource Conservation and Recovery Act (tracking hazardous waste)) Organizations: LONG BEACH UNIFIED (SCHOOL DISTRICT)
ACE CLEANERS (5107 EAST PACIFIC COAST HIGHWAY in LONG BEACH, CA)
STATE MASTER (California - Hazardous Waste Tracking) - HAZARDOU WASTE PROGRAM Small Quantity Generators, between 100 kg and 1000 kg of hazardous waste/month (Resource Conservation and Recovery Act (tracking hazardous waste)) - notification Organizations: CHONG TONG SU (CONTACT/OWNER)
LONG BEACH USD JEFFERSON JR HIGH (750 EUCLID AVENUE in LONG BEACH, CA)
STATE MASTER (California - Hazardous Waste Tracking) - HAZARDOU WASTE PROGRAM Small Quantity Generators, between 100 kg and 1000 kg of hazardous waste/month (Resource Conservation and Recovery Act (tracking hazardous waste)) Alternative names: LBUSD-JEFFERSON MIDDLE SCHOOL
LONG BEACH USD-WILSON HIGH SCHOOL (4400 EAST 10 STREET in LONG BEACH, CA)
STATE MASTER (California - Hazardous Waste Tracking) - HAZARDOU WASTE PROGRAM Small Quantity Generators, between 100 kg and 1000 kg of hazardous waste/month (Resource Conservation and Recovery Act (tracking hazardous waste)) Alternative names: LBUSD-WILSON HIGH SCHOOL
CENTRUM ANALYTICAL LABS (3299 HILL ST STE 305 in SIGNAL HILL, CA)
STATE MASTER (California - Hazardous Waste Tracking) - HAZARDOU WASTE PROGRAM Small Quantity Generators, between 100 kg and 1000 kg of hazardous waste/month (Resource Conservation and Recovery Act (tracking hazardous waste)) - notification Organizations: CENTRUM ANALYTICAL LABS INC (CONTACT/OWNER)
NEXTEL 6 (3910 EAST 7TH STREET in LONG BEACH, CA)
(Integrated Compliance Information System) - ICIS-HQ-2002-6001, FORMAL ENFORCEMENT ACTION Small Quantity Generators, between 100 kg and 1000 kg of hazardous waste/month (Resource Conservation and Recovery Act (tracking hazardous waste)) Alternative names: GEN TELEPHONE OF CA/ LONG BEACH-2
Housing units lacking complete plumbing facilities: 0.7% Housing units lacking complete kitchen facilities: 3.3%
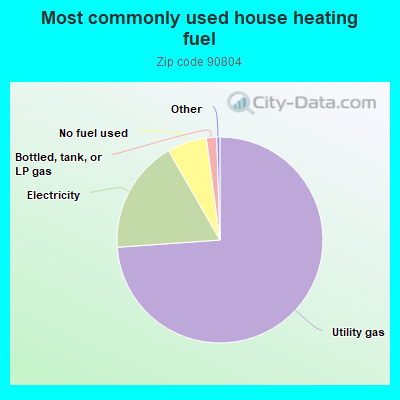
73.8%Utility gas
17.8%Electricity
6.2%No fuel used
1.6%Bottled, tank, or LP gas
Population in 1990: 36,092. Population change in the 1990s: +7,374 (+20.4%).
Place of birth for U.S.-born residents:
This state: 22,285
Northeast: 1,061
Midwest: 1,076
South: 1,346
West: 577
40% of the 90804 zip code residents lived in the same house 5 years ago. Out of people who lived in different houses, 80% lived in this county. Out of people who lived in different counties, 50% lived in California.
91% of the 90804 zip code residents lived in the same house 1 year ago. Out of people who lived in different houses, 70% moved from this county. Out of people who lived in different houses, 16% moved from different county within same state. Out of people who lived in different houses, 7% moved from different state. Out of people who lived in different houses, 5% moved from abroad.
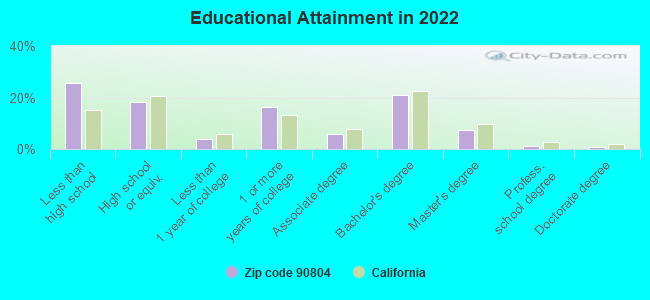
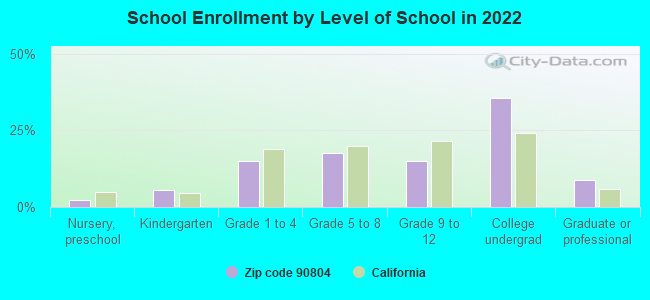
Private vs. public school enrollment:
Students in private schools in grades 1 to 8 (elementary and middle school): 66
Here:
2.4%
California:
10.5%
Students in private schools in grades 9 to 12 (high school): 25
Here:
2.0%
California:
8.5%
Students in private undergraduate colleges: 161
Here:
5.4%
California:
15.9%
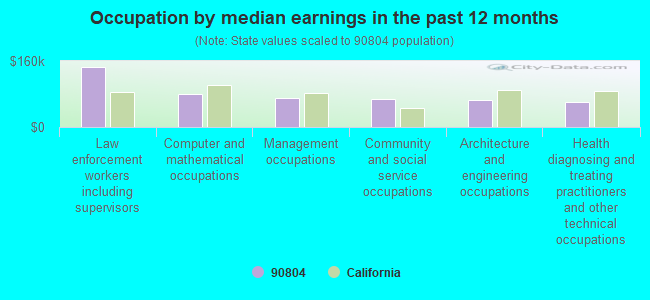
Occupation by median earnings in the past 12 months ($)
145,223Law enforcement workers including supervisors
78,875Computer and mathematical occupations
71,473Management occupations
68,111Community and social service occupations
66,076Architecture and engineering occupations
61,615Health diagnosing and treating practitioners and other technical occupations
Companies with federal contracts located in this zip code:
AMERICAN BRIDGE COMPANY (5150 E PAC CST HWY STE 420 in LONG BEACH, CA) : $12,018,031 in 15 contractsfrom 2003 to 2006
Contracts for Construction of Structures and Facilities -- Other Non-Building Facilities, Maintenance, Repair or Alteration of Real Property -- Other Non-Building Facilities, Maintenance, Repair or Alteration of Real Property -- Highways, Roads, Streets, Bridges, and Railways (includes resurfacing) by Navy Signed by year:2000: $0; 2001: $0; 2002: $0; 2003: $807,449; 2004: $10,237,899; 2005: $926,868; 2006: $45,815.
Biggest contracts:
$9,892,000 with Navy for Construction of Structures and Facilities -- Other Non-Building Facilities. Taking place in WA. Signed on 2004-09-27. Completion date: 2006-03-01.
$782,449 with Navy for Maintenance, Repair or Alteration of Real Property -- Other Non-Building Facilities. Signed on 2003-09-30. Completion date: 2004-08-10.
$599,340 with Navy for Maintenance, Repair or Alteration of Real Property -- Highways, Roads, Streets, Bridges, and Railways (includes resurfacing). Signed on 2005-09-26. Completion date: 2006-07-15.
$234,053 with Navy for Construction of Structures and Facilities -- Other Non-Building Facilities. Taking place in WA. Signed on 2005-09-26. Completion date: 2006-03-01.
COMPOSITE OPTIMIZATION COMPANY (5199 E PACIFTIC COAST HWY in LONG BEACH, CA; small business) : $895,413 in 5 contractsfrom 2003 to 2005
Contracts for Physical Sciences -- Applied Research and Exploratory Development (R&D), Other Defense -- Applied Research and Exploratory Development (R&D) by Army Signed by year:2000: $0; 2001: $0; 2002: $0; 2003: $484,956; 2004: $0; 2005: $410,457; 2006: $0.
Biggest contracts:
$364,999 with Army for Physical Sciences -- Applied Research and Exploratory Development (R&D). Signed on 2003-12-16. Completion date: 2006-01-15.
$361,558, same as above.Signed on 2005-01-31. Completion date: 2006-01-15.
$69,960 with Army for Other Defense -- Applied Research and Exploratory Development (R&D). Signed on 2003-01-13. Completion date: 2003-09-15.
$49,997, same as above.Signed on 2003-08-19. Completion date: 2004-01-20.
HARTWICK COMBUSTION TECHNOLOGI (4120 WILTON ST in LONG BEACH, CA; small business)
$4,385 with Navy for Industrial Furnaces, Kilns, Lehrs, and Ovens. Signed on 2005-06-30. Completion date: 2005-07-15.
Top industries in this zip code by the number of employees in 2005:
Administrative and Support and Waste Management and Remediation Services: Janitorial Services (over 1000 employees: 1 establishment, 5-9 employees: 2 establishments, 1-4 employees: 1 establishment)
Health Care and Social Assistance: Home Health Care Services (500-999: 1, 20-49: 1, 5-9: 1)
Health Care and Social Assistance: Nursing Care Facilities (100-249: 2, 50-99: 3, 20-49: 1)
2005 - 2018 National Fire Incident Reporting System (NFIRS) incidents
Based on the data from the years 2005 - 2018 the average number of fire incidents per year is 51. The highest number of reported fires - 104 took place in 2006, and the least - 0 in 2013. The data has a decreasing trend.
When looking into fire subcategories, the most reports belonged to: Outside Fires (40.3%), and Structure Fires (36.4%).
Fire incident types reported to NFIRS in Zip Code 90804


 Nearest zip codes: 90814, 90755, 90822, 90803, 90815, 90806.


 Based on the data from the years 2005 - 2018 the average number of fire incidents per year is 51. The highest number of reported fires - 104 took place in 2006, and the least - 0 in 2013. The data has a decreasing trend.
 When looking into fire subcategories, the most reports belonged to: Outside Fires (40.3%), and Structure Fires (36.4%).