Estimated zip code population in 2022: 31,396 Zip code population in 2010: 32,031 Zip code population in 2000: 31,349
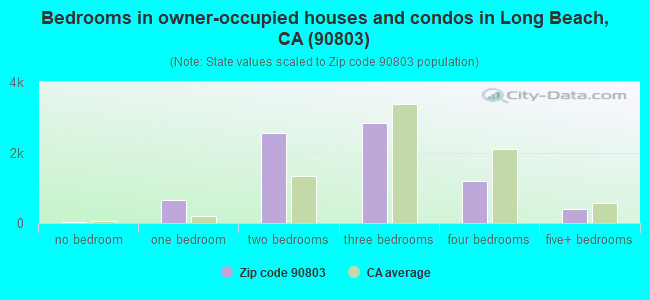
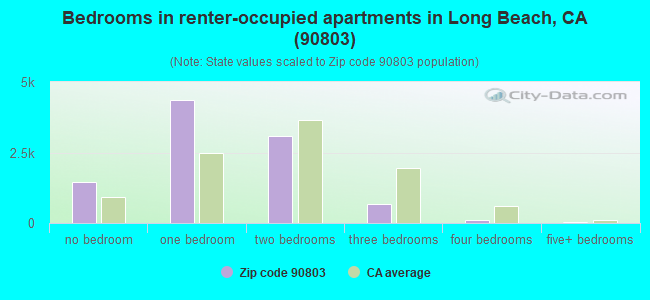
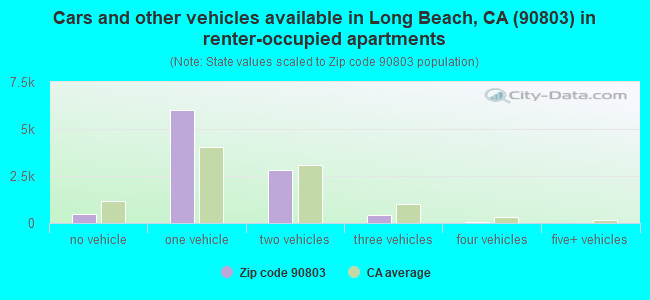
Houses and condos: 18,625 Renter-occupied apartments: 9,706
% of renters here:
56%
State:
44%
March 2022 cost of living index in zip code 90803: 138.9 (high, U.S. average is 100)
Land area: 4.0 sq. mi. Water area: 4.2 sq. mi.
Population density: 7,850 people per square mile
(high).
OSM Map
General Map
Google Map
MSN Map
OSM Map
General Map
Google Map
MSN Map
OSM Map
General Map
Google Map
MSN Map
OSM Map
General Map
Google Map
MSN Map
Please wait while loading the map...
Real estate property taxes paid for housing units in 2022:
This zip code:
0.6% ($7,739)
California:
0.7% ($4,831)
Median real estate property taxes paid for housing units with mortgages in 2022: $8,960 (0.7%) Median real estate property taxes paid for housing units with no mortgage in 2022: $6,290 (0.6%)
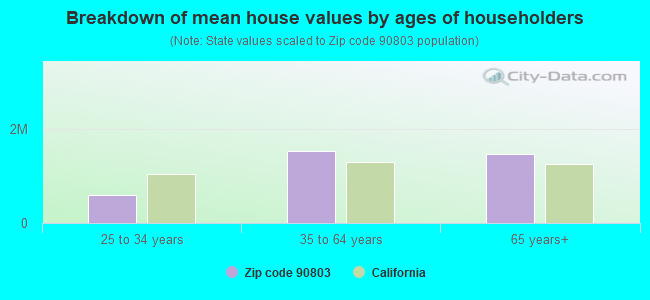
Estimated median house/condo value in 2022: $1,197,040
90803:
$1,197,040
California:
$715,900
According to our research of California and other state lists, there were 19 registered sex offenders living in 90803 zip code as of April 27, 2024. The ratio of all residents to sex offenders in zip code 90803 is 1,691 to 1. The ratio of registered sex offenders to all residents in this zip code is lower than the state average.
Median resident age:
This zip code:
47.3 years
California median age:
37.9 years
Average household size:
This zip code:
1.8 people
California:
2.8 people
Averages for the 2020 tax year for zip code 90803, filed in 2021:
Average Adjusted Gross Income (AGI) in 2020: $131,249 (Individual Income Tax Returns)
Here:
$131,249
State:
$95,910
Salary/wage: $98,689 (reported on 74.2% of returns)
Here:
$98,689
State:
$77,331
(% of AGI for various income ranges: 1090.9% for AGIs below $25k, 4054.8% for AGIs $25k-50k, 7149.6% for AGIs $50k-75k, 10806.2% for AGIs $75k-100k, 19473.5% for AGIs $100k-200k, 101284.9% for AGIs over 200k)
Taxable interest for individuals: $3,230 (reported on 47.4% of returns)
This zip code:
$3,230
California:
$2,294
(% of AGI for various income ranges: 37.7% for AGIs below $25k, 69.2% for AGIs $25k-50k, 77.1% for AGIs $50k-75k, 134.4% for AGIs $75k-100k, 295.2% for AGIs $100k-200k, 2830.3% for AGIs over 200k)
Ordinary dividends: $11,637 (reported on 35.1% of returns)
Here:
$11,637
State:
$10,949
(% of AGI for various income ranges: 90.8% for AGIs below $25k, 120.2% for AGIs $25k-50k, 173.2% for AGIs $50k-75k, 270.7% for AGIs $75k-100k, 770.0% for AGIs $100k-200k, 8088.5% for AGIs over 200k)
Net capital gain/loss in AGI: +$45,595 (reported on 34.7% of returns)
Here:
+$45,595
State:
+$49,306
(% of AGI for various income ranges: 44.9% for AGIs below $25k, 86.6% for AGIs $25k-50k, 153.3% for AGIs $50k-75k, 302.1% for AGIs $75k-100k, 997.9% for AGIs $100k-200k, 42320.8% for AGIs over 200k)
Profit/loss from business: +$20,532 (reported on 21.9% of returns)
Here:
+$20,532
State:
+$15,671
(% of AGI for various income ranges: 219.3% for AGIs below $25k, 293.5% for AGIs $25k-50k, 386.9% for AGIs $50k-75k, 465.2% for AGIs $75k-100k, 983.2% for AGIs $100k-200k, 6730.7% for AGIs over 200k)
Taxable individual retirement arrangement distribution: $29,213 (reported on 11.5% of returns)
90803:
$29,213
California:
$23,505
(% of AGI for various income ranges: 67.8% for AGIs below $25k, 156.5% for AGIs $25k-50k, 273.1% for AGIs $50k-75k, 395.1% for AGIs $75k-100k, 1137.5% for AGIs $100k-200k, 4349.5% for AGIs over 200k)
Self-employed (Keogh) retirement plans: $30,929 (reported on 1.9% of returns)
90803:
$30,929
California:
$30,163
(% of AGI for various income ranges: 22.7% for AGIs $25k-50k, 31.0% for AGIs $75k-100k, 113.4% for AGIs $100k-200k, 1257.2% for AGIs over 200k)
Total itemized deductions: $38,000 (reported on 23.8% of returns)
Here:
$38,000
State:
$39,517
(% of AGI for various income ranges: 217.6% for AGIs below $25k, 362.4% for AGIs $25k-50k, 592.5% for AGIs $50k-75k, 1083.8% for AGIs $75k-100k, 2522.2% for AGIs $100k-200k, 13615.1% for AGIs over 200k)
Charity contributions: $10,153 (reported on 20.7% of returns)
Here:
$10,153
State:
$12,598
(% of AGI for various income ranges: 13.6% for AGIs below $25k, 41.1% for AGIs $25k-50k, 65.4% for AGIs $50k-75k, 142.1% for AGIs $75k-100k, 380.0% for AGIs $100k-200k, 4430.0% for AGIs over 200k)
Taxes paid: $9,070 (reported on 23.8% of returns)
90803:
$9,070
State:
$8,807
(% of AGI for various income ranges: 49.5% for AGIs below $25k, 81.1% for AGIs $25k-50k, 150.1% for AGIs $50k-75k, 308.5% for AGIs $75k-100k, 776.1% for AGIs $100k-200k, 2619.2% for AGIs over 200k)
Earned income credit: $1,016 (reported on 5.9% of returns)
Here:
$1,016
State:
$2,074
(% of AGI for various income ranges: 36.1% for AGIs below $25k, 18.9% for AGIs $25k-50k)
Percentage of individuals using paid preparers for their 2020 taxes: 93.3%
Here:
93%
State:
92%
(% for various income ranges: 90.5% for AGIs below $25k, 92.7% for AGIs $25k-50k, 93.5% for AGIs $50k-75k, 94.0% for AGIs $75k-100k, 94.6% for AGIs $100k-200k, 95.4% for AGIs over 200k)
Averages for the 2012 tax year for zip code 90803, filed in 2013:
Average Adjusted Gross Income (AGI) in 2012: $103,502 (Individual Income Tax Returns)
Here:
$103,502
State:
$72,726
Salary/wage: $80,984 (reported on 77.5% of returns)
Here:
$80,984
State:
$59,079
(% of AGI for various income ranges: 66.6% for AGIs below $25k, 76.0% for AGIs $25k-50k, 77.6% for AGIs $50k-75k, 73.2% for AGIs $75k-100k, 67.6% for AGIs $100k-200k, 48.3% for AGIs over 200k)
Taxable interest for individuals: $3,130 (reported on 47.3% of returns)
This zip code:
$3,130
California:
$2,146
(% of AGI for various income ranges: 1.7% for AGIs below $25k, 1.0% for AGIs $25k-50k, 0.9% for AGIs $50k-75k, 1.0% for AGIs $75k-100k, 1.0% for AGIs $100k-200k, 1.9% for AGIs over 200k)
Ordinary dividends: $14,221 (reported on 31.4% of returns)
Here:
$14,221
State:
$9,308
(% of AGI for various income ranges: 3.7% for AGIs below $25k, 1.9% for AGIs $25k-50k, 1.6% for AGIs $50k-75k, 2.0% for AGIs $75k-100k, 2.2% for AGIs $100k-200k, 6.8% for AGIs over 200k)
Net capital gain/loss in AGI: +$21,761 (reported on 29.1% of returns)
Here:
+$21,761
State:
+$30,460
(% of AGI for various income ranges: 0.3% for AGIs $25k-50k, 0.4% for AGIs $50k-75k, 0.6% for AGIs $75k-100k, 1.7% for AGIs $100k-200k, 12.0% for AGIs over 200k)
Profit/loss from business: +$21,091 (reported on 21.0% of returns)
Here:
+$21,091
State:
+$17,064
(% of AGI for various income ranges: 14.5% for AGIs below $25k, 6.2% for AGIs $25k-50k, 3.8% for AGIs $50k-75k, 4.0% for AGIs $75k-100k, 3.7% for AGIs $100k-200k, 3.8% for AGIs over 200k)
Taxable individual retirement arrangement distribution: $26,987 (reported on 12.7% of returns)
90803:
$26,987
California:
$19,557
(% of AGI for various income ranges: 3.9% for AGIs below $25k, 3.8% for AGIs $25k-50k, 2.5% for AGIs $50k-75k, 4.0% for AGIs $75k-100k, 3.8% for AGIs $100k-200k, 3.0% for AGIs over 200k)
Self-employment retirement plans: $27,703 (reported on 2.0% of returns)
90803:
$27,703
California:
$24,530
(% of AGI for various income ranges: 0.3% for AGIs $25k-50k, 0.2% for AGIs $50k-75k, 0.3% for AGIs $75k-100k, 0.3% for AGIs $100k-200k, 0.8% for AGIs over 200k)
Total itemized deductions: $37,542 (22% of AGI, reported on 49.3% of returns)
Here:
$37,542
State:
$34,004
Here:
22.1% of AGI
State:
22.7% of AGI
(% of AGI for various income ranges: 17.4% for AGIs below $25k, 12.6% for AGIs $25k-50k, 14.4% for AGIs $50k-75k, 18.1% for AGIs $75k-100k, 20.5% for AGIs $100k-200k, 18.1% for AGIs over 200k)
Charity contributions: $5,036 (reported on 42.7% of returns)
Here:
$5,036
State:
$4,659
(% of AGI for various income ranges: 1.0% for AGIs below $25k, 1.1% for AGIs $25k-50k, 1.4% for AGIs $50k-75k, 1.7% for AGIs $75k-100k, 2.1% for AGIs $100k-200k, 2.5% for AGIs over 200k)
Taxes paid: $17,295 (reported on 49.2% of returns)
90803:
$17,295
State:
$14,448
(% of AGI for various income ranges: 3.8% for AGIs below $25k, 2.9% for AGIs $25k-50k, 4.0% for AGIs $50k-75k, 6.6% for AGIs $75k-100k, 8.5% for AGIs $100k-200k, 10.4% for AGIs over 200k)
Earned income credit: $1,164 (reported on 6.9% of returns)
Here:
$1,164
State:
$2,286
(% of AGI for various income ranges: 2.1% for AGIs below $25k, 0.2% for AGIs $25k-50k)
Percentage of individuals using paid preparers for their 2012 taxes: 64.7%
Here:
65%
State:
64%
(% for various income ranges: 57.3% for AGIs below $25k, 56.4% for AGIs $25k-50k, 61.2% for AGIs $50k-75k, 66.2% for AGIs $75k-100k, 75.1% for AGIs $100k-200k, 84.9% for AGIs over 200k)
Averages for the 2004 tax year for zip code 90803, filed in 2005:
Average Adjusted Gross Income (AGI) in 2004: $86,677 (Individual Income Tax Returns)
Here:
$86,677
State:
$58,600
Salary/wage: $70,116 (reported on 78.5% of returns)
Here:
$70,116
State:
$49,455
(% of AGI for various income ranges: 69.6% for AGIs $10k-25k, 80.9% for AGIs $25k-50k, 79.7% for AGIs $50k-75k, 75.8% for AGIs $75k-100k, 54.0% for AGIs over 100k)
Taxable interest for individuals: $4,176 (reported on 58.0% of returns)
This zip code:
$4,176
California:
$2,365
(% of AGI for various income ranges: 3.4% for AGIs $10k-25k, 1.7% for AGIs $25k-50k, 1.7% for AGIs $50k-75k, 1.6% for AGIs $75k-100k, 3.1% for AGIs over 100k)
Taxable dividends: $5,051 (reported on 36.7% of returns)
Here:
$5,051
State:
$4,746
(% of AGI for various income ranges: 3.2% for AGIs $10k-25k, 1.6% for AGIs $25k-50k, 1.5% for AGIs $50k-75k, 1.6% for AGIs $75k-100k, 2.2% for AGIs over 100k)
Net capital gain/loss: +$21,607 (reported on 33.5% of returns)
Here:
+$21,607
State:
+$23,418
(% of AGI for various income ranges: -0.1% for AGIs $10k-25k, 1.4% for AGIs $25k-50k, 0.9% for AGIs $50k-75k, 1.8% for AGIs $75k-100k, 12.0% for AGIs over 100k)
Profit/loss from business: +$21,462 (reported on 20.5% of returns)
Here:
+$21,462
State:
+$16,826
(% of AGI for various income ranges: 10.6% for AGIs $10k-25k, 4.8% for AGIs $25k-50k, 4.2% for AGIs $50k-75k, 4.3% for AGIs $75k-100k, 5.1% for AGIs over 100k)
Profit/loss from farming: +$2,571 (reported on 0.1% of returns)
Here:
+$2,571
State:
-$7,562
IRA payment deduction: $3,089 (reported on 3.4% of returns)
90803:
$3,089
California:
$3,192
(% of AGI for various income ranges: 0.3% for AGIs $10k-25k, 0.3% for AGIs $25k-50k, 0.2% for AGIs $50k-75k, 0.2% for AGIs $75k-100k, 0.1% for AGIs over 100k)
Self-employed pension: $18,218 (reported on 3.0% of returns)
Here:
$18,218
California:
$17,688
(% of AGI for various income ranges: 0.3% for AGIs $10k-25k, 0.3% for AGIs $25k-50k, 0.3% for AGIs $50k-75k, 0.5% for AGIs $75k-100k, 0.8% for AGIs over 100k)
Total itemized deductions: $31,830 (22% of AGI, reported on 50.7% of returns)
Here:
$31,830
State:
$28,113
Here:
22.2% of AGI
State:
25.3% of AGI
(% of AGI for various income ranges: 19.0% for AGIs $10k-25k, 14.3% for AGIs $25k-50k, 18.4% for AGIs $50k-75k, 21.0% for AGIs $75k-100k, 18.4% for AGIs over 100k)
Charity contributions deductions: $4,143 (3% of AGI, reported on 46.4% of returns)
Here:
$4,143
State:
$3,923
Here:
2.8% of AGI
State:
3.3% of AGI
(% of AGI for various income ranges: 1.7% for AGIs $10k-25k, 1.7% for AGIs $25k-50k, 2.3% for AGIs $50k-75k, 2.2% for AGIs $75k-100k, 2.3% for AGIs over 100k)
Total tax: $17,202 (reported on 87.8% of returns)
90803:
$17,202
State:
$10,761
(% of AGI for various income ranges: 6.0% for AGIs $10k-25k, 9.7% for AGIs $25k-50k, 12.2% for AGIs $50k-75k, 12.9% for AGIs $75k-100k, 20.5% for AGIs over 100k)
Earned income credit: $857 (reported on 5.1% of returns)
Here:
$857
State:
$1,763
Percentage of individuals using paid preparers for their 2004 taxes: 66.7%
Here:
67%
State:
66%
(% for various income ranges: 59.7% for AGIs below $10k, 59.4% for AGIs $10k-25k, 59.2% for AGIs $25k-50k, 67.5% for AGIs $50k-75k, 72.8% for AGIs $75k-100k, 80.5% for AGIs over 100k)
Likely homosexual households (counted as self-reported same-sex unmarried-partner households)
Lesbian couples: 0.3% of all households
Gay men: 0.8% of all households
Household received Food Stamps/SNAP in the past 12 months: 513 Household did not receive Food Stamps/SNAP in the past 12 months: 16,507
Women who had a birth in the past 12 months: 271 (170 now married, 101 unmarried) Women who did not have a birth in the past 12 months: 6,625 (2,031 now married, 4,619 unmarried)
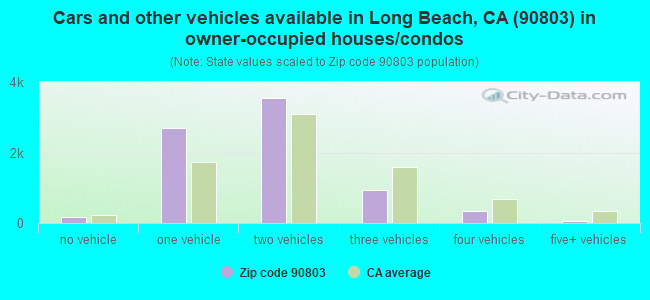
Housing units in zip code 90803 with a mortgage: 4,979 (540 second mortgage, 20 home equity loan, 407 both second mortgage and home equity loan) Houses without a mortgage: 39
Median monthly owner costs for units with a mortgage: $3,634 Median monthly owner costs for units without a mortgage: $1,157
Residents with income below the poverty level in 2022:
This zip code:
6.6%
Whole state:
12.2%
Residents with income below 50% of the poverty level in 2022:
This zip code:
2.5%
Whole state:
6.2%
Median number of rooms in houses and condos:
Here:
6.0
State:
6.0
Median number of rooms in apartments:
Here:
3.5
State:
3.9
Notable locations in this zip code not listed on our city pages
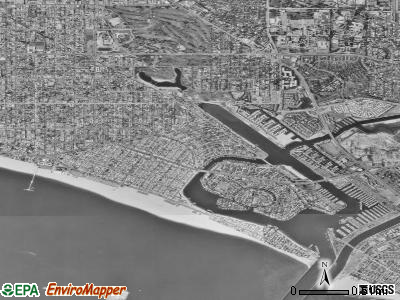
Notable locations in zip code 90803: Belmont Pier (A), Long Beach Marina (B), Seaside Village (C), Marina Pacifica (D), Long Beach Yacht Club (E), Bixby Village Golf Course (F), Alamitos Bay Yacht Club (G), Bay Shore Community Center (H), Bay Shore Branch Long Beach Public Library (I), Long Beach Museum of Art (J), Alamitos Generating Station (K), City of Long Beach Fire Department Station 21 (L), City of Long Beach Fire Department Station 14 (M), City of Long Beach Fire Department Station 8 (N). Display/hide their locations on the map
Churches in zip code 90803 include: Temple Israel (A), Bay Shore Community Church (B), Saint Bartholomews Roman Catholic Church (C), Fifth Church of Christ Scientist (D), Gloria Dei Lutheran Church (E). Display/hide their locations on the map
Parks in zip code 90803 include: Bluff Park (1), Long Beach City Beach (2), Marine Park (3), Marine Vista Park (4), Naples Plaza (5), Channel View Park (6), Bayshore Aquatic Playground Park (7), Alamitos Bay State Park (8). Display/hide their locations on the map
1,986 married couples with children.
1,051 single-parent households (298 men, 753 women).
82.3% of residents of 90803 zip code speak English at home.
9.0% of residents speak Spanish at home (81% very well, 16% well, 2% not well).
2.7% of residents speak other Indo-European language at home (76% very well, 13% well, 11% not well).
5.0% of residents speak Asian or Pacific Island language at home (81% very well, 18% well, 1% not at all).
0.7% of residents speak other language at home (77% very well, 12% well, 11% not well).
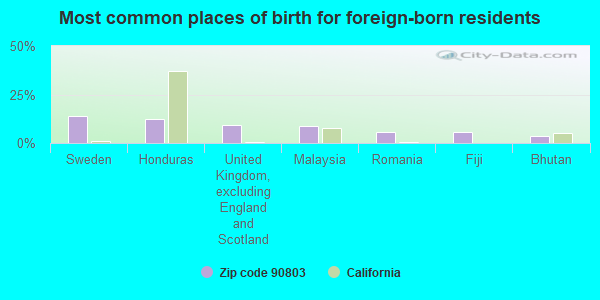
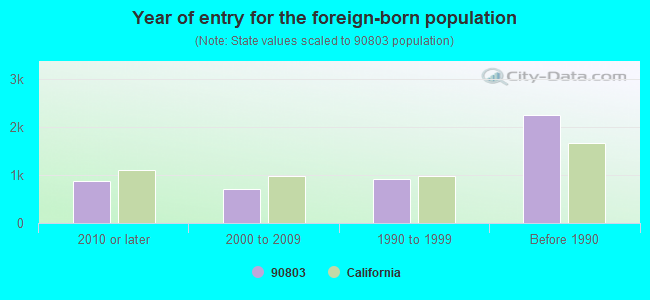
Foreign born population: 4,415 (14.1%) (67.2% of them are naturalized citizens)
Major facilities with environmental interests located in this zip code:
AES ALAMITOS L L C (690 NORTH STUDEBAKER ROAD in LONG BEACH, CA)
AIR MAJOR (AIRS/AFS) AIR PROGRAM (Clean Air Markets Division Business System) OIL CONTROL (Facility Response Plan for oil discharge) STATE MASTER (California - Hazardous Waste Tracking) - HAZARDOU WASTE PROGRAM CRITERIA AND HAZARDOUS AIR POLLUTANT INVENTORY (Inventory of air pollution sources) National Pollutant Discharge Elimination System MAJOR (Tracking pollutant discharge elimination systems) - permit HAZARDOUS WASTE BIENNIAL REPORTER (Resource Conservation and Recovery Act (tracking hazardous waste)) Small Quantity Generators, between 100 kg and 1000 kg of hazardous waste/month (Resource Conservation and Recovery Act (tracking hazardous waste)) - notification Small Quantity Generators, between 100 kg and 1000 kg of hazardous waste/month (Resource Conservation and Recovery Act (tracking hazardous waste)) Business SIC classification: ELECTRIC SERVICES Business NAICS classification: FOSSIL FUEL ELECTRIC POWER GENERATION. Organizations: PACIFIC TERMINALS LLC (CONTACT/GENERAL)
, AES ALAMITOS LLC (CONTACT/OPERATOR)
, AES ALAMITOS, LLC (CONTACT/OWNER)
, SO CALIFORNIA EDISON EPTC (CONTACT/OWNER)
, AES ALAMITOS LLC (CONTACT/OWNER)
, AES ALAMITOS, LLC (OWNER/OPERATOR)
Alternative names: AES ALAMITOS LLC, AES ALAMITOS STATION, LLC, ALAMITOS GENERATING STATION , ALAMITOS TANK FARM , EPTC ALAMITOS, SCE-ALAMITOS
FOASBERG LAUNDRY AND CLEANERS INCORPORATED (3337 EAST BROADWAY in LONG BEACH, CA)
STATE MASTER (California - Hazardous Waste Tracking) - HAZARDOU WASTE PROGRAM CRITERIA AND HAZARDOUS AIR POLLUTANT INVENTORY (Inventory of air pollution sources) Small Quantity Generators, between 100 kg and 1000 kg of hazardous waste/month (Resource Conservation and Recovery Act (tracking hazardous waste)) - ICIS-, ENFORCEMENT/COMPLIANCE ACTIVITY Business SIC classification: DRYCLEANING PLANTS, EXCEPT RUG CLEANING Alternative names: FOASBERG CLEANERS, FOASBERG LAUNDRY & CLEANERS IN
1 HR MOTO PHOTO (3870 E OCEAN BLVD in LONG BEACH, CA)
STATE MASTER (California - Hazardous Waste Tracking) - HAZARDOU WASTE PROGRAM Small Quantity Generators, between 100 kg and 1000 kg of hazardous waste/month (Resource Conservation and Recovery Act (tracking hazardous waste)) - notification Organizations: LIM DANIEL (CONTACT/OWNER)
FROMEX ONE HOUR PHOTO (5277 E 2ND ST in LONG BEACH, CA)
STATE MASTER (California - Hazardous Waste Tracking) - HAZARDOU WASTE PROGRAM Small Quantity Generators, between 100 kg and 1000 kg of hazardous waste/month (Resource Conservation and Recovery Act (tracking hazardous waste)) - notification Organizations: ALBRIGHT JOHN (CONTACT/OWNER)
Alternative names: FROMEX PHOTO LAB
INDEL DBA MARINA SHIPYARD (6400 MARINA DR in LONG BEACH, CA)
STATE MASTER (California - Hazardous Waste Tracking) - HAZARDOU WASTE PROGRAM Small Quantity Generators, between 100 kg and 1000 kg of hazardous waste/month (Resource Conservation and Recovery Act (tracking hazardous waste)) - notification Business NAICS classification: BOAT BUILDING. Organizations: INDEL ENGINEERING INC (CONTACT/OWNER)
LONG BEACH USD-LOWELL ELEMENTARY (5201 EAST BROADWAY in LONG BEACH, CA)
(National Center for Education Statistics) - STATE ID-6015473 Small Quantity Generators, between 100 kg and 1000 kg of hazardous waste/month (Resource Conservation and Recovery Act (tracking hazardous waste)) Organizations: LONG BEACH UNIFIED (SCHOOL DISTRICT)
LONG BEACH USD-MANN ELEMENTARY (257 CORONADO AVENUE in LONG BEACH, CA)
(National Center for Education Statistics) - STATE ID-6015507 Small Quantity Generators, between 100 kg and 1000 kg of hazardous waste/month (Resource Conservation and Recovery Act (tracking hazardous waste)) Organizations: LONG BEACH UNIFIED (SCHOOL DISTRICT)
LONG BEACH USD-NAPLES ELEMENTARY (5537 THE TOLEDO in LONG BEACH, CA)
(National Center for Education Statistics) - STATE ID-6015549 Small Quantity Generators, between 100 kg and 1000 kg of hazardous waste/month (Resource Conservation and Recovery Act (tracking hazardous waste)) Organizations: LONG BEACH UNIFIED (SCHOOL DISTRICT)
LONG BEACH USD-ROGERS JUNIOR HIGH (365 MONROVIA AVENUE in LONG BEACH, CA)
STATE MASTER (California - Hazardous Waste Tracking) - HAZARDOU WASTE PROGRAM Small Quantity Generators, between 100 kg and 1000 kg of hazardous waste/month (Resource Conservation and Recovery Act (tracking hazardous waste)) Alternative names: LBUSD-ROGERS JUNIOR HIGH
KETTERING ELEMENTARY (550 SILVERA AVE. in LONG BEACH, CA)
(National Center for Education Statistics) - STATE ID-6015408 Organizations: LONG BEACH UNIFIED (SCHOOL DISTRICT)
EDISON O AND M SERVICES (690 STUDEBAKER RD BLDG 2 in LONG BEACH, CA)
(Resource Conservation and Recovery Act (tracking hazardous waste)) Organizations: A E S ALAMITOS L L C (CONTACT/OWNER)
KROLLS CLEANERS (3632 E BROADWAY in LONG BEACH, CA)
Small Quantity Generators, between 100 kg and 1000 kg of hazardous waste/month (Resource Conservation and Recovery Act (tracking hazardous waste)) - notification Organizations: GLOBALFLIGHT CORP (CONTACT/OWNER)
LONG BEACH MAINT YARD CITY OF (205 MARINA DR. in LONG BEACH, CA)
(Resource Conservation and Recovery Act (tracking hazardous waste))
Housing units lacking complete kitchen facilities: 2.6%
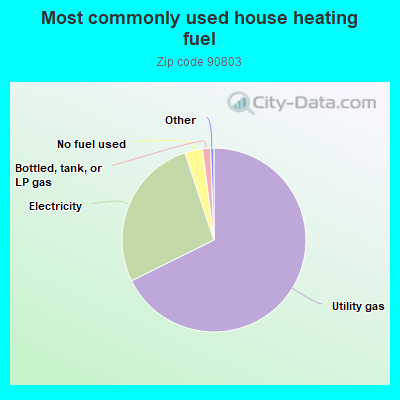
67.7%Utility gas
27.2%Electricity
3.1%No fuel used
1.4%Bottled, tank, or LP gas
Population in 1990: 32,492.
Place of birth for U.S.-born residents:
This state: 17,670
Northeast: 2,397
Midwest: 2,808
South: 2,224
West: 1,324
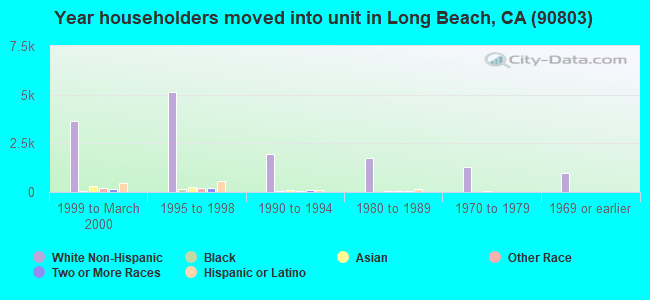
43% of the 90803 zip code residents lived in the same house 5 years ago. Out of people who lived in different houses, 57% lived in this county. Out of people who lived in different counties, 50% lived in California.
88% of the 90803 zip code residents lived in the same house 1 year ago. Out of people who lived in different houses, 48% moved from this county. Out of people who lived in different houses, 27% moved from different county within same state. Out of people who lived in different houses, 21% moved from different state. Out of people who lived in different houses, 4% moved from abroad.
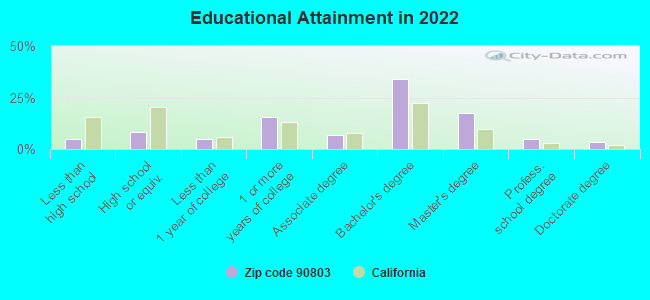
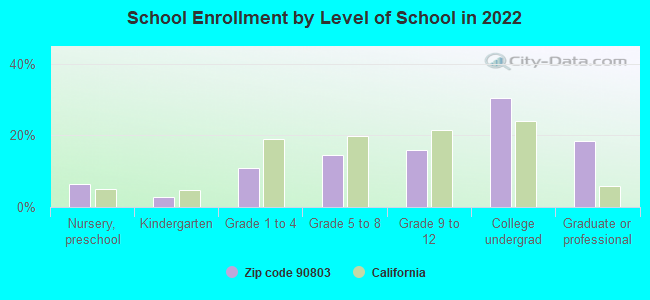
Private vs. public school enrollment:
Students in private schools in grades 1 to 8 (elementary and middle school): 131
Here:
11.3%
California:
10.5%
Students in private schools in grades 9 to 12 (high school): 115
Here:
16.1%
California:
8.5%
Students in private undergraduate colleges: 185
Here:
13.5%
California:
15.9%
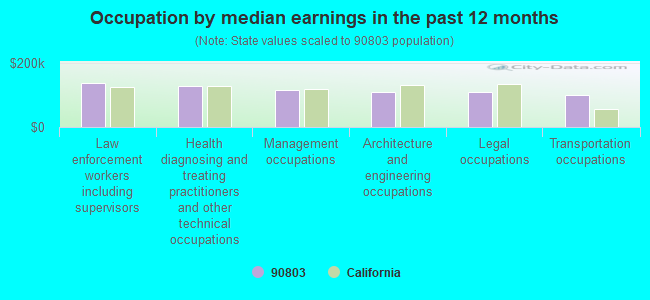
Occupation by median earnings in the past 12 months ($)
138,122Law enforcement workers including supervisors
127,528Health diagnosing and treating practitioners and other technical occupations
115,478Management occupations
109,638Architecture and engineering occupations
108,809Legal occupations
99,511Transportation occupations
Companies with federal contracts located in this zip code (LONG BEACH, CA):
EASTWIND RESEARCH CORPORATION (5770 EAST APPIAN WAY; small business) : $194,154 in 2 contractsfrom 1999 to 2001
$187,000 with Department of Defense for Other Defense -- Applied Research and Exploratory Development (R&D). Signed on 1999-12-20. Completion date: 2002-06-07.
$7,154 with Army for Other Research and Development -- Applied Research and Exploratory Development (R&D). Signed on 2001-11-26. Completion date: 2001-11-30.
COMMUNICATION & TRADING SERVIC (5310 MARINA PACIFICA DR N; small business) 50 employees, $0 revenue. : $103,650 in 10 contractsfrom 2001 to 2006
Contracts for Non-nuclear Ship Repair (West) Ship repair (including overhauls and conversions) performed on. non-nuclear propelled and nonpropelled ships west of the 108th meridian, Non-nuclear Ship Repair (East) Ship repair (including overhauls and conversions) performed on non-nuclear propelled and nonpropelled ships east of the 108th meridian by Navy Signed by year:2000: $0; 2001: $6,250; 2002: $0; 2003: $14,050; 2004: $29,670; 2005: $33,320; 2006: $20,360.
Biggest contracts:
$21,670 with Navy for Non-nuclear Ship Repair (West) Ship repair (including overhauls and conversions) performed on. non-nuclear propelled and nonpropelled ships west of the 108th meridian. Signed on 2004-11-21. Completion date: 2004-11-20.
$20,360, same as above.Signed on 2006-02-06. Completion date: 2006-03-23.
$14,400, same as above.Signed on 2005-05-17. Completion date: 2005-06-06.
$8,630 with Navy for Non-nuclear Ship Repair (East) Ship repair (including overhauls and conversions) performed on non-nuclear propelled and nonpropelled ships east of the 108th meridian. Taking place in VA. Signed on 2005-01-29. Completion date: 2005-04-03.
BW GOLDEN SAILS HOTEL (6285 E PACIFIC COAST HWY; small business) : $70,559 in 3 contractsfrom 2004 to 2005
$35,392 with Department of Veterans Affairs for Lodging - Hotel/Motel. Signed on 2004-02-24. Effective on 2004-02-28. Completion date: 2004-11-30.
$30,919, same as above.Signed on 2004-07-09. Completion date: 2004-11-30.
$4,248 with Navy for Lodging - Hotel/Motel. Signed on 2005-01-20. Completion date: 2005-01-23.
NETLINK, LTD (5318 E 2ND STREET; small business) : $36,080 in 3 contractsfrom 2003 to 2005
$27,725 with Navy for ADP Input/Output and Storage Devices. Signed on 2003-03-06. Completion date: 2003-04-20.
$4,440 with Navy for Miscellaneous Ship and Marine Equipment. Signed on 2005-07-07. Completion date: 2005-09-01.
$3,915 with Army for Radio and Television Communication Equipment, Except Airborne. Signed on 2003-03-19. Completion date: 2003-04-30.
CALIFORNIA LEAGUE OF MIDDLE SC (6615 EAST PACIFIC COAST HI)
$31,616 with Department of Defense for Lease or Rental of Facilities -- Conference Space and Facilities. Signed on 2001-10-17. Completion date: 2001-10-18.
PROMOTIONAL SOURCE (5030 E 2ND ST STE 206; small business) : $29,522 in 3 contractsfrom 2003 to 2005
$17,102 with Navy for Clothing, Special Purpose. Signed on 2003-11-24. Completion date: 2003-12-10.
$8,543, same as above.Signed on 2005-09-21. Completion date: 2005-09-23.
$3,877, same as above.Signed on 2005-08-09. Completion date: 2005-08-24.
PACIFIC SALES & MARKETING (5318 E 2ND ST 685; small business) : $26,890 in 2 contractsin 2005
$14,890 with Air Force for Gasoline Reciprocating Engines, Except Aircraft; and Components. Signed on 2005-01-06. Completion date: 2005-01-31.
$12,000 with Air Force for Maintenance, Repair and Rebuilding of Equipment -- Ground Effect Vehicles, Motor Vehicles, Trailers, and Cycles. Signed on 2005-06-23. Completion date: 2005-07-05.
PACIFIC TRANSWAY CORPORATION (6475 E PACIFIC COAST HWY; small business) : $21,650 in 5 contractsfrom 2003 to 2006
Contracts for Maintenance, Repair and Rebuilding of Equipment -- Miscellaneous, Industrial Assembly Machines by Navy Signed by year:2000: $0; 2001: $0; 2002: $0; 2003: $10,470; 2004: $5,290; 2005: $5,590; 2006: $300.
Biggest contracts:
$5,590 with Navy for Maintenance, Repair and Rebuilding of Equipment -- Miscellaneous. Signed on 2005-05-17. Completion date: 2004-06-30.
$5,590, same as above.Signed on 2003-06-24. Completion date: 2004-06-30.
$5,290, same as above.Signed on 2004-06-17. Completion date: 2004-06-30.
$4,880 with Navy for Industrial Assembly Machines. Signed on 2003-09-05. Completion date: 2003-09-12.
6400 CORPORATION (6400 E PACIFIC COAST HWY; small business) : $6,270 in 3 contractsin 2004
$3,025 with Navy for Lodging - Hotel/Motel. Signed on 2004-12-09. Completion date: 2004-12-12.
$2,695, same as above.Signed on 2004-09-17. Completion date: 2004-09-19.
$550, same as above.Signed on 2004-12-13. Completion date: 2004-12-12.
Top industries in this zip code by the number of employees in 2005:
2005 - 2018 National Fire Incident Reporting System (NFIRS) incidents
Based on the data from the years 2005 - 2018 the average number of fire incidents per year is 47. The highest number of reported fires - 94 took place in 2005, and the least - 0 in 2013. The data has a decreasing trend.
When looking into fire subcategories, the most reports belonged to: Structure Fires (38.9%), and Outside Fires (34.0%).
Fire incident types reported to NFIRS in Zip Code 90803


+$2,571
-$7,562
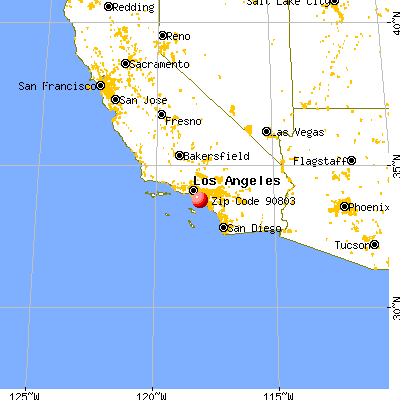
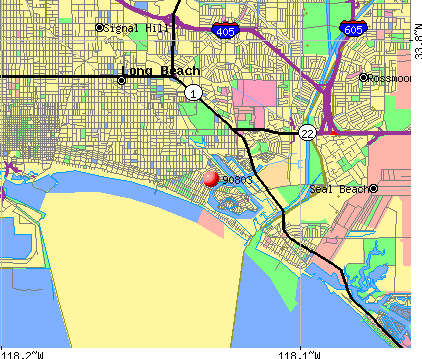 Nearest zip codes: 90814, 90822, 90804, 90815, 90743, 90740.


 Based on the data from the years 2005 - 2018 the average number of fire incidents per year is 47. The highest number of reported fires - 94 took place in 2005, and the least - 0 in 2013. The data has a decreasing trend.
 When looking into fire subcategories, the most reports belonged to: Structure Fires (38.9%), and Outside Fires (34.0%).