Estimated zip code population in 2022: 40,350 Zip code population in 2010: 42,399 Zip code population in 2000: 49,641
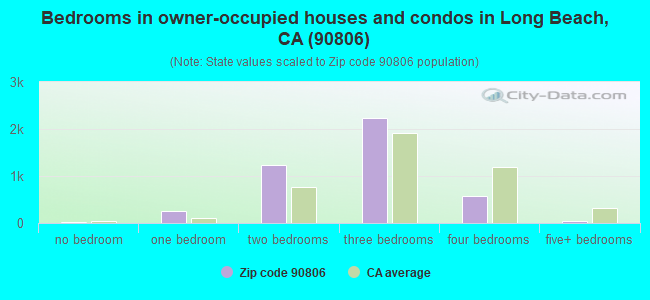
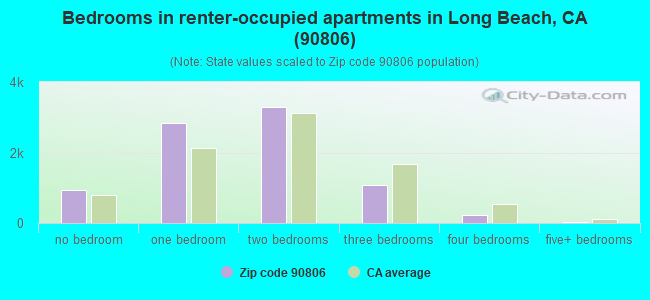
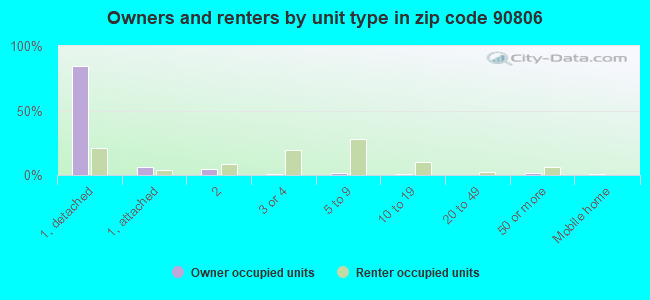
Houses and condos: 13,328 Renter-occupied apartments: 8,364
% of renters here:
66%
State:
44%
March 2022 cost of living index in zip code 90806: 136.0 (high, U.S. average is 100)
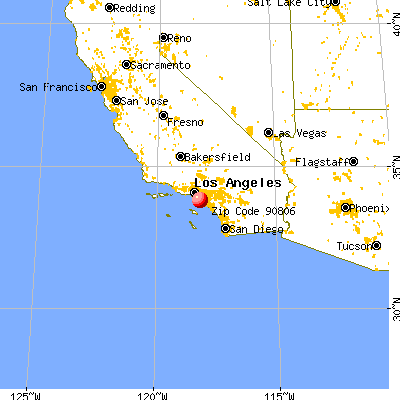
Land area: 3.4 sq. mi. Water area: 0.1 sq. mi.
Population density: 11,716 people per square mile
(high).
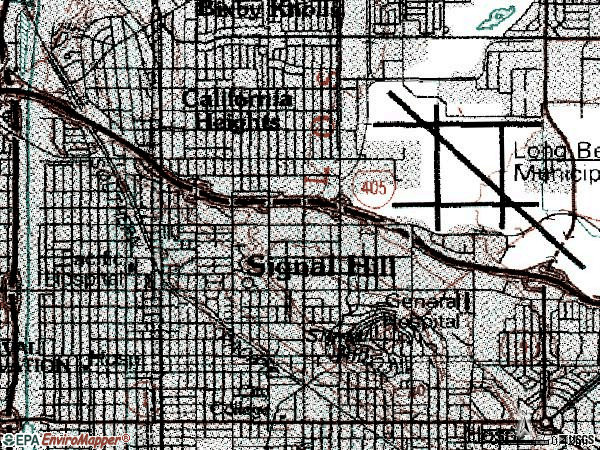
OSM Map
General Map
Google Map
MSN Map
OSM Map
General Map
Google Map
MSN Map
OSM Map
General Map
Google Map
MSN Map
OSM Map
General Map
Google Map
MSN Map
Please wait while loading the map...
Real estate property taxes paid for housing units in 2022:
This zip code:
0.6% ($4,252)
California:
0.7% ($4,831)
Median real estate property taxes paid for housing units with mortgages in 2022: $4,750 (0.7%) Median real estate property taxes paid for housing units with no mortgage in 2022: $2,626 (0.4%)
Averages for the 2020 tax year for zip code 90806, filed in 2021:
Average Adjusted Gross Income (AGI) in 2020: $46,555 (Individual Income Tax Returns)
Here:
$46,555
State:
$95,910
Salary/wage: $44,042 (reported on 84.0% of returns)
Here:
$44,042
State:
$77,331
(% of AGI for various income ranges: 1251.8% for AGIs below $25k, 4038.2% for AGIs $25k-50k, 7611.2% for AGIs $50k-75k, 11330.5% for AGIs $75k-100k, 21032.2% for AGIs $100k-200k, 64381.1% for AGIs over 200k)
Taxable interest for individuals: $604 (reported on 19.8% of returns)
This zip code:
$604
California:
$2,294
(% of AGI for various income ranges: 4.5% for AGIs below $25k, 6.8% for AGIs $25k-50k, 18.7% for AGIs $50k-75k, 46.0% for AGIs $75k-100k, 68.5% for AGIs $100k-200k, 526.7% for AGIs over 200k)
Ordinary dividends: $1,681 (reported on 6.5% of returns)
Here:
$1,681
State:
$10,949
(% of AGI for various income ranges: 3.4% for AGIs below $25k, 5.8% for AGIs $25k-50k, 17.7% for AGIs $50k-75k, 20.1% for AGIs $75k-100k, 88.3% for AGIs $100k-200k, 498.9% for AGIs over 200k)
Net capital gain/loss in AGI: +$7,014 (reported on 7.8% of returns)
Here:
+$7,014
State:
+$49,306
(% of AGI for various income ranges: 0.7% for AGIs below $25k, 3.2% for AGIs $25k-50k, 28.3% for AGIs $50k-75k, 43.7% for AGIs $75k-100k, 306.2% for AGIs $100k-200k, 7742.2% for AGIs over 200k)
Profit/loss from business: +$6,899 (reported on 19.0% of returns)
Here:
+$6,899
State:
+$15,671
(% of AGI for various income ranges: 205.6% for AGIs below $25k, 121.8% for AGIs $25k-50k, 172.6% for AGIs $50k-75k, 187.1% for AGIs $75k-100k, 284.3% for AGIs $100k-200k, 2566.7% for AGIs over 200k)
Taxable individual retirement arrangement distribution: $15,302 (reported on 2.4% of returns)
90806:
$15,302
California:
$23,505
(% of AGI for various income ranges: 15.8% for AGIs below $25k, 31.0% for AGIs $25k-50k, 59.8% for AGIs $50k-75k, 121.3% for AGIs $75k-100k, 317.3% for AGIs $100k-200k)
Total itemized deductions: $28,106 (reported on 10.2% of returns)
Here:
$28,106
State:
$39,517
(% of AGI for various income ranges: 44.6% for AGIs below $25k, 134.2% for AGIs $25k-50k, 558.7% for AGIs $50k-75k, 1021.0% for AGIs $75k-100k, 2471.4% for AGIs $100k-200k, 8150.0% for AGIs over 200k)
Charity contributions: $5,351 (reported on 8.4% of returns)
Here:
$5,351
State:
$12,598
(% of AGI for various income ranges: 3.8% for AGIs below $25k, 19.7% for AGIs $25k-50k, 87.8% for AGIs $50k-75k, 145.7% for AGIs $75k-100k, 407.0% for AGIs $100k-200k, 1463.3% for AGIs over 200k)
Taxes paid: $8,178 (reported on 10.2% of returns)
90806:
$8,178
State:
$8,807
(% of AGI for various income ranges: 10.5% for AGIs below $25k, 33.9% for AGIs $25k-50k, 157.0% for AGIs $50k-75k, 313.9% for AGIs $75k-100k, 791.9% for AGIs $100k-200k, 2034.4% for AGIs over 200k)
Earned income credit: $2,240 (reported on 23.2% of returns)
Here:
$2,240
State:
$2,074
(% of AGI for various income ranges: 124.3% for AGIs below $25k, 82.9% for AGIs $25k-50k, 0.9% for AGIs $50k-75k)
Percentage of individuals using paid preparers for their 2020 taxes: 91.9%
Here:
92%
State:
92%
(% for various income ranges: 91.3% for AGIs below $25k, 92.4% for AGIs $25k-50k, 90.7% for AGIs $50k-75k, 92.2% for AGIs $75k-100k, 93.7% for AGIs $100k-200k, 96.4% for AGIs over 200k)
Averages for the 2012 tax year for zip code 90806, filed in 2013:
Average Adjusted Gross Income (AGI) in 2012: $35,245 (Individual Income Tax Returns)
Here:
$35,245
State:
$72,726
Salary/wage: $35,023 (reported on 84.6% of returns)
Here:
$35,023
State:
$59,079
(% of AGI for various income ranges: 76.6% for AGIs below $25k, 89.6% for AGIs $25k-50k, 88.2% for AGIs $50k-75k, 87.2% for AGIs $75k-100k, 86.0% for AGIs $100k-200k, 58.9% for AGIs over 200k)
Taxable interest for individuals: $544 (reported on 18.2% of returns)
This zip code:
$544
California:
$2,146
(% of AGI for various income ranges: 0.2% for AGIs below $25k, 0.1% for AGIs $25k-50k, 0.3% for AGIs $50k-75k, 0.2% for AGIs $75k-100k, 0.3% for AGIs $100k-200k, 1.4% for AGIs over 200k)
Ordinary dividends: $2,200 (reported on 4.7% of returns)
Here:
$2,200
State:
$9,308
(% of AGI for various income ranges: 0.1% for AGIs below $25k, 0.1% for AGIs $25k-50k, 0.2% for AGIs $50k-75k, 0.2% for AGIs $75k-100k, 0.5% for AGIs $100k-200k, 1.4% for AGIs over 200k)
Net capital gain/loss in AGI: +$623 (reported on 3.9% of returns)
Here:
+$623
State:
+$30,460
(% of AGI for various income ranges: 0.2% for AGIs $75k-100k, 0.3% for AGIs $100k-200k, 0.3% for AGIs over 200k)
Profit/loss from business: +$8,899 (reported on 19.8% of returns)
Here:
+$8,899
State:
+$17,064
(% of AGI for various income ranges: 16.7% for AGIs below $25k, 2.8% for AGIs $25k-50k, 1.6% for AGIs $50k-75k, 1.5% for AGIs $75k-100k, 2.5% for AGIs $100k-200k)
Taxable individual retirement arrangement distribution: $14,269 (reported on 2.5% of returns)
90806:
$14,269
California:
$19,557
(% of AGI for various income ranges: 0.5% for AGIs below $25k, 0.7% for AGIs $25k-50k, 0.9% for AGIs $50k-75k, 1.0% for AGIs $75k-100k, 2.5% for AGIs $100k-200k)
Self-employment retirement plans: $8,450 (reported on 0.1% of returns)
90806:
$8,450
California:
$24,530
Total itemized deductions: $22,510 (30% of AGI, reported on 23.1% of returns)
Here:
$22,510
State:
$34,004
Here:
29.8% of AGI
State:
22.7% of AGI
(% of AGI for various income ranges: 4.7% for AGIs below $25k, 11.0% for AGIs $25k-50k, 18.7% for AGIs $50k-75k, 21.1% for AGIs $75k-100k, 21.4% for AGIs $100k-200k, 19.9% for AGIs over 200k)
Charity contributions: $2,883 (reported on 19.2% of returns)
Here:
$2,883
State:
$4,659
(% of AGI for various income ranges: 0.3% for AGIs below $25k, 1.3% for AGIs $25k-50k, 2.2% for AGIs $50k-75k, 2.1% for AGIs $75k-100k, 2.3% for AGIs $100k-200k, 1.9% for AGIs over 200k)
Taxes paid: $6,611 (reported on 23.0% of returns)
90806:
$6,611
State:
$14,448
(% of AGI for various income ranges: 0.7% for AGIs below $25k, 2.3% for AGIs $25k-50k, 4.7% for AGIs $50k-75k, 6.4% for AGIs $75k-100k, 7.7% for AGIs $100k-200k, 9.8% for AGIs over 200k)
Earned income credit: $2,580 (reported on 33.5% of returns)
Here:
$2,580
State:
$2,286
(% of AGI for various income ranges: 10.3% for AGIs below $25k, 1.6% for AGIs $25k-50k)
Percentage of individuals using paid preparers for their 2012 taxes: 72.2%
Here:
72%
State:
64%
(% for various income ranges: 70.6% for AGIs below $25k, 74.1% for AGIs $25k-50k, 74.4% for AGIs $50k-75k, 71.6% for AGIs $75k-100k, 73.9% for AGIs $100k-200k, 90.0% for AGIs over 200k)
Averages for the 2004 tax year for zip code 90806, filed in 2005:
Average Adjusted Gross Income (AGI) in 2004: $31,091 (Individual Income Tax Returns)
Here:
$31,091
State:
$58,600
Salary/wage: $30,525 (reported on 89.0% of returns)
Here:
$30,525
State:
$49,455
(% of AGI for various income ranges: 109.5% for AGIs below $10k, 85.3% for AGIs $10k-25k, 91.6% for AGIs $25k-50k, 90.6% for AGIs $50k-75k, 90.1% for AGIs $75k-100k, 72.5% for AGIs over 100k)
Taxable interest for individuals: $654 (reported on 26.3% of returns)
This zip code:
$654
California:
$2,365
(% of AGI for various income ranges: 1.3% for AGIs below $10k, 0.5% for AGIs $10k-25k, 0.4% for AGIs $25k-50k, 0.5% for AGIs $50k-75k, 0.4% for AGIs $75k-100k, 0.9% for AGIs over 100k)
Taxable dividends: $1,517 (reported on 6.9% of returns)
Here:
$1,517
State:
$4,746
(% of AGI for various income ranges: 0.5% for AGIs below $10k, 0.2% for AGIs $10k-25k, 0.2% for AGIs $25k-50k, 0.2% for AGIs $50k-75k, 0.4% for AGIs $75k-100k, 0.7% for AGIs over 100k)
Net capital gain/loss: +$6,743 (reported on 5.7% of returns)
Here:
+$6,743
State:
+$23,418
(% of AGI for various income ranges: 0.7% for AGIs below $10k, -0.0% for AGIs $10k-25k, -0.0% for AGIs $25k-50k, 0.7% for AGIs $50k-75k, 1.3% for AGIs $75k-100k, 5.7% for AGIs over 100k)
Profit/loss from business: +$7,991 (reported on 14.5% of returns)
Here:
+$7,991
State:
+$16,826
(% of AGI for various income ranges: 11.9% for AGIs below $10k, 7.8% for AGIs $10k-25k, 2.7% for AGIs $25k-50k, 1.2% for AGIs $50k-75k, 1.7% for AGIs $75k-100k, 3.7% for AGIs over 100k)
IRA payment deduction: $2,576 (reported on 1.5% of returns)
90806:
$2,576
California:
$3,192
(% of AGI for various income ranges: 0.1% for AGIs $10k-25k, 0.2% for AGIs $25k-50k, 0.2% for AGIs $50k-75k, 0.1% for AGIs $75k-100k, 0.1% for AGIs over 100k)
Self-employed pension: $8,100 (reported on 0.3% of returns)
Here:
$8,100
California:
$17,688
Total itemized deductions: $20,528 (33% of AGI, reported on 27.2% of returns)
Here:
$20,528
State:
$28,113
Here:
33.3% of AGI
State:
25.3% of AGI
(% of AGI for various income ranges: 8.2% for AGIs below $10k, 7.2% for AGIs $10k-25k, 16.3% for AGIs $25k-50k, 24.7% for AGIs $50k-75k, 25.7% for AGIs $75k-100k, 21.9% for AGIs over 100k)
Charity contributions deductions: $2,817 (5% of AGI, reported on 24.0% of returns)
Here:
$2,817
State:
$3,923
Here:
4.5% of AGI
State:
3.3% of AGI
(% of AGI for various income ranges: 0.4% for AGIs below $10k, 0.7% for AGIs $10k-25k, 2.0% for AGIs $25k-50k, 3.1% for AGIs $50k-75k, 3.3% for AGIs $75k-100k, 2.5% for AGIs over 100k)
Total tax: $3,789 (reported on 59.1% of returns)
90806:
$3,789
State:
$10,761
(% of AGI for various income ranges: 3.9% for AGIs below $10k, 3.0% for AGIs $10k-25k, 4.6% for AGIs $25k-50k, 7.5% for AGIs $50k-75k, 9.1% for AGIs $75k-100k, 15.8% for AGIs over 100k)
Earned income credit: $2,080 (reported on 32.2% of returns)
Here:
$2,080
State:
$1,763
Percentage of individuals using paid preparers for their 2004 taxes: 75.6%
Here:
76%
State:
66%
(% for various income ranges: 70.1% for AGIs below $10k, 77.7% for AGIs $10k-25k, 76.6% for AGIs $25k-50k, 75.2% for AGIs $50k-75k, 74.4% for AGIs $75k-100k, 81.6% for AGIs over 100k)
Likely homosexual households (counted as self-reported same-sex unmarried-partner households)
Lesbian couples: 0.0% of all households
Gay men: 0.4% of all households
Household received Food Stamps/SNAP in the past 12 months: 2,522 Household did not receive Food Stamps/SNAP in the past 12 months: 10,430
Women who had a birth in the past 12 months: 464 (217 now married, 249 unmarried) Women who did not have a birth in the past 12 months: 9,527 (3,059 now married, 6,497 unmarried)
Housing units in zip code 90806 with a mortgage: 3,264 (264 second mortgage, 3 home equity loan, 110 both second mortgage and home equity loan) Median monthly owner costs for units with a mortgage: $2,427 Median monthly owner costs for units without a mortgage: $547
Residents with income below the poverty level in 2022:
This zip code:
17.6%
Whole state:
12.2%
Residents with income below 50% of the poverty level in 2022:
This zip code:
9.1%
Whole state:
6.2%
Median number of rooms in houses and condos:
Here:
5.6
State:
6.0
Median number of rooms in apartments:
Here:
3.8
State:
3.9
Notable locations in this zip code not listed on our city pages
Notable locations in zip code 90806: City of Long Beach Fire Department Station 7 (A), Burnett Branch Long Beach Public Library (B). Display/hide their locations on the map
Churches in zip code 90806 include: Filipino-American Christian Fellowship Church (A), Pacific Baptist Church (B), Saint Mark's Anglican Church (C), The Church of Jesus Christ of Latter Day Saints (D), New Liberty Baptist Church (E), Our Lady of Mount Carmel Roman Catholic Church (F), Temple Beth Sholom (G), Westminster Community Presbyterian Church (H), Holy Innocents Roman Catholic Church (I). Display/hide their locations on the map
Parks in zip code 90806 include: Chittick Field Park (1), Veterans Memorial Park (2), Martin Luther King Junior Park (3). Display/hide their locations on the map
4,241 married couples with children.
3,554 single-parent households (934 men, 2,620 women).
40.4% of residents of 90806 zip code speak English at home.
43.6% of residents speak Spanish at home (65% very well, 15% well, 16% not well, 4% not at all).
1.2% of residents speak other Indo-European language at home (52% very well, 32% well, 13% not well, 3% not at all).
13.5% of residents speak Asian or Pacific Island language at home (50% very well, 30% well, 16% not well, 3% not at all).
1.0% of residents speak other language at home (74% very well, 12% well, 14% not well).
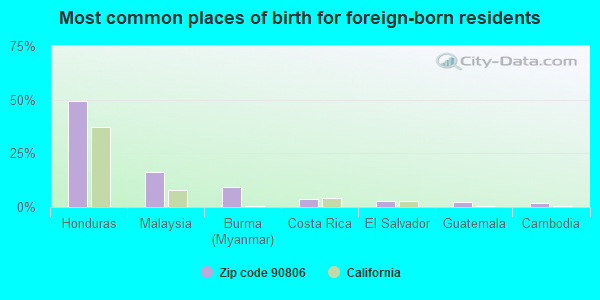
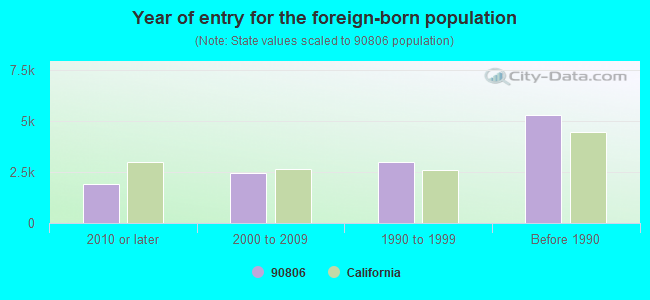
Foreign born population: 12,445 (30.8%) (53.0% of them are naturalized citizens)
Major facilities with environmental interests located in this zip code:
ENVIROPUR WEST CORPORATION (1835 EAST 29TH STREET in SIGNAL HILL, CA)
SUPERFUND (Superfund database) (Integrated Compliance Information System) - ICIS-09-1996-0094, FORMAL ENFORCEMENT ACTION, ICIS-09-1997-0013, (Integrated Compliance Information System) - ICIS-09-2000-0288, FORMAL ENFORCEMENT ACTION CRITERIA AND HAZARDOUS AIR POLLUTANT INVENTORY (Inventory of air pollution sources) Large Quantity Generators, more that 1000 kg of hazardous waste/month (Resource Conservation and Recovery Act (tracking hazardous waste)) - notification TRANSPORTER (Resource Conservation and Recovery Act (tracking hazardous waste)) - notification TSD (Resource Conservation and Recovery Act (tracking hazardous waste)) - notification USED OIL PROGRAM (Resource Conservation and Recovery Act (tracking hazardous waste)) Business SIC classification: INDUSTRIAL INORGANIC CHEMICALS; LUBRICATING OILS AND GREASES Organizations: ENVIROPUR WASTE REFINING & TECH (CONTACT/OWNER)
Alternative names: ENVIROPUR/PRC
LONG BEACH USD POLYTECH HIGH SCH (1600 ATLANTIC AVENUE in LONG BEACH, CA)
STATE MASTER (California - Hazardous Waste Tracking) - HAZARDOU WASTE PROGRAM (National Center for Education Statistics) - STATE ID-1936947 Small Quantity Generators, between 100 kg and 1000 kg of hazardous waste/month (Resource Conservation and Recovery Act (tracking hazardous waste)) Small Quantity Generators, between 100 kg and 1000 kg of hazardous waste/month (Resource Conservation and Recovery Act (tracking hazardous waste)) - notification Organizations: LONG BEACH UNIFIED (SCHOOL DISTRICT)
Alternative names: LBUSD-POLYTECHNIC HIGH SCHOOL, LONG BEACH POLY TECH SCH
EQUILON SIGNAL HILL TERMINAL (2457 REDONDO AVENUE in LONG BEACH, CA)
OIL CONTROL (Facility Response Plan for oil discharge) STATE MASTER (California - Hazardous Waste Tracking) - HAZARDOU WASTE PROGRAM CRITERIA AND HAZARDOUS AIR POLLUTANT INVENTORY (Inventory of air pollution sources) HAZARDOUS WASTE BIENNIAL REPORTER (Resource Conservation and Recovery Act (tracking hazardous waste)) Large Quantity Generators, more that 1000 kg of hazardous waste/month (Resource Conservation and Recovery Act (tracking hazardous waste)) - notification TRI REPORTER (Tracking of toxic chemicals releasing facilities) Business SIC classification: PETROLEUM BULK STATIONS AND TERMINALS Organizations: SHELL OIL (CONTACT/GENERAL)
, EQUILON ENTERPRISES LLC DBA SHELL OIL PR (CONTACT/OPERATOR)
Alternative names: EQUILON ENTS. L.L.C., SHELL OIL CO SIGNAL HILL PLANT, SHELL OIL SIGNAL HILL PLANT , SHELL SIGNAL HILL TERMINAL
INDUSTRIAL ZINC PLATING CORPORATION (3200 E. 29TH ST. in LONG BEACH, CA)
SUPERFUND (Superfund database) FORMAL ENFORCEMENT ACTION (Integrated Compliance Information System) - ICIS-09-2005-0116, ENFORCEMENT/COMPLIANCE ACTIVITY Small Quantity Generators, between 100 kg and 1000 kg of hazardous waste/month (Resource Conservation and Recovery Act (tracking hazardous waste)) - ICIS-, ENFORCEMENT/COMPLIANCE ACTIVITY TRI REPORTER (Tracking of toxic chemicals releasing facilities) Business SIC and NAICS classification: ELECTROPLATING, PLATING, POLISHING, ANODIZING, AND COLORING Alternative names: INDUSTRIAL ZINC PLATERS INC
LONG BEACH USD LAFAYETTE ELEM (2445 CHESTNUT AVENUE in LONG BEACH, CA)
STATE MASTER (California - Hazardous Waste Tracking) - HAZARDOU WASTE PROGRAM (National Center for Education Statistics) - STATE ID-6015424 Small Quantity Generators, between 100 kg and 1000 kg of hazardous waste/month (Resource Conservation and Recovery Act (tracking hazardous waste)) Organizations: LONG BEACH UNIFIED (SCHOOL DISTRICT)
Alternative names: LBUSD-LAFAYETTE ELEMENTARY
HIGH TECH WEST INCORPORATED (2750 RAYMOND AVENUE in SIGNAL HILL, CA)
ENFORCEMENT/COMPLIANCE ACTIVITY (Integrated Compliance Information System) - ICIS-09-2001-0063, FORMAL ENFORCEMENT ACTION (Integrated Compliance Information System) - ICIS-09-2001-0063, FORMAL ENFORCEMENT ACTION COMPLIANCE ACTIVITY (Tracking inspections of insecticide, fungicide, and rodenticide, and toxic substances) TRI REPORTER (Tracking of toxic chemicals releasing facilities) Business SIC classification: INDUSTRIAL AND COMMERCIAL MACHINERY AND EQUIPMENT
LONG BEACH COMMUNITY COLLEGE DISTRICT (1305 EAST PACIFIC COAST HIGHWAY in LONG BEACH, CA)
AIR MONITORING SITE (Airborne pollution emission tracking) FORMAL ENFORCEMENT ACTION (Integrated Compliance Information System) - ICIS-09-2005-0098, ENFORCEMENT/COMPLIANCE ACTIVITY (Resource Conservation and Recovery Act (tracking hazardous waste)) Small Quantity Generators, between 100 kg and 1000 kg of hazardous waste/month (Resource Conservation and Recovery Act (tracking hazardous waste)) - notification Organizations: LONG BEACH CITY COLLEGE (CONTACT/OWNER)
Alternative names: LONG BEACH CITY COLLEGE, LONG BEACH CITY COLLEGE AUTO
JOHN OSBORNE CO (1990 CHERRY AVE in LONG BEACH, CA)
STATE MASTER (California - Hazardous Waste Tracking) - HAZARDOU WASTE PROGRAM Small Quantity Generators, between 100 kg and 1000 kg of hazardous waste/month (Resource Conservation and Recovery Act (tracking hazardous waste)) - notification Small Quantity Generators, between 100 kg and 1000 kg of hazardous waste/month (Resource Conservation and Recovery Act (tracking hazardous waste)) - notification Alternative names: JOHN OSBORN CO, OSBORNS USED CARS
ENVIRONMENTAL RECOVERY SERVICES INC (2650 LIME AVE in SIGNAL HILL, CA)
STATE MASTER (California - Hazardous Waste Tracking) - HAZARDOU WASTE PROGRAM Small Quantity Generators, between 100 kg and 1000 kg of hazardous waste/month (Resource Conservation and Recovery Act (tracking hazardous waste)) TRANSPORTER (Resource Conservation and Recovery Act (tracking hazardous waste)) Organizations: ENVIROSERV (CONTACT/OPERATOR)
, LIME PROPERTIES (CONTACT/OWNER)
Alternative names: ENV RECOVERY SERVICES INC
HERITAGE ENVIRONMENTAL SERVICES L L C (2400 CERRITOS AVE in SIGNAL HILL, CA)
STATE MASTER (California - Hazardous Waste Tracking) - HAZARDOU WASTE PROGRAM Small Quantity Generators, between 100 kg and 1000 kg of hazardous waste/month (Resource Conservation and Recovery Act (tracking hazardous waste)) - notification TRANSPORTER (Resource Conservation and Recovery Act (tracking hazardous waste)) - notification USED OIL PROGRAM (Resource Conservation and Recovery Act (tracking hazardous waste)) Organizations: HERITAGE ENVIRON SVCS L L C (CONTACT/OWNER)
CABE BROS TOYOTA (2901 LONG BEACH BLVD in LONG BEACH, CA)
STATE MASTER (California - Hazardous Waste Tracking) - HAZARDOU WASTE PROGRAM Small Quantity Generators, between 100 kg and 1000 kg of hazardous waste/month (Resource Conservation and Recovery Act (tracking hazardous waste)) - notification Organizations: JOHN CABE (CONTACT/OWNER)
Alternative names: CABE TOYOTA
FAIR AUTO (1501 PACIFIC COAST HWY in LONG BEACH, CA)
STATE MASTER (California - Hazardous Waste Tracking) - HAZARDOU WASTE PROGRAM Small Quantity Generators, between 100 kg and 1000 kg of hazardous waste/month (Resource Conservation and Recovery Act (tracking hazardous waste)) - notification Organizations: PABON DAVID (CONTACT/OWNER)
ALFA WEST (3033 LONG BEACH in LONG BEACH, CA)
STATE MASTER (California - Hazardous Waste Tracking) - HAZARDOU WASTE PROGRAM Small Quantity Generators, between 100 kg and 1000 kg of hazardous waste/month (Resource Conservation and Recovery Act (tracking hazardous waste)) - notification Business NAICS classification: GENERAL AUTOMOTIVE REPAIR. Organizations: MAVRIZIO CAPPELLETTI (CONTACT/OWNER)
Alternative names: ALFA WEST IMPORTED CAR SERVICE
Housing units lacking complete plumbing facilities: 0.5% Housing units lacking complete kitchen facilities: 3.1%
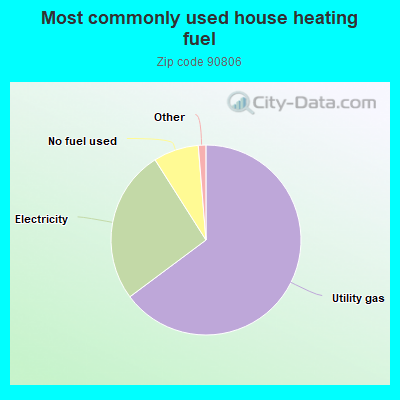
64.8%Utility gas
26.2%Electricity
7.7%No fuel used
0.6%Bottled, tank, or LP gas
0.5%Solar energy
Population in 1990: 44,982. Population change in the 1990s: +4,659 (+10.4%).
Place of birth for U.S.-born residents:
This state: 24,171
Northeast: 550
Midwest: 1,010
South: 1,285
West: 549
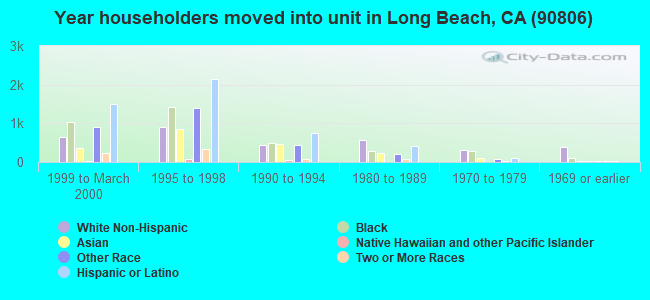
48% of the 90806 zip code residents lived in the same house 5 years ago. Out of people who lived in different houses, 90% lived in this county. Out of people who lived in different counties, 50% lived in California.
92% of the 90806 zip code residents lived in the same house 1 year ago. Out of people who lived in different houses, 81% moved from this county. Out of people who lived in different houses, 11% moved from different county within same state. Out of people who lived in different houses, 5% moved from different state. Out of people who lived in different houses, 2% moved from abroad.
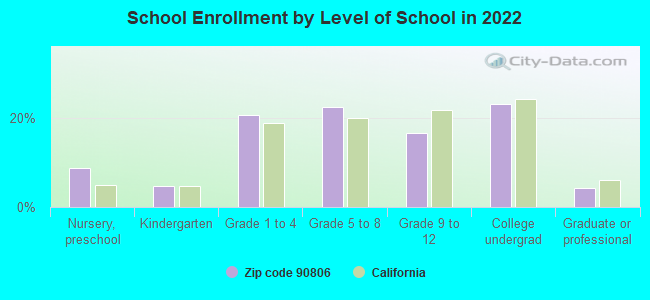
Private vs. public school enrollment:
Students in private schools in grades 1 to 8 (elementary and middle school): 181
Here:
4.2%
California:
10.5%
Students in private schools in grades 9 to 12 (high school): 31
Here:
1.9%
California:
8.5%
Students in private undergraduate colleges: 89
Here:
3.8%
California:
15.9%
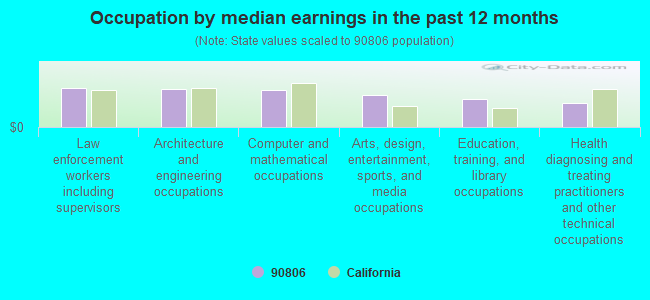
Occupation by median earnings in the past 12 months ($)
115,916Law enforcement workers including supervisors
111,714Architecture and engineering occupations
109,882Computer and mathematical occupations
94,957Arts, design, entertainment, sports, and media occupations
84,226Education, training, and library occupations
70,030Health diagnosing and treating practitioners and other technical occupations
Companies with biggest federal contracts located in this zip code:
EPSON AMERICA INC (3840 KILROY AIRPORT WAY in LONG BEACH, CA; small business) : $10,662,062 in 303 contractsfrom 1999 to 2006
Contracts for ADPE System Configuration, Photographic Projection Equipment, ADP Supplies, Office Information System Equipment, and moreby Air Force, Navy, Department of Defense, Army, and others Signed by year:2000: $2,351,365; 2001: $1,920,798; 2002: $1,394,676; 2003: $3,616,984; 2004: $814,109; 2005: $348,253; 2006: $23,987.
Biggest contracts:
$666,300 with Air Force for ADPE System Configuration. Taking place in FL. Signed on 2001-05-01. Completion date: 2001-04-30.
$452,432 with Navy for ADPE System Configuration. Taking place in TX. Signed on 2003-08-18. Completion date: 2003-09-18.
$443,818 with Department of Defense for ADPE System Configuration. Signed on 2000-05-24. Completion date: 2000-09-30.
$341,735 with Navy for ADPE System Configuration. Taking place in GA. Signed on 2003-06-27. Completion date: 2006-03-30.
DILET ASSOCIATES, LLC (3780 KILROY AIRPORT WAY, S in LONG BEACH, CA; small business) : $5,302,019 in 61 contractsfrom 2000 to 2006
Contracts for Electrical and Electronic assemblies, Boards, Cards, and Associated Hardware, Miscellaneous Electrical and Electronic Components, ADP Components, ADP Input/Output and Storage Devices, and moreby Navy Signed by year:2000: $863,339; 2001: $765,075; 2002: $1,267,665; 2003: $572,138; 2004: $1,510,247; 2005: $315,372; 2006: $8,183.
Biggest contracts:
$741,825 with Navy for Electrical and Electronic assemblies, Boards, Cards, and Associated Hardware. Signed on 2002-09-25. Completion date: 2002-09-30.
$547,500 with Navy for Miscellaneous Electrical and Electronic Components. Signed on 2004-12-27. Completion date: 2005-04-20.
$438,899 with Navy for ADP Components. Signed on 2004-09-24. Completion date: 2004-12-06.
$306,090 with Navy for ADP Components. Taking place in VA. Signed on 2000-07-27. Completion date: 2000-07-27.
HERBLANE INDUSTRIES, INC (200 EAST WILLOW; SUITE 243 in LONG BEACH, CA; small business) : $949,029 in 6 contractsfrom 2000 to 2003
Contracts for Physical Sciences -- Applied Research and Exploratory Development (R&D), Defense Aircraft -- Basic Research (R&D), Defense Electronics and Communication Equipment -- Applied Research and Exploratory Development (R&D) by Navy Signed by year:2000: $169,996; 2001: $130,000; 2002: $375,000; 2003: $274,033; 2004: $0; 2005: $0; 2006: $0.
Biggest contracts:
$375,000 with Navy for Physical Sciences -- Applied Research and Exploratory Development (R&D). Signed on 2002-02-19. Completion date: 2003-11-13.
$274,033, same as above.Signed on 2003-03-06. Completion date: 2003-11-11.
$100,000, same as above.Signed on 2001-11-14. Completion date: 2003-11-14.
$100,000 with Navy for Defense Aircraft -- Basic Research (R&D). Signed on 2000-11-16. Completion date: 2001-05-20.
AIRDROME PARTS CO (3251 E AIRPORT WAY in LONG BEACH, CA; small business) : $392,026 in 66 contractsfrom 2002 to 2006
Contracts for Hose, Pipe, Tube, Lubrication, and Railing Fittings, Packing and Gasket Materials by Defense Logistics Agency Signed by year:2000: $0; 2001: $0; 2002: $27,102; 2003: $0; 2004: $59,823; 2005: $197,244; 2006: $107,857.
Biggest contracts:
$27,102 with Defense Logistics Agency for Hose, Pipe, Tube, Lubrication, and Railing Fittings. Signed on 2002-05-20. Completion date: 2002-09-12.
$13,378, same as above.Signed on 2006-03-22. Completion date: 2006-06-30.
$12,636 with Defense Logistics Agency for Packing and Gasket Materials. Signed on 2005-12-06. Completion date: 2006-03-28.
$12,582 with Defense Logistics Agency for Hose, Pipe, Tube, Lubrication, and Railing Fittings. Signed on 2004-12-06. Completion date: 2005-04-05.
NEWPORT PETROLEUM INCORPORATED (2650 GUNDRY AVENUE in LONG BEACH, CA; small business)
$198,000 with Navy for Marine Charter for Things. Signed on 2000-10-27. Completion date: 2000-11-27.
NNN TECH FUND 111, LLC. ( in Long Beach, CA; small business) : $154,990 in 37 contractsfrom 2002 to 2006
Contracts for Lease or Rental of Facilities -- Office Buildings by Public Buildings Service Signed by year:2000: $0; 2001: $0; 2002: $18,022; 2003: $72,444; 2004: $10,188; 2005: $30,564; 2006: $23,772.
Biggest contracts:
$9,011 with Public Buildings Service for Lease or Rental of Facilities -- Office Buildings. Signed on 2003-09-15. Completion date: 2003-09-15.
$9,011, same as above.Signed on 2002-12-15. Completion date: 2002-12-15.
$9,011, same as above.Signed on 2003-09-15. Completion date: 2003-09-15.
$9,011, same as above.Signed on 2003-09-15. Completion date: 2003-09-15.
H & H WILSON SALES INC (3200 AIRPORT WAY in LONG BEACH, CA; small business)
$45,470 with Navy for Vehicular Cab, Body, and Frame Structural Components. Signed on 2005-03-24. Completion date: 2005-04-11.
METALWORKS UNLIMITED INC (1711 E 28TH ST in LONG BEACH, CA; small business)
$43,725 with Defense Logistics Agency for Airfield Specialized Trucks and Trailers. Signed on 2002-04-08. Completion date: 2002-06-07.
PEGO SYSTEMS INC. (1196 E. WILLOW ST in LONG BEACH, CA; small business)
$41,484 with Air Force for Industrial Boilers. Signed on 2000-03-10. Completion date: 2000-07-21.
M B S INDUSTRIAL SERVICE INC (2243 CERRITOS AVE in LONG BEACH, CA; small business) 50 employees, $0 revenue.
$29,100 with Navy for Non-nuclear Ship Repair (West) Ship repair (including overhauls and conversions) performed on. non-nuclear propelled and nonpropelled ships west of the 108th meridian. Signed on 2000-05-22. Completion date: 2000-07-10.
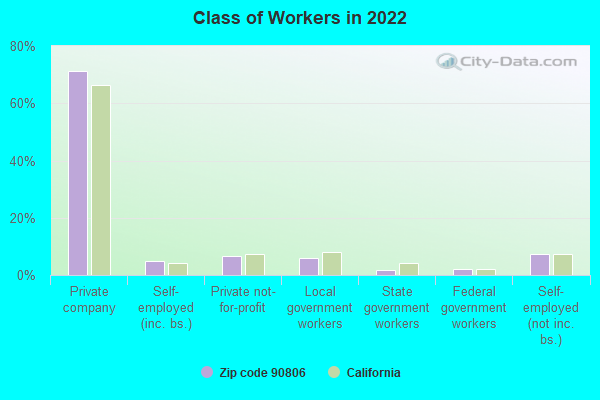
Top industries in this zip code by the number of employees in 2005:
Health Care and Social Assistance: General Medical and Surgical Hospitals (over 1000 employees: 1 establishment, 500-999 employees: 1 establishment)
Health Care and Social Assistance: Offices of Physicians (except Mental Health Specialists) (100-249: 1, 50-99: 2, 20-49: 10, 10-19: 21, 5-9: 39, 1-4: 80)
Administrative and Support and Waste Management and Remediation Services: Temporary Help Services (100-249: 4, 50-99: 1, 20-49: 1, 10-19: 1, 1-4: 1)
Finance and Insurance: Direct Health and Medical Insurance Carriers (500-999: 1, 20-49: 1)
Administrative and Support and Waste Management and Remediation Services: Professional Employer Organizations (500-999: 1, 1-4: 1)
Administrative and Support and Waste Management and Remediation Services: Telephone Answering Services (500-999: 1)
Wholesale Trade: Computer and Computer Peripheral Equipment and Software Merchant Wholesalers (250-499: 1, 100-249: 1, 10-19: 2, 1-4: 1)
Administrative and Support and Waste Management and Remediation Services: Security Guards and Patrol Services (250-499: 1, 100-249: 1)
Health Care and Social Assistance: Nursing Care Facilities (100-249: 3, 1-4: 1)
People in group quarters in 2010:
245 people in nursing facilities/skilled-nursing facilities
97 people in residential treatment centers for adults
68 people in other noninstitutional facilities
60 people in emergency and transitional shelters (with sleeping facilities) for people experiencing homelessness
30 people in group homes intended for adults
7 people in workers' group living quarters and job corps centers
People in group quarters in 2000:
406 people in homes or halfway houses for drug/alcohol abuse
279 people in nursing homes
69 people in other noninstitutional group quarters
51 people in homes for the mentally ill
19 people in homes for the mentally retarded
13 people in other nonhousehold living situations
11 people in other group homes
5 people in religious group quarters
Fatal accident statistics in 2014:
Fatal accident count: 3
Vehicles involved in fatal accidents: 3
Fatal accidents caused by drunken drivers: 0
Fatalities: 3
Persons involved in fatal accidents: 3
Pedestrians involved in fatal accidents: 2
Fatal accident statistics in 2012:
Fatal accident count: 4
Vehicles involved in fatal accidents: 4
Fatal accidents caused by drunken drivers: 1
Fatalities: 4
Persons involved in fatal accidents: 4
Pedestrians involved in fatal accidents: 4
Home Mortgage Disclosure Act Aggregated Statistics For Year 2009 (Based on 10 full and 12 partial tracts)
A) FHA, FSA/RHS & VA Home Purchase Loans
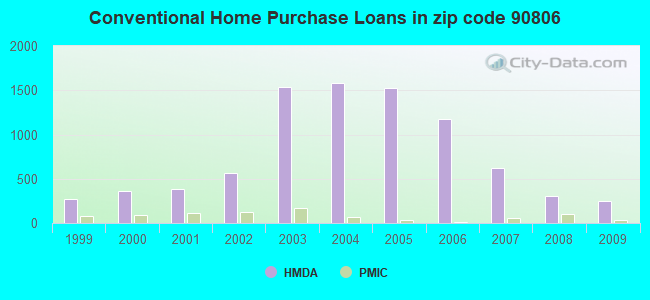
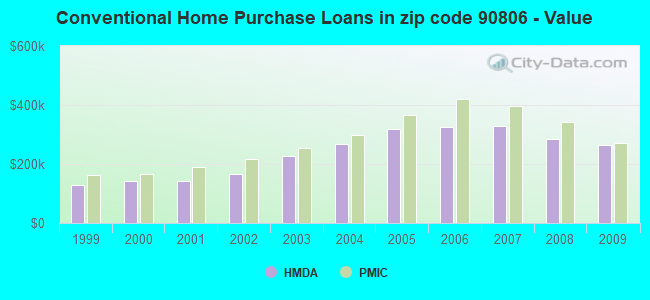
B) Conventional Home Purchase Loans
C) Refinancings
D) Home Improvement Loans
E) Loans on Dwellings For 5+ Families
F) Non-occupant Loans on < 5 Family Dwellings (A B C & D)
G) Loans On Manufactured Home Dwelling (A B C & D)
Number
Average Value
Number
Average Value
Number
Average Value
Number
Average Value
Number
Average Value
Number
Average Value
Number
Average Value
LOANS ORIGINATED
232
$310,385
244
$265,254
705
$265,076
38
$219,607
14
$539,457
94
$254,913
0
$0
APPLICATIONS APPROVED, NOT ACCEPTED
31
$301,273
28
$288,944
89
$274,022
7
$147,886
2
$339,285
10
$270,140
0
$0
APPLICATIONS DENIED
65
$344,135
62
$320,644
365
$310,648
31
$155,195
12
$508,005
51
$221,630
2
$21,875
APPLICATIONS WITHDRAWN
45
$296,279
42
$285,780
171
$295,669
10
$142,421
2
$484,690
31
$280,709
0
$0
FILES CLOSED FOR INCOMPLETENESS
24
$317,709
17
$301,388
73
$268,744
6
$110,947
2
$671,320
7
$221,449
0
$0
Aggregated Statistics For Year 2008 (Based on 10 full and 12 partial tracts)
A) FHA, FSA/RHS & VA Home Purchase Loans
B) Conventional Home Purchase Loans
C) Refinancings
D) Home Improvement Loans
E) Loans on Dwellings For 5+ Families
F) Non-occupant Loans on < 5 Family Dwellings (A B C & D)
G) Loans On Manufactured Home Dwelling (A B C & D)
Number
Average Value
Number
Average Value
Number
Average Value
Number
Average Value
Number
Average Value
Number
Average Value
Number
Average Value
LOANS ORIGINATED
104
$329,272
307
$286,407
532
$285,435
81
$137,528
35
$569,417
118
$295,333
0
$0
APPLICATIONS APPROVED, NOT ACCEPTED
9
$361,036
68
$285,906
192
$308,886
22
$152,732
4
$504,090
18
$302,303
5
$59,452
APPLICATIONS DENIED
27
$329,982
150
$344,690
598
$363,309
86
$126,242
6
$606,477
93
$339,255
1
$3,000
APPLICATIONS WITHDRAWN
23
$362,661
62
$309,735
159
$306,613
25
$233,408
2
$433,500
34
$284,106
0
$0
FILES CLOSED FOR INCOMPLETENESS
3
$251,093
13
$261,583
75
$332,340
9
$181,337
0
$0
13
$353,452
0
$0
Aggregated Statistics For Year 2007 (Based on 10 full and 12 partial tracts)
A) FHA, FSA/RHS & VA Home Purchase Loans
B) Conventional Home Purchase Loans
C) Refinancings
D) Home Improvement Loans
E) Loans on Dwellings For 5+ Families
F) Non-occupant Loans on < 5 Family Dwellings (A B C & D)
G) Loans On Manufactured Home Dwelling (A B C & D)
Number
Average Value
Number
Average Value
Number
Average Value
Number
Average Value
Number
Average Value
Number
Average Value
Number
Average Value
LOANS ORIGINATED
0
$0
616
$327,442
1,390
$343,729
198
$208,921
73
$644,230
196
$411,406
3
$37,433
APPLICATIONS APPROVED, NOT ACCEPTED
0
$0
192
$348,210
395
$364,521
54
$244,551
2
$621,410
57
$409,545
6
$90,667
APPLICATIONS DENIED
1
$180,000
403
$380,791
1,153
$383,512
171
$209,891
14
$957,201
158
$432,693
5
$147,604
APPLICATIONS WITHDRAWN
0
$0
151
$392,595
474
$392,181
58
$279,009
4
$383,800
72
$501,258
0
$0
FILES CLOSED FOR INCOMPLETENESS
0
$0
54
$366,564
177
$370,940
14
$307,477
0
$0
23
$375,117
0
$0
Aggregated Statistics For Year 2006 (Based on 10 full and 12 partial tracts)
A) FHA, FSA/RHS & VA Home Purchase Loans
B) Conventional Home Purchase Loans
C) Refinancings
D) Home Improvement Loans
E) Loans on Dwellings For 5+ Families
F) Non-occupant Loans on < 5 Family Dwellings (A B C & D)
G) Loans On Manufactured Home Dwelling (A B C & D)
Number
Average Value
Number
Average Value
Number
Average Value
Number
Average Value
Number
Average Value
Number
Average Value
Number
Average Value
LOANS ORIGINATED
2
$313,505
1,178
$326,778
2,198
$343,113
311
$221,542
92
$730,678
387
$399,151
3
$105,787
APPLICATIONS APPROVED, NOT ACCEPTED
0
$0
290
$331,682
499
$356,431
65
$245,172
0
$0
110
$407,907
9
$67,579
APPLICATIONS DENIED
0
$0
591
$327,758
1,118
$382,641
213
$202,800
8
$631,551
162
$403,422
4
$211,680
APPLICATIONS WITHDRAWN
0
$0
328
$322,982
792
$359,281
76
$198,484
9
$514,173
75
$379,066
4
$311,720
FILES CLOSED FOR INCOMPLETENESS
0
$0
71
$325,501
171
$365,500
15
$336,823
0
$0
22
$377,557
0
$0
Aggregated Statistics For Year 2005 (Based on 10 full and 12 partial tracts)
B) Conventional Home Purchase Loans
C) Refinancings
D) Home Improvement Loans
E) Loans on Dwellings For 5+ Families
F) Non-occupant Loans on < 5 Family Dwellings (A B C & D)
G) Loans On Manufactured Home Dwelling (A B C & D)
Number
Average Value
Number
Average Value
Number
Average Value
Number
Average Value
Number
Average Value
Number
Average Value
LOANS ORIGINATED
1,531
$317,294
2,640
$308,373
328
$219,633
116
$769,292
453
$326,158
7
$99,704
APPLICATIONS APPROVED, NOT ACCEPTED
296
$296,669
460
$294,254
51
$221,505
8
$433,702
73
$309,683
5
$71,588
APPLICATIONS DENIED
514
$299,335
1,048
$331,001
190
$156,186
4
$418,250
151
$356,871
13
$124,837
APPLICATIONS WITHDRAWN
361
$319,107
938
$302,331
99
$191,796
2
$622,895
94
$340,807
0
$0
FILES CLOSED FOR INCOMPLETENESS
82
$292,895
312
$313,167
16
$117,167
0
$0
33
$275,525
2
$297,075
Aggregated Statistics For Year 2004 (Based on 10 full and 12 partial tracts)
A) FHA, FSA/RHS & VA Home Purchase Loans
B) Conventional Home Purchase Loans
C) Refinancings
D) Home Improvement Loans
E) Loans on Dwellings For 5+ Families
F) Non-occupant Loans on < 5 Family Dwellings (A B C & D)
G) Loans On Manufactured Home Dwelling (A B C & D)
Number
Average Value
Number
Average Value
Number
Average Value
Number
Average Value
Number
Average Value
Number
Average Value
Number
Average Value
LOANS ORIGINATED
17
$266,002
1,577
$268,210
2,977
$259,086
306
$187,262
143
$567,685
521
$273,664
3
$29,717
APPLICATIONS APPROVED, NOT ACCEPTED
0
$0
345
$293,660
586
$253,672
44
$171,731
4
$293,580
135
$261,955
2
$50,050
APPLICATIONS DENIED
0
$0
339
$287,374
1,123
$259,986
193
$147,116
11
$441,559
160
$309,352
4
$65,220
APPLICATIONS WITHDRAWN
4
$222,782
254
$257,361
802
$245,432
81
$176,463
5
$497,870
89
$255,441
2
$123,210
FILES CLOSED FOR INCOMPLETENESS
3
$164,133
98
$271,754
458
$250,771
21
$316,646
0
$0
35
$250,496
0
$0
Aggregated Statistics For Year 2003 (Based on 10 full and 12 partial tracts)
A) FHA, FSA/RHS & VA Home Purchase Loans
B) Conventional Home Purchase Loans
C) Refinancings
D) Home Improvement Loans
E) Loans on Dwellings For 5+ Families
F) Non-occupant Loans on < 5 Family Dwellings (A B C & D)
Number
Average Value
Number
Average Value
Number
Average Value
Number
Average Value
Number
Average Value
Number
Average Value
LOANS ORIGINATED
56
$229,193
1,538
$225,624
4,322
$191,319
105
$72,758
120
$433,404
522
$207,219
APPLICATIONS APPROVED, NOT ACCEPTED
5
$151,392
307
$239,091
692
$197,897
43
$59,844
2
$210,825
98
$211,826
APPLICATIONS DENIED
4
$167,240
317
$226,998
1,430
$195,581
106
$61,130
8
$489,860
142
$204,934
APPLICATIONS WITHDRAWN
16
$239,649
234
$244,426
986
$193,036
29
$46,731
4
$1,223,038
78
$229,840
FILES CLOSED FOR INCOMPLETENESS
11
$202,485
59
$245,053
235
$203,903
8
$65,641
2
$2,315,360
26
$201,991
Aggregated Statistics For Year 2002 (Based on 7 full and 6 partial tracts)
A) FHA, FSA/RHS & VA Home Purchase Loans
B) Conventional Home Purchase Loans
C) Refinancings
D) Home Improvement Loans
E) Loans on Dwellings For 5+ Families
F) Non-occupant Loans on < 5 Family Dwellings (A B C & D)
Number
Average Value
Number
Average Value
Number
Average Value
Number
Average Value
Number
Average Value
Number
Average Value
LOANS ORIGINATED
114
$182,374
570
$165,046
1,534
$169,142
38
$64,549
43
$335,695
191
$167,017
APPLICATIONS APPROVED, NOT ACCEPTED
22
$152,093
93
$156,330
254
$162,859
11
$24,399
0
$0
37
$162,215
APPLICATIONS DENIED
24
$221,585
133
$179,000
539
$160,184
55
$50,260
7
$361,126
46
$177,802
APPLICATIONS WITHDRAWN
13
$194,503
72
$156,109
330
$165,952
29
$56,263
6
$210,847
12
$193,265
FILES CLOSED FOR INCOMPLETENESS
2
$218,500
39
$167,660
206
$159,612
5
$86,698
0
$0
18
$154,773
Aggregated Statistics For Year 2001 (Based on 7 full and 6 partial tracts)
A) FHA, FSA/RHS & VA Home Purchase Loans
B) Conventional Home Purchase Loans
C) Refinancings
D) Home Improvement Loans
E) Loans on Dwellings For 5+ Families
F) Non-occupant Loans on < 5 Family Dwellings (A B C & D)
Number
Average Value
Number
Average Value
Number
Average Value
Number
Average Value
Number
Average Value
Number
Average Value
LOANS ORIGINATED
197
$187,874
384
$142,649
1,037
$150,651
43
$27,481
37
$287,246
96
$142,287
APPLICATIONS APPROVED, NOT ACCEPTED
11
$188,453
70
$137,394
185
$139,062
19
$24,602
2
$194,740
19
$140,243
APPLICATIONS DENIED
32
$185,278
124
$152,050
563
$138,425
114
$24,731
7
$904,597
43
$142,749
APPLICATIONS WITHDRAWN
46
$201,621
63
$159,263
380
$159,376
26
$22,412
1
$934,990
27
$155,482
FILES CLOSED FOR INCOMPLETENESS
3
$173,740
13
$112,726
112
$146,845
4
$29,108
0
$0
11
$90,283
Aggregated Statistics For Year 2000 (Based on 7 full and 6 partial tracts)
A) FHA, FSA/RHS & VA Home Purchase Loans
B) Conventional Home Purchase Loans
C) Refinancings
D) Home Improvement Loans
E) Loans on Dwellings For 5+ Families
F) Non-occupant Loans on < 5 Family Dwellings (A B C & D)
Number
Average Value
Number
Average Value
Number
Average Value
Number
Average Value
Number
Average Value
Number
Average Value
LOANS ORIGINATED
199
$169,267
357
$143,435
322
$125,511
66
$29,442
19
$236,948
69
$110,661
APPLICATIONS APPROVED, NOT ACCEPTED
26
$164,780
84
$160,006
100
$112,429
49
$23,577
2
$262,265
11
$113,483
APPLICATIONS DENIED
38
$198,030
160
$142,282
383
$117,530
88
$24,778
8
$183,328
42
$128,473
APPLICATIONS WITHDRAWN
13
$165,647
79
$132,088
152
$107,525
15
$20,883
0
$0
12
$181,057
FILES CLOSED FOR INCOMPLETENESS
14
$182,413
30
$140,079
122
$140,016
2
$34,250
0
$0
13
$128,831
Aggregated Statistics For Year 1999 (Based on 6 full and 5 partial tracts)
A) FHA, FSA/RHS & VA Home Purchase Loans
B) Conventional Home Purchase Loans
C) Refinancings
D) Home Improvement Loans
E) Loans on Dwellings For 5+ Families
F) Non-occupant Loans on < 5 Family Dwellings (A B C & D)
2005 - 2018 National Fire Incident Reporting System (NFIRS) incidents
Based on the data from the years 2005 - 2018 the average number of fire incidents per year is 78. The highest number of reported fires - 136 took place in 2005, and the least - 0 in 2013. The data has a decreasing trend.
When looking into fire subcategories, the most reports belonged to: Structure Fires (37.1%), and Outside Fires (36.8%).
Fire incident types reported to NFIRS in Zip Code 90806


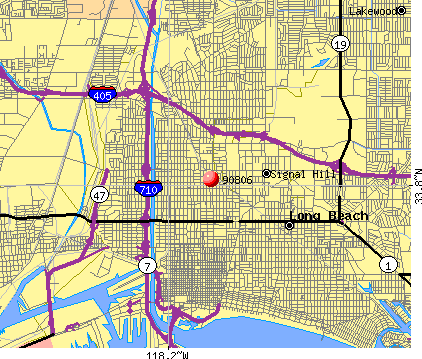 Nearest zip codes: 90755, 90813, 90807, 90810, 90831, 90804.


 Based on the data from the years 2005 - 2018 the average number of fire incidents per year is 78. The highest number of reported fires - 136 took place in 2005, and the least - 0 in 2013. The data has a decreasing trend.
 When looking into fire subcategories, the most reports belonged to: Structure Fires (37.1%), and Outside Fires (36.8%).