Estimated zip code population in 2022: 32,877 Zip code population in 2010: 31,481 Zip code population in 2000: 31,549
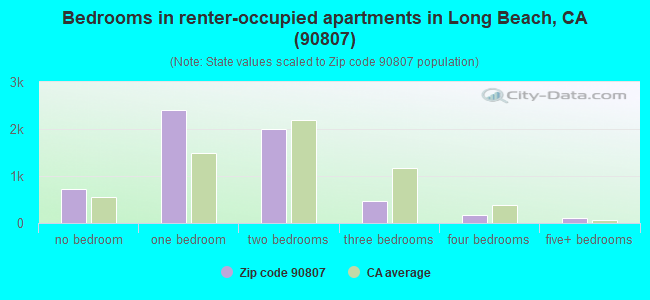
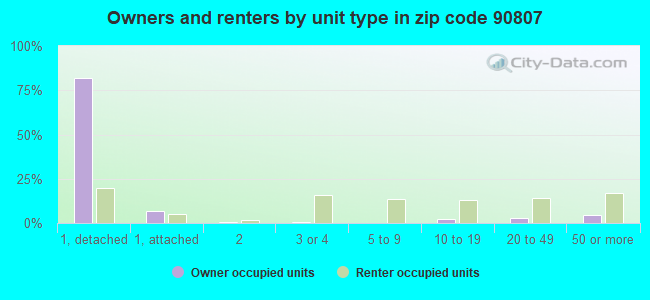
Houses and condos: 13,562 Renter-occupied apartments: 5,855
% of renters here:
45%
State:
44%
March 2022 cost of living index in zip code 90807: 135.8 (high, U.S. average is 100)
Land area: 5.8 sq. mi. Water area: 0.0 sq. mi.
Population density: 5,630 people per square mile
(average).
OSM Map
General Map
Google Map
MSN Map
OSM Map
General Map
Google Map
MSN Map
OSM Map
General Map
Google Map
MSN Map
OSM Map
General Map
Google Map
MSN Map
Please wait while loading the map...
Real estate property taxes paid for housing units in 2022:
This zip code:
0.6% ($5,257)
California:
0.7% ($4,831)
Median real estate property taxes paid for housing units with mortgages in 2022: $5,932 (0.7%) Median real estate property taxes paid for housing units with no mortgage in 2022: $3,254 (0.4%)
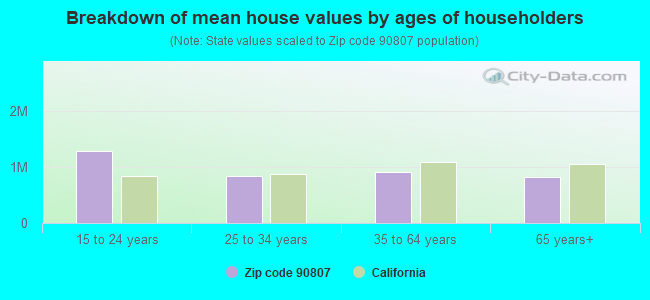
Estimated median house/condo value in 2022: $838,709
90807:
$838,709
California:
$715,900
According to our research of California and other state lists, there were 34 registered sex offenders living in 90807 zip code as of April 26, 2024. The ratio of all residents to sex offenders in zip code 90807 is 991 to 1. The ratio of registered sex offenders to all residents in this zip code is lower than the state average.
Median resident age:
This zip code:
42.3 years
California median age:
37.9 years
Average household size:
This zip code:
2.5 people
California:
2.8 people
Averages for the 2020 tax year for zip code 90807, filed in 2021:
Average Adjusted Gross Income (AGI) in 2020: $90,476 (Individual Income Tax Returns)
Here:
$90,476
State:
$95,910
Salary/wage: $76,948 (reported on 80.6% of returns)
Here:
$76,948
State:
$77,331
(% of AGI for various income ranges: 1187.3% for AGIs below $25k, 4005.7% for AGIs $25k-50k, 7453.3% for AGIs $50k-75k, 11020.2% for AGIs $75k-100k, 19372.7% for AGIs $100k-200k, 83326.8% for AGIs over 200k)
Taxable interest for individuals: $1,446 (reported on 39.7% of returns)
This zip code:
$1,446
California:
$2,294
(% of AGI for various income ranges: 14.4% for AGIs below $25k, 20.5% for AGIs $25k-50k, 46.7% for AGIs $50k-75k, 60.0% for AGIs $75k-100k, 154.6% for AGIs $100k-200k, 1150.7% for AGIs over 200k)
Ordinary dividends: $6,580 (reported on 20.1% of returns)
Here:
$6,580
State:
$10,949
(% of AGI for various income ranges: 33.0% for AGIs below $25k, 35.9% for AGIs $25k-50k, 74.7% for AGIs $50k-75k, 118.6% for AGIs $75k-100k, 289.6% for AGIs $100k-200k, 3184.1% for AGIs over 200k)
Net capital gain/loss in AGI: +$21,507 (reported on 19.7% of returns)
Here:
+$21,507
State:
+$49,306
(% of AGI for various income ranges: 7.0% for AGIs below $25k, 25.4% for AGIs $25k-50k, 79.5% for AGIs $50k-75k, 181.1% for AGIs $75k-100k, 495.9% for AGIs $100k-200k, 14342.0% for AGIs over 200k)
Profit/loss from business: +$11,722 (reported on 20.3% of returns)
Here:
+$11,722
State:
+$15,671
(% of AGI for various income ranges: 158.7% for AGIs below $25k, 151.0% for AGIs $25k-50k, 124.1% for AGIs $50k-75k, 285.2% for AGIs $75k-100k, 521.8% for AGIs $100k-200k, 4367.1% for AGIs over 200k)
Taxable individual retirement arrangement distribution: $23,258 (reported on 7.1% of returns)
90807:
$23,258
California:
$23,505
(% of AGI for various income ranges: 49.9% for AGIs below $25k, 90.1% for AGIs $25k-50k, 148.9% for AGIs $50k-75k, 238.1% for AGIs $75k-100k, 625.7% for AGIs $100k-200k, 2135.4% for AGIs over 200k)
Self-employed (Keogh) retirement plans: $25,943 (reported on 0.8% of returns)
90807:
$25,943
California:
$30,163
(% of AGI for various income ranges: 22.0% for AGIs $50k-75k, 32.4% for AGIs $100k-200k, 663.9% for AGIs over 200k)
Total itemized deductions: $33,509 (reported on 22.9% of returns)
Here:
$33,509
State:
$39,517
(% of AGI for various income ranges: 125.7% for AGIs below $25k, 318.9% for AGIs $25k-50k, 685.4% for AGIs $50k-75k, 1306.6% for AGIs $75k-100k, 2770.1% for AGIs $100k-200k, 11137.3% for AGIs over 200k)
Charity contributions: $7,394 (reported on 19.9% of returns)
Here:
$7,394
State:
$12,598
(% of AGI for various income ranges: 11.1% for AGIs below $25k, 35.6% for AGIs $25k-50k, 90.9% for AGIs $50k-75k, 198.3% for AGIs $75k-100k, 455.3% for AGIs $100k-200k, 3001.5% for AGIs over 200k)
Taxes paid: $8,838 (reported on 22.9% of returns)
90807:
$8,838
State:
$8,807
(% of AGI for various income ranges: 30.1% for AGIs below $25k, 74.6% for AGIs $25k-50k, 196.3% for AGIs $50k-75k, 416.0% for AGIs $75k-100k, 824.3% for AGIs $100k-200k, 2383.4% for AGIs over 200k)
Earned income credit: $1,791 (reported on 11.8% of returns)
Here:
$1,791
State:
$2,074
(% of AGI for various income ranges: 84.3% for AGIs below $25k, 49.0% for AGIs $25k-50k)
Percentage of individuals using paid preparers for their 2020 taxes: 91.9%
Here:
92%
State:
92%
(% for various income ranges: 89.8% for AGIs below $25k, 91.5% for AGIs $25k-50k, 91.4% for AGIs $50k-75k, 93.8% for AGIs $75k-100k, 93.2% for AGIs $100k-200k, 94.4% for AGIs over 200k)
Averages for the 2012 tax year for zip code 90807, filed in 2013:
Average Adjusted Gross Income (AGI) in 2012: $72,721 (Individual Income Tax Returns)
Here:
$72,721
State:
$72,726
Salary/wage: $61,535 (reported on 82.5% of returns)
Here:
$61,535
State:
$59,079
(% of AGI for various income ranges: 71.3% for AGIs below $25k, 81.7% for AGIs $25k-50k, 81.8% for AGIs $50k-75k, 80.6% for AGIs $75k-100k, 79.7% for AGIs $100k-200k, 45.7% for AGIs over 200k)
Taxable interest for individuals: $2,111 (reported on 38.3% of returns)
This zip code:
$2,111
California:
$2,146
(% of AGI for various income ranges: 0.8% for AGIs below $25k, 0.4% for AGIs $25k-50k, 0.6% for AGIs $50k-75k, 0.7% for AGIs $75k-100k, 0.5% for AGIs $100k-200k, 2.4% for AGIs over 200k)
Ordinary dividends: $8,835 (reported on 18.7% of returns)
Here:
$8,835
State:
$9,308
(% of AGI for various income ranges: 1.3% for AGIs below $25k, 0.9% for AGIs $25k-50k, 0.9% for AGIs $50k-75k, 0.9% for AGIs $75k-100k, 1.0% for AGIs $100k-200k, 5.4% for AGIs over 200k)
Net capital gain/loss in AGI: +$17,653 (reported on 16.1% of returns)
Here:
+$17,653
State:
+$30,460
(% of AGI for various income ranges: 0.1% for AGIs $25k-50k, 0.2% for AGIs $75k-100k, 0.8% for AGIs $100k-200k, 12.4% for AGIs over 200k)
Profit/loss from business: +$14,067 (reported on 18.4% of returns)
Here:
+$14,067
State:
+$17,064
(% of AGI for various income ranges: 11.7% for AGIs below $25k, 4.4% for AGIs $25k-50k, 3.0% for AGIs $50k-75k, 2.9% for AGIs $75k-100k, 2.8% for AGIs $100k-200k, 3.1% for AGIs over 200k)
Taxable individual retirement arrangement distribution: $19,162 (reported on 7.7% of returns)
90807:
$19,162
California:
$19,557
(% of AGI for various income ranges: 2.0% for AGIs below $25k, 1.9% for AGIs $25k-50k, 1.8% for AGIs $50k-75k, 2.0% for AGIs $75k-100k, 2.1% for AGIs $100k-200k, 2.1% for AGIs over 200k)
Self-employment retirement plans: $20,033 (reported on 0.9% of returns)
90807:
$20,033
California:
$24,530
(% of AGI for various income ranges: 0.3% for AGIs $50k-75k, 0.3% for AGIs $100k-200k, 0.5% for AGIs over 200k)
Total itemized deductions: $31,079 (25% of AGI, reported on 45.0% of returns)
Here:
$31,079
State:
$34,004
Here:
25.2% of AGI
State:
22.7% of AGI
(% of AGI for various income ranges: 14.1% for AGIs below $25k, 14.0% for AGIs $25k-50k, 18.7% for AGIs $50k-75k, 21.6% for AGIs $75k-100k, 21.8% for AGIs $100k-200k, 19.1% for AGIs over 200k)
Charity contributions: $4,553 (reported on 39.3% of returns)
Here:
$4,553
State:
$4,659
(% of AGI for various income ranges: 1.0% for AGIs below $25k, 1.6% for AGIs $25k-50k, 2.2% for AGIs $50k-75k, 2.4% for AGIs $75k-100k, 2.3% for AGIs $100k-200k, 3.3% for AGIs over 200k)
Taxes paid: $11,458 (reported on 44.9% of returns)
90807:
$11,458
State:
$14,448
(% of AGI for various income ranges: 2.9% for AGIs below $25k, 3.0% for AGIs $25k-50k, 5.0% for AGIs $50k-75k, 6.9% for AGIs $75k-100k, 8.3% for AGIs $100k-200k, 9.3% for AGIs over 200k)
Earned income credit: $1,964 (reported on 15.6% of returns)
Here:
$1,964
State:
$2,286
(% of AGI for various income ranges: 6.0% for AGIs below $25k, 0.8% for AGIs $25k-50k)
Percentage of individuals using paid preparers for their 2012 taxes: 66.1%
Here:
66%
State:
64%
(% for various income ranges: 61.1% for AGIs below $25k, 65.4% for AGIs $25k-50k, 65.4% for AGIs $50k-75k, 71.3% for AGIs $75k-100k, 71.0% for AGIs $100k-200k, 78.9% for AGIs over 200k)
Averages for the 2004 tax year for zip code 90807, filed in 2005:
Average Adjusted Gross Income (AGI) in 2004: $60,494 (Individual Income Tax Returns)
Here:
$60,494
State:
$58,600
Salary/wage: $53,258 (reported on 83.0% of returns)
Here:
$53,258
State:
$49,455
(% of AGI for various income ranges: 149.9% for AGIs below $10k, 74.1% for AGIs $10k-25k, 85.0% for AGIs $25k-50k, 84.3% for AGIs $50k-75k, 83.1% for AGIs $75k-100k, 61.5% for AGIs over 100k)
Taxable interest for individuals: $2,189 (reported on 49.2% of returns)
This zip code:
$2,189
California:
$2,365
(% of AGI for various income ranges: 10.0% for AGIs below $10k, 2.2% for AGIs $10k-25k, 1.1% for AGIs $25k-50k, 1.2% for AGIs $50k-75k, 1.3% for AGIs $75k-100k, 2.2% for AGIs over 100k)
Taxable dividends: $4,247 (reported on 23.5% of returns)
Here:
$4,247
State:
$4,746
(% of AGI for various income ranges: 7.5% for AGIs below $10k, 1.8% for AGIs $10k-25k, 1.1% for AGIs $25k-50k, 1.1% for AGIs $50k-75k, 0.9% for AGIs $75k-100k, 2.1% for AGIs over 100k)
Net capital gain/loss: +$15,339 (reported on 19.6% of returns)
Here:
+$15,339
State:
+$23,418
(% of AGI for various income ranges: -3.7% for AGIs below $10k, 0.3% for AGIs $10k-25k, 0.3% for AGIs $25k-50k, 0.4% for AGIs $50k-75k, 0.7% for AGIs $75k-100k, 9.9% for AGIs over 100k)
Profit/loss from business: +$14,175 (reported on 17.6% of returns)
Here:
+$14,175
State:
+$16,826
(% of AGI for various income ranges: 9.1% for AGIs below $10k, 8.7% for AGIs $10k-25k, 3.5% for AGIs $25k-50k, 2.7% for AGIs $50k-75k, 3.5% for AGIs $75k-100k, 4.4% for AGIs over 100k)
IRA payment deduction: $3,007 (reported on 3.0% of returns)
90807:
$3,007
California:
$3,192
(% of AGI for various income ranges: 0.6% for AGIs below $10k, 0.2% for AGIs $10k-25k, 0.3% for AGIs $25k-50k, 0.2% for AGIs $50k-75k, 0.1% for AGIs $75k-100k, 0.1% for AGIs over 100k)
Self-employed pension: $15,303 (reported on 1.3% of returns)
Here:
$15,303
California:
$17,688
(% of AGI for various income ranges: 0.1% for AGIs $10k-25k, 0.1% for AGIs $25k-50k, 0.2% for AGIs $50k-75k, 0.3% for AGIs $75k-100k, 0.5% for AGIs over 100k)
Total itemized deductions: $26,502 (27% of AGI, reported on 47.7% of returns)
Here:
$26,502
State:
$28,113
Here:
26.7% of AGI
State:
25.3% of AGI
(% of AGI for various income ranges: 39.3% for AGIs below $10k, 16.0% for AGIs $10k-25k, 18.0% for AGIs $25k-50k, 24.4% for AGIs $50k-75k, 25.5% for AGIs $75k-100k, 19.7% for AGIs over 100k)
Charity contributions deductions: $4,115 (4% of AGI, reported on 43.5% of returns)
Here:
$4,115
State:
$3,923
Here:
4.0% of AGI
State:
3.3% of AGI
(% of AGI for various income ranges: 2.1% for AGIs below $10k, 1.6% for AGIs $10k-25k, 2.4% for AGIs $25k-50k, 3.1% for AGIs $50k-75k, 3.2% for AGIs $75k-100k, 3.2% for AGIs over 100k)
Total tax: $10,060 (reported on 79.2% of returns)
90807:
$10,060
State:
$10,761
(% of AGI for various income ranges: 6.4% for AGIs below $10k, 4.4% for AGIs $10k-25k, 6.9% for AGIs $25k-50k, 9.2% for AGIs $50k-75k, 10.4% for AGIs $75k-100k, 18.5% for AGIs over 100k)
Earned income credit: $1,595 (reported on 12.4% of returns)
Here:
$1,595
State:
$1,763
Percentage of individuals using paid preparers for their 2004 taxes: 68.6%
Here:
69%
State:
66%
(% for various income ranges: 59.4% for AGIs below $10k, 68.5% for AGIs $10k-25k, 68.7% for AGIs $25k-50k, 69.4% for AGIs $50k-75k, 73.0% for AGIs $75k-100k, 75.1% for AGIs over 100k)
Likely homosexual households (counted as self-reported same-sex unmarried-partner households)
Lesbian couples: 0.6% of all households
Gay men: 0.5% of all households
Household received Food Stamps/SNAP in the past 12 months: 1,244 Household did not receive Food Stamps/SNAP in the past 12 months: 11,664
Women who had a birth in the past 12 months: 289 (280 now married, 8 unmarried) Women who did not have a birth in the past 12 months: 7,848 (2,928 now married, 4,927 unmarried)
Housing units in zip code 90807 with a mortgage: 5,322 (643 second mortgage, 44 home equity loan, 487 both second mortgage and home equity loan) Houses without a mortgage: 332
Median monthly owner costs for units with a mortgage: $2,878 Median monthly owner costs for units without a mortgage: $667
Residents with income below the poverty level in 2022:
This zip code:
8.0%
Whole state:
12.2%
Residents with income below 50% of the poverty level in 2022:
This zip code:
3.9%
Whole state:
6.2%
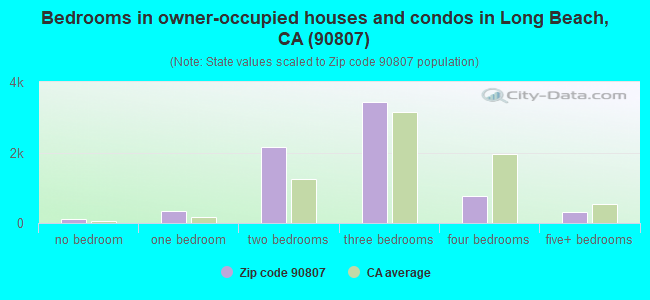
Median number of rooms in houses and condos:
Here:
5.8
State:
6.0
Median number of rooms in apartments:
Here:
3.5
State:
3.9
Notable locations in this zip code not listed on our city pages
Notable locations in zip code 90807: Virginia Country Club (A), Honning Memorial Library (B), La Casa De Rancho Los Cerritos Branch Long Beach Public Library (C), Dana Branch Long Beach Public Library (D), Rancho Los Cerritos Museum (E), Bowers Companies (F), Boeing Fire Department Long Beach (G), City of Long Beach Fire Department Station 16 (H), City of Long Beach Fire Department Station 9 (I). Display/hide their locations on the map
Churches in zip code 90807 include: Bible Presbyterian Church (A), California Heights Baptist Church (B), California Heights United Methodist Church (C), Church of Jesus Christ of Latter Day Saints (D), Saint Barnabas Church (E), Emmanuel Lutheran Church (F), Church of Religious Science (G), First Orthodox Presbyterian Church (H), Lutheran Church of the Holy Trinity (I). Display/hide their locations on the map
Parks in zip code 90807 include: Cherry Avenue Park (1), Los Cerritos Park (2), Somerset Park (3), Bixby Knolls Park (4). Display/hide their locations on the map
3,891 married couples with children.
1,682 single-parent households (729 men, 953 women).
66.3% of residents of 90807 zip code speak English at home.
18.8% of residents speak Spanish at home (75% very well, 14% well, 8% not well, 3% not at all).
2.9% of residents speak other Indo-European language at home (65% very well, 22% well, 12% not well, 1% not at all).
10.7% of residents speak Asian or Pacific Island language at home (63% very well, 20% well, 13% not well, 3% not at all).
1.3% of residents speak other language at home (98% very well, 2% well).
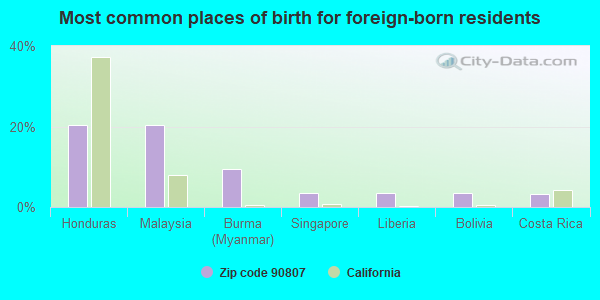
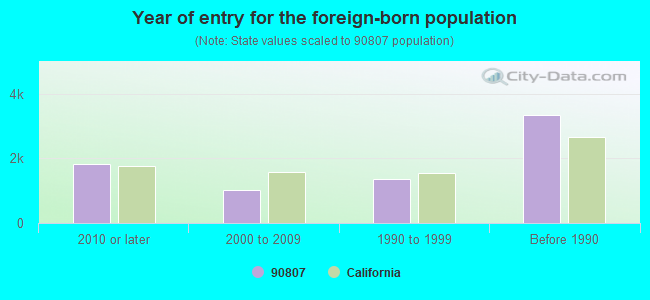
Foreign born population: 7,069 (21.5%) (68.8% of them are naturalized citizens)
Major facilities with environmental interests located in this zip code:
LBUSD HUGHES MIDDLE SCHOOL (3846 CALIFORNIA AVE in LONG BEACH, CA)
STATE MASTER (California - Hazardous Waste Tracking) - HAZARDOU WASTE PROGRAM (National Center for Education Statistics) - STATE ID-6061360 Small Quantity Generators, between 100 kg and 1000 kg of hazardous waste/month (Resource Conservation and Recovery Act (tracking hazardous waste)) - notification Organizations: LONG BEACH UNIFIED SCHOOL DISTRICT (CONTACT/OWNER)
, LONG BEACH UNIFIED (SCHOOL DISTRICT)
LONG BEACH CITATION SERVICE CENTER (3280 AIRFLITE WY in LONG BEACH, CA)
STATE MASTER (California - Hazardous Waste Tracking) - HAZARDOU WASTE PROGRAM HAZARDOUS WASTE BIENNIAL REPORTER (Resource Conservation and Recovery Act (tracking hazardous waste)) Large Quantity Generators, more that 1000 kg of hazardous waste/month (Resource Conservation and Recovery Act (tracking hazardous waste)) Organizations: CESSNA AIRCRAFT CO (CONTACT/OPERATOR)
, TOYOTA MOTOR CO (CONTACT/OWNER)
Alternative names: CESSNA AIRCRAFT CO THE
MC DONNEL DOUGLAS (3460 CHERRY AVE in LONG BEACH, CA)
STATE MASTER (California - Hazardous Waste Tracking) - HAZARDOU WASTE PROGRAM Large Quantity Generators, more that 1000 kg of hazardous waste/month (Resource Conservation and Recovery Act (tracking hazardous waste)) - notification Organizations: MC DONNEL DOUGLAS CORP (CONTACT/OWNER)
Alternative names: MCDONNELL DOUGLAS
CERTIFIED ALLOY PRODUCTS INCORPORATED (3245 CHERRY AVE. in LONG BEACH, CA)
STATE MASTER (California - Hazardous Waste Tracking) - HAZARDOU WASTE PROGRAM COMPLIANCE ACTIVITY (Tracking inspections of insecticide, fungicide, and rodenticide, and toxic substances) Small Quantity Generators, between 100 kg and 1000 kg of hazardous waste/month (Resource Conservation and Recovery Act (tracking hazardous waste)) TRI REPORTER (Tracking of toxic chemicals releasing facilities) Business SIC classification: SECONDARY SMELTING AND REFINING OF NONFERROUS METALS; ROLLING, DRAWING, AND EXTRUDING OF NONFERROUS METALS, EXCEPT COPPER AND ALUMINUM Business NAICS classification: IRON AND STEEL MILLS.; STEEL FOUNDRIES (EXCEPT INVESTMENT).; OTHER COMMUNICATION AND ENERGY WIRE MANUFACTURING.
INTERNATIONAL MOTORS (1079 E WARDLOW RD in LONG BEACH, CA)
STATE MASTER (California - Hazardous Waste Tracking) - HAZARDOU WASTE PROGRAM Small Quantity Generators, between 100 kg and 1000 kg of hazardous waste/month (Resource Conservation and Recovery Act (tracking hazardous waste)) - notification Business NAICS classification: GENERAL AUTOMOTIVE REPAIR.
JACK STONE DRAINAGE OIL SERVICE (342 MYRTLE AV in LONG BEACH, CA)
STATE MASTER (California - Hazardous Waste Tracking) - HAZARDOU WASTE PROGRAM TRANSPORTER (Resource Conservation and Recovery Act (tracking hazardous waste)) - notification
CHEVRON STATION NO 95919 (4040 ATLANTIC AVE in LONG BEACH, CA)
STATE MASTER (California - Hazardous Waste Tracking) - HAZARDOU WASTE PROGRAM Small Quantity Generators, between 100 kg and 1000 kg of hazardous waste/month (Resource Conservation and Recovery Act (tracking hazardous waste)) - notification Organizations: CHEVRON PRODUCTS CO (CONTACT/OWNER)
Alternative names: BILLS CHEVRON STATION
LONG BEACH USD-LONGFELLOW ELEMENTARY (3800 OLIVE AVENUE in LONG BEACH, CA)
(National Center for Education Statistics) - STATE ID-6015457 Small Quantity Generators, between 100 kg and 1000 kg of hazardous waste/month (Resource Conservation and Recovery Act (tracking hazardous waste)) Organizations: LONG BEACH UNIFIED (SCHOOL DISTRICT)
LONG BEACH USD-BARTON ELEMENTARY (1100 EAST DEL AMO BLVD in LONG BEACH, CA)
(National Center for Education Statistics) - STATE ID-6015135 Small Quantity Generators, between 100 kg and 1000 kg of hazardous waste/month (Resource Conservation and Recovery Act (tracking hazardous waste)) Organizations: LONG BEACH UNIFIED (SCHOOL DISTRICT)
BAO THO MOBIL (1990 E WARDLOW in LONG BEACH, CA)
STATE MASTER (California - Hazardous Waste Tracking) - HAZARDOU WASTE PROGRAM Small Quantity Generators, between 100 kg and 1000 kg of hazardous waste/month (Resource Conservation and Recovery Act (tracking hazardous waste)) - notification Alternative names: THO'S MOBIL
EQUILON ENTERPRISES LLC (3009 LONG BEACH BLVD in LONG BEACH, CA) . Federal Facility
STATE MASTER (California - Hazardous Waste Tracking) - HAZARDOU WASTE PROGRAM Small Quantity Generators, between 100 kg and 1000 kg of hazardous waste/month (Resource Conservation and Recovery Act (tracking hazardous waste)) - notification Organizations: EQUILON ENTERPRISES, LLC (CONTACT/OWNER)
Alternative names: SHELL OIL CO
LONG BEACH AUTO CLINIC (3190 LONG BEACH BLVD in LONG BEACH, CA)
STATE MASTER (California - Hazardous Waste Tracking) - HAZARDOU WASTE PROGRAM Small Quantity Generators, between 100 kg and 1000 kg of hazardous waste/month (Resource Conservation and Recovery Act (tracking hazardous waste)) - notification Organizations: LARRY STROUP (CONTACT/OWNER)
ENVIRONMENTAL TREAT AND TECH INC (3283 WALNUT AVE in SIGNAL HILL, CA)
STATE MASTER (California - Hazardous Waste Tracking) - HAZARDOU WASTE PROGRAM Small Quantity Generators, between 100 kg and 1000 kg of hazardous waste/month (Resource Conservation and Recovery Act (tracking hazardous waste)) - notification Organizations: ED CABALLERO (CONTACT/OWNER)
Housing units lacking complete plumbing facilities: 0.3% Housing units lacking complete kitchen facilities: 3.8%
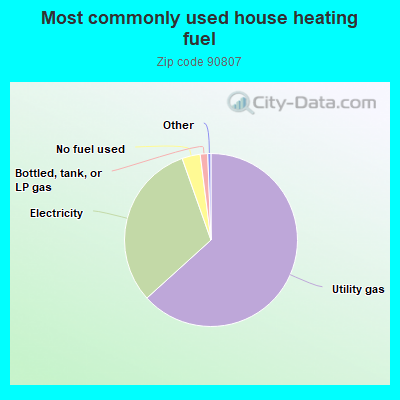
63.3%Utility gas
31.3%Electricity
3.4%No fuel used
1.4%Bottled, tank, or LP gas
Population in 1990: 28,037. Population change in the 1990s: +3,512 (+12.5%).
Place of birth for U.S.-born residents:
This state: 19,806
Northeast: 1,308
Midwest: 1,656
South: 1,699
West: 829
50% of the 90807 zip code residents lived in the same house 5 years ago. Out of people who lived in different houses, 79% lived in this county. Out of people who lived in different counties, 50% lived in California.
89% of the 90807 zip code residents lived in the same house 1 year ago. Out of people who lived in different houses, 62% moved from this county. Out of people who lived in different houses, 9% moved from different county within same state. Out of people who lived in different houses, 17% moved from different state. Out of people who lived in different houses, 14% moved from abroad.
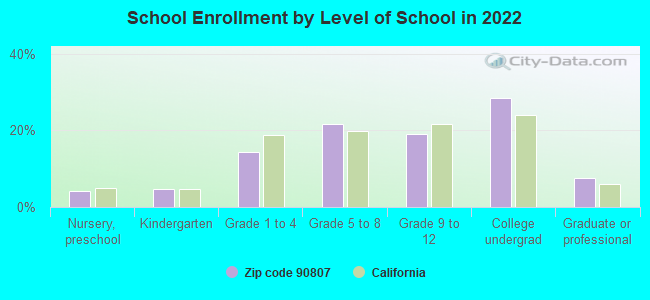
Private vs. public school enrollment:
Students in private schools in grades 1 to 8 (elementary and middle school): 310
Here:
10.8%
California:
10.5%
Students in private schools in grades 9 to 12 (high school): 102
Here:
6.7%
California:
8.5%
Students in private undergraduate colleges: 254
Here:
11.2%
California:
15.9%
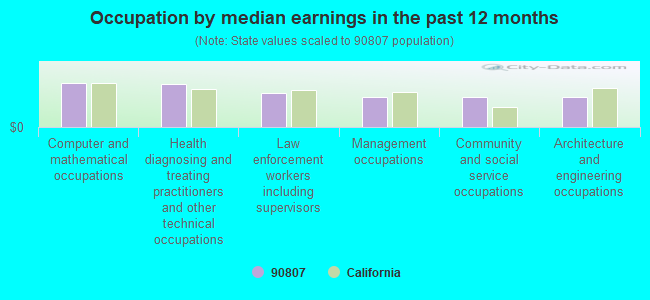
Occupation by median earnings in the past 12 months ($)
114,085Computer and mathematical occupations
111,426Health diagnosing and treating practitioners and other technical occupations
88,134Law enforcement workers including supervisors
78,139Management occupations
78,119Community and social service occupations
77,350Architecture and engineering occupations
Companies with biggest federal contracts located in this zip code (LONG BEACH, CA):
MCDONNELL DOUGLAS CORPORATION (2401 E WARDLOW ROAD) : $23,597,988,519 in 1705 contractsfrom 1999 to 2006
Contracts for Aircraft, Fixed Wing, Defense Aircraft -- Operational Systems Development (R&D), Defense Aircraft -- Engineering Development (R&D), Systems Engineering Services, and moreby Air Force, Navy, Department of Defense, NASA, and others Signed by year:2000: $3,192,003,205; 2001: $2,871,134,834; 2002: $3,673,661,174; 2003: $3,511,296,471; 2004: $4,300,458,328; 2005: $2,854,463,585; 2006: $2,751,039,316.
Biggest contracts:
$2,395,825,177 with Air Force for Aircraft, Fixed Wing. Signed on 2002-03-14. Completion date: 2004-11-30.
$2,336,189,128, same as above.Signed on 2005-02-01. Completion date: 2008-07-18.
$2,206,324,868, same as above.Signed on 2000-05-31. Completion date: 2004-11-30.
$2,027,523,060, same as above.Signed on 2006-02-24. Completion date: 2008-07-18.
MOFFATT & NICHOL ENGINEERS (IN (250 W WARDLOW RD) : $10,711,487 in 18 contractsfrom 2003 to 2006
Contracts for Engineering Drafting Services, Other Architect and Engineering Services, Architect - Engineer Services (including landscaping, interior layout, and designing), Other Professional Services by U.S. Fish and Wildlife Service, U.S. Army Corps of Engineers - civil program financing only, Army, Federal Highway Administration, and others Signed by year:2000: $0; 2001: $0; 2002: $0; 2003: $4,567,887; 2004: $5,002,535; 2005: $516,222; 2006: $624,843.
Biggest contracts:
$4,864,659 with U.S. Fish and Wildlife Service for Engineering Drafting Services. Signed on 2004-05-31. Effective on 2004-04-08. Completion date: 2005-09-30.
$4,567,887, same as above.Signed on 2003-04-15. Completion date: 2004-05-15.
$491,000, same as above.Signed on 2006-03-06. Completion date: 2006-12-31.
$198,552 with U.S. Army Corps of Engineers - civil program financing only for Other Architect and Engineering Services. Taking place in OR. Signed on 2005-08-31. Completion date: 2005-09-30.
STEARNS CONRAD AND SCHMIDT, CO (3711 LONG BEACH BLVD, SUIT; small business) : $8,002,963 in 94 contractsfrom 2000 to 2005
Contracts for Environmental Studies and Assessments, Other Environmental Services, Studies, and Analytical Support, Architect - Engineer Services (including landscaping, interior layout, and designing), Other Housekeeping Services, and moreby U.S. Army Corps of Engineers - civil program financing only, Army, Navy, Public Buildings Service, and others Signed by year:2000: $24,846; 2001: $721,487; 2002: $2,745,223; 2003: $1,784,277; 2004: $2,493,116; 2005: $234,014; 2006: $0.
Biggest contracts:
$1,714,548 with U.S. Army Corps of Engineers - civil program financing only for Environmental Studies and Assessments. Taking place in WA. Signed on 2002-08-23. Completion date: 2003-03-23.
$384,791, same as above.Signed on 2003-09-29. Completion date: 2003-12-30.
$369,258, same as above.Signed on 2003-04-22. Completion date: 2003-07-15.
$359,640 with U.S. Army Corps of Engineers - civil program financing only for Other Environmental Services, Studies, and Analytical Support. Taking place in OR. Signed on 2001-09-25. Completion date: 2002-09-09.
STRONGHOLD ENGINEERING INC (4647 LONG BEACH BLVD STE D; small business) : $75,228 in 2 contractsfrom 2003 to 2004
$88,000 with Air Force for Maintenance, Repair or Alteration of Real Property -- Other Administrative Facilities and Service Buildings. Signed on 2003-09-22. Completion date: 2003-01-06.
-$12,772, same as above.Signed on 2004-10-21. Completion date: 2004-01-05.
R L KLEIN & ASSOCIATES (3939 ATLANTIC AVE STE 100; small business)
$61,672 with Air Force for Other Professional Services. Signed on 2006-06-05. Completion date: 2007-06-04.
PAMCOR INC (4000 LONG BEACH BLVD; small business)
$54,270 with Navy for Antennas, Waveguides, and Related Equipment. Signed on 2005-09-22. Completion date: 2006-02-01.
HILL CRANE SERVICE INC (3333 CHERRY AVE; small business) : $48,815 in 9 contractsfrom 2004 to 2006
Contracts for Cranes and Crane-Shovels, Hardware, Commercial, Lease or Rental of Equipment -- Ground Effect Vehicles, Motor Vehicles, Trailers, and Cycles by Army Signed by year:2000: $0; 2001: $0; 2002: $0; 2003: $0; 2004: $26,216; 2005: $19,439; 2006: $3,160.
Biggest contracts:
$12,233 with Army for Cranes and Crane-Shovels. Signed on 2004-09-19. Completion date: 2004-09-01.
$8,203, same as above.Signed on 2004-09-07. Completion date: 2004-07-23.
$5,838, same as above.Signed on 2005-08-24. Completion date: 2005-08-10.
$5,780 with Army for Hardware, Commercial. Signed on 2004-12-17. Completion date: 2004-12-09.
P&T PROCUREMENT, INC (3633 LONG BEACH BLVD SUITE; small business)
$36,678 with Air Force for Tableware. Taking place in HI. Signed on 2001-04-02. Completion date: 2001-04-25.
WESTCODE SEMICONDUCTORS INC (3270 CHERRY AVE)
$31,785 with Defense Logistics Agency for Semiconductor Devices and Associated Hardware. Signed on 2001-07-03. Completion date: 2002-01-11.
KATZ, JACKSON (3860 BRAYTON AVE; small business) : $14,060 in 2 contractsin 2005
$10,000 with Navy for Lectures For Training. Signed on 2005-08-31. Completion date: 2005-09-23.
$4,060 with Army for ADP Software, Equipment, and Telecommunications Training. Signed on 2005-10-31. Completion date: 2005-10-11.
Top industries in this zip code by the number of employees in 2005:
Administrative and Support and Waste Management and Remediation Services: Temporary Help Services (250-499 employees: 1 establishment, 100-249 employees: 2 establishments, 50-99 employees: 2 establishments, 20-49 employees: 1 establishment, 10-19 employees: 1 establishment, 1-4 employees: 1 establishment)
Administrative and Support and Waste Management and Remediation Services: Security Guards and Patrol Services (250-499: 2, 10-19: 2, 5-9: 1)
2005 - 2018 National Fire Incident Reporting System (NFIRS) incidents
Based on the data from the years 2005 - 2018 the average number of fire incidents per year is 42. The highest number of reported fires - 79 took place in 2007, and the least - 0 in 2013. The data has a decreasing trend.
When looking into fire subcategories, the most reports belonged to: Structure Fires (34.2%), and Outside Fires (32.0%).
Fire incident types reported to NFIRS in Zip Code 90807


 Nearest zip codes: 90755, 90806, 90712, 90805, 90810, 90813.


 Based on the data from the years 2005 - 2018 the average number of fire incidents per year is 42. The highest number of reported fires - 79 took place in 2007, and the least - 0 in 2013. The data has a decreasing trend.
 When looking into fire subcategories, the most reports belonged to: Structure Fires (34.2%), and Outside Fires (32.0%).