Estimated zip code population in 2022: 31,290 Zip code population in 2010: 31,499 Zip code population in 2000: 30,171
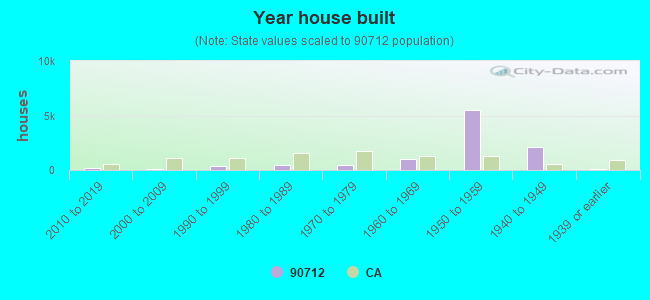
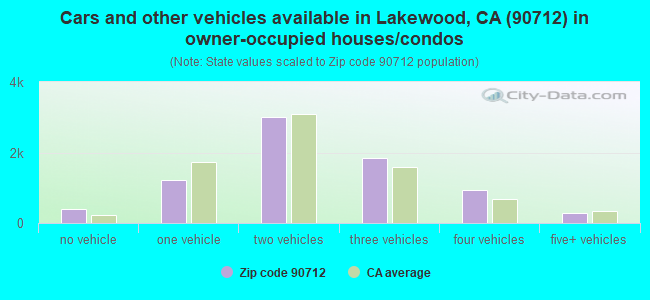
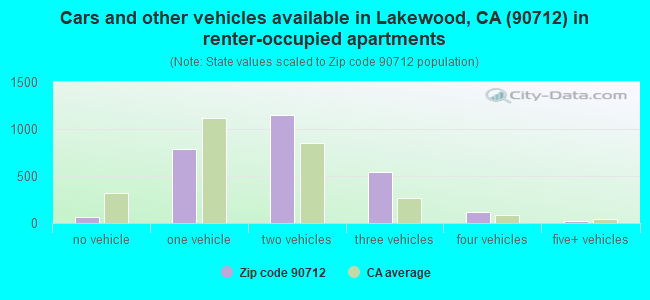
Houses and condos: 10,519 Renter-occupied apartments: 2,695
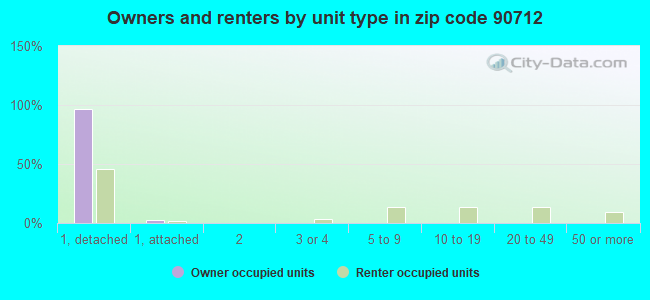
% of renters here:
26%
State:
44%
March 2022 cost of living index in zip code 90712: 132.6 (high, U.S. average is 100)
Land area: 4.3 sq. mi. Water area: 0.0 sq. mi.
Population density: 7,300 people per square mile
(high).
OSM Map
General Map
Google Map
MSN Map
OSM Map
General Map
Google Map
MSN Map
OSM Map
General Map
Google Map
MSN Map
OSM Map
General Map
Google Map
MSN Map
Please wait while loading the map...
Real estate property taxes paid for housing units in 2022:
This zip code:
0.7% ($5,258)
California:
0.7% ($4,831)
Median real estate property taxes paid for housing units with mortgages in 2022: $5,810 (0.8%) Median real estate property taxes paid for housing units with no mortgage in 2022: $4,298 (0.6%)
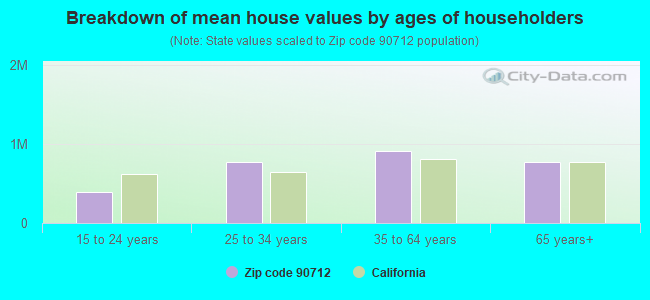
Estimated median house/condo value in 2022: $756,185
90712:
$756,185
California:
$715,900
According to our research of California and other state lists, there were 27 registered sex offenders living in 90712 zip code as of April 27, 2024. The ratio of all residents to sex offenders in zip code 90712 is 1,192 to 1. The ratio of registered sex offenders to all residents in this zip code is lower than the state average.
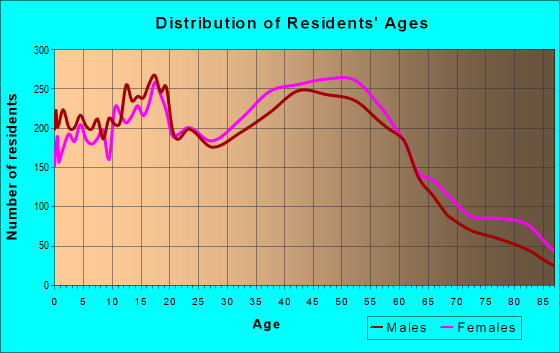
Median resident age:
This zip code:
38.4 years
California median age:
37.9 years
Average household size:
This zip code:
3.0 people
California:
2.8 people
Averages for the 2020 tax year for zip code 90712, filed in 2021:
Average Adjusted Gross Income (AGI) in 2020: $79,857 (Individual Income Tax Returns)
Here:
$79,857
State:
$95,910
Salary/wage: $73,327 (reported on 82.6% of returns)
Here:
$73,327
State:
$77,331
(% of AGI for various income ranges: 1148.6% for AGIs below $25k, 3876.7% for AGIs $25k-50k, 7234.6% for AGIs $50k-75k, 10514.9% for AGIs $75k-100k, 20922.2% for AGIs $100k-200k, 67899.3% for AGIs over 200k)
Taxable interest for individuals: $812 (reported on 41.7% of returns)
This zip code:
$812
California:
$2,294
(% of AGI for various income ranges: 18.8% for AGIs below $25k, 24.7% for AGIs $25k-50k, 36.4% for AGIs $50k-75k, 50.7% for AGIs $75k-100k, 86.9% for AGIs $100k-200k, 510.7% for AGIs over 200k)
Ordinary dividends: $3,041 (reported on 17.0% of returns)
Here:
$3,041
State:
$10,949
(% of AGI for various income ranges: 20.2% for AGIs below $25k, 26.7% for AGIs $25k-50k, 62.8% for AGIs $50k-75k, 74.1% for AGIs $75k-100k, 112.2% for AGIs $100k-200k, 1079.7% for AGIs over 200k)
Net capital gain/loss in AGI: +$11,516 (reported on 17.1% of returns)
Here:
+$11,516
State:
+$49,306
(% of AGI for various income ranges: 10.9% for AGIs below $25k, 32.4% for AGIs $25k-50k, 47.6% for AGIs $50k-75k, 70.9% for AGIs $75k-100k, 233.3% for AGIs $100k-200k, 8628.3% for AGIs over 200k)
Profit/loss from business: +$8,516 (reported on 16.3% of returns)
Here:
+$8,516
State:
+$15,671
(% of AGI for various income ranges: 95.1% for AGIs below $25k, 136.3% for AGIs $25k-50k, 147.6% for AGIs $50k-75k, 182.6% for AGIs $75k-100k, 229.7% for AGIs $100k-200k, 2674.8% for AGIs over 200k)
Taxable individual retirement arrangement distribution: $20,528 (reported on 7.1% of returns)
90712:
$20,528
California:
$23,505
(% of AGI for various income ranges: 54.0% for AGIs below $25k, 87.7% for AGIs $25k-50k, 193.8% for AGIs $50k-75k, 253.6% for AGIs $75k-100k, 506.7% for AGIs $100k-200k, 1332.4% for AGIs over 200k)
Self-employed (Keogh) retirement plans: $17,740 (reported on 0.3% of returns)
90712:
$17,740
California:
$30,163
(% of AGI for various income ranges: 14.4% for AGIs $50k-75k, 226.2% for AGIs over 200k)
Total itemized deductions: $30,641 (reported on 24.9% of returns)
Here:
$30,641
State:
$39,517
(% of AGI for various income ranges: 118.0% for AGIs below $25k, 290.2% for AGIs $25k-50k, 775.0% for AGIs $50k-75k, 1511.4% for AGIs $75k-100k, 2999.0% for AGIs $100k-200k, 7764.5% for AGIs over 200k)
Charity contributions: $5,700 (reported on 21.3% of returns)
Here:
$5,700
State:
$12,598
(% of AGI for various income ranges: 6.7% for AGIs below $25k, 35.0% for AGIs $25k-50k, 109.0% for AGIs $50k-75k, 198.0% for AGIs $75k-100k, 467.1% for AGIs $100k-200k, 1764.8% for AGIs over 200k)
Taxes paid: $9,071 (reported on 24.9% of returns)
90712:
$9,071
State:
$8,807
(% of AGI for various income ranges: 22.9% for AGIs below $25k, 69.0% for AGIs $25k-50k, 227.9% for AGIs $50k-75k, 485.9% for AGIs $75k-100k, 937.4% for AGIs $100k-200k, 2039.7% for AGIs over 200k)
Earned income credit: $1,693 (reported on 10.0% of returns)
Here:
$1,693
State:
$2,074
(% of AGI for various income ranges: 58.9% for AGIs below $25k, 49.1% for AGIs $25k-50k, 0.6% for AGIs $50k-75k)
Percentage of individuals using paid preparers for their 2020 taxes: 92.2%
Here:
92%
State:
92%
(% for various income ranges: 91.5% for AGIs below $25k, 92.2% for AGIs $25k-50k, 92.6% for AGIs $50k-75k, 92.6% for AGIs $75k-100k, 92.6% for AGIs $100k-200k, 91.6% for AGIs over 200k)
Averages for the 2012 tax year for zip code 90712, filed in 2013:
Average Adjusted Gross Income (AGI) in 2012: $63,090 (Individual Income Tax Returns)
Here:
$63,090
State:
$72,726
Salary/wage: $60,538 (reported on 84.8% of returns)
Here:
$60,538
State:
$59,079
(% of AGI for various income ranges: 73.1% for AGIs below $25k, 79.3% for AGIs $25k-50k, 83.1% for AGIs $50k-75k, 83.7% for AGIs $75k-100k, 86.3% for AGIs $100k-200k, 64.4% for AGIs over 200k)
Taxable interest for individuals: $785 (reported on 42.2% of returns)
This zip code:
$785
California:
$2,146
(% of AGI for various income ranges: 1.1% for AGIs below $25k, 0.6% for AGIs $25k-50k, 0.4% for AGIs $50k-75k, 0.5% for AGIs $75k-100k, 0.3% for AGIs $100k-200k, 1.0% for AGIs over 200k)
Ordinary dividends: $2,755 (reported on 17.5% of returns)
Here:
$2,755
State:
$9,308
(% of AGI for various income ranges: 1.2% for AGIs below $25k, 0.8% for AGIs $25k-50k, 0.5% for AGIs $50k-75k, 0.5% for AGIs $75k-100k, 0.5% for AGIs $100k-200k, 2.1% for AGIs over 200k)
Net capital gain/loss in AGI: +$3,181 (reported on 13.3% of returns)
Here:
+$3,181
State:
+$30,460
(% of AGI for various income ranges: 0.3% for AGIs $100k-200k, 5.5% for AGIs over 200k)
Profit/loss from business: +$9,397 (reported on 14.8% of returns)
Here:
+$9,397
State:
+$17,064
(% of AGI for various income ranges: 8.2% for AGIs below $25k, 3.4% for AGIs $25k-50k, 1.7% for AGIs $50k-75k, 1.4% for AGIs $75k-100k, 1.0% for AGIs $100k-200k, 3.9% for AGIs over 200k)
Taxable individual retirement arrangement distribution: $15,566 (reported on 8.6% of returns)
90712:
$15,566
California:
$19,557
(% of AGI for various income ranges: 3.1% for AGIs below $25k, 2.4% for AGIs $25k-50k, 1.7% for AGIs $50k-75k, 1.9% for AGIs $75k-100k, 1.9% for AGIs $100k-200k, 3.1% for AGIs over 200k)
Self-employment retirement plans: $11,080 (reported on 0.3% of returns)
90712:
$11,080
California:
$24,530
Total itemized deductions: $26,668 (27% of AGI, reported on 48.0% of returns)
Here:
$26,668
State:
$34,004
Here:
27.4% of AGI
State:
22.7% of AGI
(% of AGI for various income ranges: 13.3% for AGIs below $25k, 16.5% for AGIs $25k-50k, 21.1% for AGIs $50k-75k, 22.3% for AGIs $75k-100k, 21.8% for AGIs $100k-200k, 18.7% for AGIs over 200k)
Charity contributions: $3,212 (reported on 41.8% of returns)
Here:
$3,212
State:
$4,659
(% of AGI for various income ranges: 0.9% for AGIs below $25k, 1.7% for AGIs $25k-50k, 2.2% for AGIs $50k-75k, 2.1% for AGIs $75k-100k, 2.2% for AGIs $100k-200k, 2.8% for AGIs over 200k)
Taxes paid: $8,755 (reported on 47.8% of returns)
90712:
$8,755
State:
$14,448
(% of AGI for various income ranges: 2.5% for AGIs below $25k, 3.5% for AGIs $25k-50k, 5.6% for AGIs $50k-75k, 6.9% for AGIs $75k-100k, 7.8% for AGIs $100k-200k, 9.4% for AGIs over 200k)
Earned income credit: $1,938 (reported on 12.9% of returns)
Here:
$1,938
State:
$2,286
(% of AGI for various income ranges: 4.8% for AGIs below $25k, 0.8% for AGIs $25k-50k)
Percentage of individuals using paid preparers for their 2012 taxes: 67.3%
Here:
67%
State:
64%
(% for various income ranges: 60.4% for AGIs below $25k, 65.9% for AGIs $25k-50k, 70.0% for AGIs $50k-75k, 74.2% for AGIs $75k-100k, 72.1% for AGIs $100k-200k, 80.6% for AGIs over 200k)
Averages for the 2004 tax year for zip code 90712, filed in 2005:
Average Adjusted Gross Income (AGI) in 2004: $53,874 (Individual Income Tax Returns)
Here:
$53,874
State:
$58,600
Salary/wage: $51,529 (reported on 85.1% of returns)
Here:
$51,529
State:
$49,455
(% of AGI for various income ranges: 118.4% for AGIs below $10k, 70.4% for AGIs $10k-25k, 81.4% for AGIs $25k-50k, 86.4% for AGIs $50k-75k, 89.4% for AGIs $75k-100k, 74.7% for AGIs over 100k)
Taxable interest for individuals: $1,219 (reported on 54.5% of returns)
This zip code:
$1,219
California:
$2,365
(% of AGI for various income ranges: 8.6% for AGIs below $10k, 2.8% for AGIs $10k-25k, 1.4% for AGIs $25k-50k, 0.9% for AGIs $50k-75k, 0.6% for AGIs $75k-100k, 1.3% for AGIs over 100k)
Taxable dividends: $1,930 (reported on 22.4% of returns)
Here:
$1,930
State:
$4,746
(% of AGI for various income ranges: 4.1% for AGIs below $10k, 1.3% for AGIs $10k-25k, 0.7% for AGIs $25k-50k, 0.7% for AGIs $50k-75k, 0.3% for AGIs $75k-100k, 1.0% for AGIs over 100k)
Net capital gain/loss: +$7,942 (reported on 17.0% of returns)
Here:
+$7,942
State:
+$23,418
(% of AGI for various income ranges: -2.4% for AGIs below $10k, -0.2% for AGIs $10k-25k, 0.0% for AGIs $25k-50k, 0.5% for AGIs $50k-75k, 0.5% for AGIs $75k-100k, 6.4% for AGIs over 100k)
Profit/loss from business: +$10,604 (reported on 14.4% of returns)
Here:
+$10,604
State:
+$16,826
(% of AGI for various income ranges: 3.3% for AGIs below $10k, 6.8% for AGIs $10k-25k, 3.9% for AGIs $25k-50k, 1.7% for AGIs $50k-75k, 1.4% for AGIs $75k-100k, 3.2% for AGIs over 100k)
IRA payment deduction: $3,085 (reported on 2.5% of returns)
90712:
$3,085
California:
$3,192
(% of AGI for various income ranges: 0.3% for AGIs $10k-25k, 0.2% for AGIs $25k-50k, 0.1% for AGIs $50k-75k, 0.1% for AGIs $75k-100k, 0.1% for AGIs over 100k)
Self-employed pension: $10,861 (reported on 0.6% of returns)
Here:
$10,861
California:
$17,688
(% of AGI for various income ranges: 0.1% for AGIs $25k-50k, 0.1% for AGIs $50k-75k, 0.1% for AGIs $75k-100k, 0.2% for AGIs over 100k)
Total itemized deductions: $24,238 (30% of AGI, reported on 50.5% of returns)
Here:
$24,238
State:
$28,113
Here:
29.6% of AGI
State:
25.3% of AGI
(% of AGI for various income ranges: 25.6% for AGIs below $10k, 13.5% for AGIs $10k-25k, 20.3% for AGIs $25k-50k, 25.1% for AGIs $50k-75k, 26.3% for AGIs $75k-100k, 21.8% for AGIs over 100k)
Charity contributions deductions: $3,056 (4% of AGI, reported on 46.7% of returns)
Here:
$3,056
State:
$3,923
Here:
3.7% of AGI
State:
3.3% of AGI
(% of AGI for various income ranges: 1.3% for AGIs below $10k, 1.3% for AGIs $10k-25k, 2.2% for AGIs $25k-50k, 2.7% for AGIs $50k-75k, 2.9% for AGIs $75k-100k, 2.9% for AGIs over 100k)
Total tax: $6,688 (reported on 80.5% of returns)
90712:
$6,688
State:
$10,761
(% of AGI for various income ranges: 4.0% for AGIs below $10k, 4.4% for AGIs $10k-25k, 6.6% for AGIs $25k-50k, 8.0% for AGIs $50k-75k, 8.7% for AGIs $75k-100k, 14.4% for AGIs over 100k)
Earned income credit: $1,555 (reported on 10.1% of returns)
Here:
$1,555
State:
$1,763
Percentage of individuals using paid preparers for their 2004 taxes: 68.0%
Here:
68%
State:
66%
(% for various income ranges: 55.4% for AGIs below $10k, 65.4% for AGIs $10k-25k, 68.9% for AGIs $25k-50k, 71.8% for AGIs $50k-75k, 72.9% for AGIs $75k-100k, 74.7% for AGIs over 100k)
Likely homosexual households (counted as self-reported same-sex unmarried-partner households)
Lesbian couples: 0.3% of all households
Gay men: 0.1% of all households
Household received Food Stamps/SNAP in the past 12 months: 709 Household did not receive Food Stamps/SNAP in the past 12 months: 9,532
Women who had a birth in the past 12 months: 489 (368 now married, 121 unmarried) Women who did not have a birth in the past 12 months: 7,587 (3,112 now married, 4,470 unmarried)
Housing units in zip code 90712 with a mortgage: 5,337 (259 second mortgage, 5 home equity loan, 211 both second mortgage and home equity loan) Houses without a mortgage: 123
Median monthly owner costs for units with a mortgage: $2,706 Median monthly owner costs for units without a mortgage: $626
Residents with income below the poverty level in 2022:
This zip code:
4.5%
Whole state:
12.2%
Residents with income below 50% of the poverty level in 2022:
This zip code:
2.0%
Whole state:
6.2%
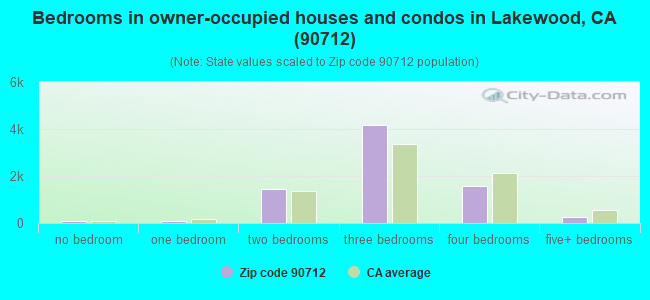
Median number of rooms in houses and condos:
Here:
6.0
State:
6.0
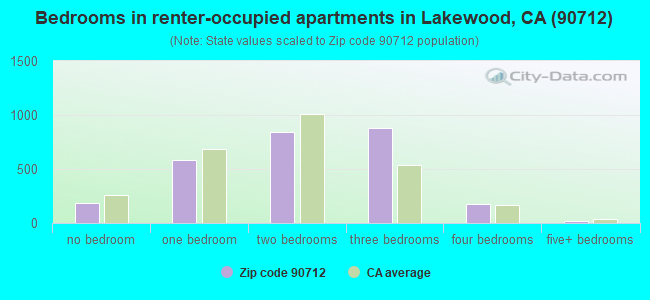
Median number of rooms in apartments:
Here:
4.3
State:
3.9
Notable locations in this zip code not listed on our city pages
Notable locations in zip code 90712: Lakewood Golf Course (A), Angelo M Iacoboni Branch County of Los Angeles Public Library (B), Lakewood City Hall (C), Lakewood Sheriffs Station (D), Los Angeles County Fire Department Station 122 (E), Los Angeles County Fire Department Station 45 (F). Display/hide their locations on the map
Shopping Centers: Sycamore Plaza Shopping Center (1), Lakewood Square Shopping Center (2), Lakewood Center Mall Shopping Center (3), Color Corner Shopping Center (4). Display/hide their locations on the map
Churches in zip code 90712 include: Holy Trinity Catholic Church (A), West Lakewood Baptist Church (B), Lakewood Christ Presbyterian Church (C), Saint Pancratius Catholic Church (D), Mount Olivet Lutheran Church (E), Calvary Apostolic Tabernacle (F). Display/hide their locations on the map
Parks in zip code 90712 include: Biscailuz Park (1), Mayfair Park (2), Simon Bolivar Park (3), Cherry Cove Park (4), Michelson Street Park (5). Display/hide their locations on the map
4,705 married couples with children.
1,174 single-parent households (274 men, 900 women).
63.2% of residents of 90712 zip code speak English at home.
21.2% of residents speak Spanish at home (77% very well, 13% well, 9% not well, 1% not at all).
2.4% of residents speak other Indo-European language at home (81% very well, 11% well, 8% not well).
12.0% of residents speak Asian or Pacific Island language at home (68% very well, 24% well, 7% not well, 2% not at all).
1.0% of residents speak other language at home (71% very well, 15% well, 14% not well).
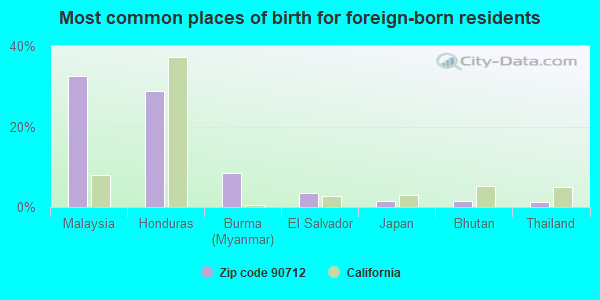
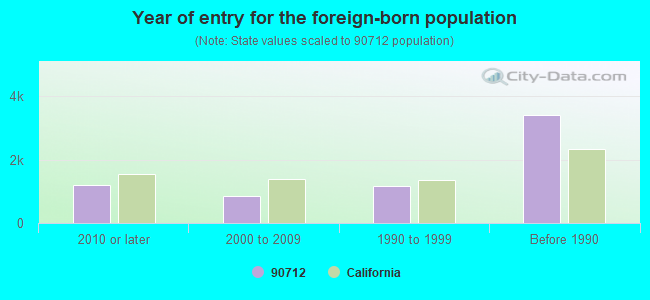
Foreign born population: 6,158 (19.7%) (70.5% of them are naturalized citizens)
Major facilities with environmental interests located in this zip code:
LONG BEACH USD-HOLMES ELEMENTARY (5020 BARLIN in LAKEWOOD, CA)
(National Center for Education Statistics) - STATE ID-6015374 Small Quantity Generators, between 100 kg and 1000 kg of hazardous waste/month (Resource Conservation and Recovery Act (tracking hazardous waste)) Organizations: LONG BEACH UNIFIED (SCHOOL DISTRICT)
LONG BEACH USD-MADISON ELEMENTARY (2801 BOMBERRY STREET in LAKEWOOD, CA)
(National Center for Education Statistics) - STATE ID-6015499 Small Quantity Generators, between 100 kg and 1000 kg of hazardous waste/month (Resource Conservation and Recovery Act (tracking hazardous waste)) Organizations: LONG BEACH UNIFIED (SCHOOL DISTRICT)
LONG BEACH USD-RILEY ELEMENTARY (3319 SANDWOOD STREET in LAKEWOOD, CA)
(National Center for Education Statistics) - STATE ID-6015598 Small Quantity Generators, between 100 kg and 1000 kg of hazardous waste/month (Resource Conservation and Recovery Act (tracking hazardous waste)) Organizations: LONG BEACH UNIFIED (SCHOOL DISTRICT)
IMMEDIATE MEDICAL CARE CTR (5203 LAKEWOOD BLVD in LAKEWOOD, CA)
STATE MASTER (California - Hazardous Waste Tracking) - HAZARDOU WASTE PROGRAM Small Quantity Generators, between 100 kg and 1000 kg of hazardous waste/month (Resource Conservation and Recovery Act (tracking hazardous waste)) - notification Business NAICS classification: OFFICES OF PHYSICIANS, MENTAL HEALTH SPECIALISTS. Organizations: ALEX GUTMAN (CONTACT/OWNER)
LONG BEACH USD HOOVER JUNIOR HIGH SCHOOL (3501 COUNTRY CLUB DRIVE in LAKEWOOD, CA)
STATE MASTER (California - Hazardous Waste Tracking) - HAZARDOU WASTE PROGRAM Small Quantity Generators, between 100 kg and 1000 kg of hazardous waste/month (Resource Conservation and Recovery Act (tracking hazardous waste)) Alternative names: LBUSD-HOOVER JUNIOR HIGH, LONG BEACH USD-HOOVER JUNIOR HIGH
M AND H REALTY PARTNERS I I I LP (4009 HARDWICK ST in LAKEWOOD, CA)
STATE MASTER (California - Hazardous Waste Tracking) - HAZARDOU WASTE PROGRAM Small Quantity Generators, between 100 kg and 1000 kg of hazardous waste/month (Resource Conservation and Recovery Act (tracking hazardous waste)) - notification Alternative names: M AND H REALTY PARTNERS III LP
CHEVRON PIPE LINE COMPANY (5509 DOWNEY AVENUE in LAKEWOOD, CA)
STATE MASTER (California - Hazardous Waste Tracking) - HAZARDOU WASTE PROGRAM Small Quantity Generators, between 100 kg and 1000 kg of hazardous waste/month (Resource Conservation and Recovery Act (tracking hazardous waste)) Alternative names: CHEVRON UNITED STATES OF AMERICA, CHEVRON USA INC HYNES STA
CAL CLEANERS (2624 E CARSON ST in LAKEWOOD, CA)
STATE MASTER (California - Hazardous Waste Tracking) - HAZARDOU WASTE PROGRAM Small Quantity Generators, between 100 kg and 1000 kg of hazardous waste/month (Resource Conservation and Recovery Act (tracking hazardous waste)) - notification Organizations: DAVE NEWTON (CONTACT/OWNER)
FOSTER (STEPHEN) ELEMENTARY (5223 E. BIGELOW ST. in LAKEWOOD, CA)
(National Center for Education Statistics) - STATE ID-6011704 Organizations: BELLFLOWER UNIFIED (SCHOOL DISTRICT)
HOOVER MIDDLE (3501 COUNTRY CLUB DR. in LAKEWOOD, CA)
(National Center for Education Statistics) - STATE ID-6057798 Organizations: LONG BEACH UNIFIED (SCHOOL DISTRICT)
MICHELSON CONTINUATION (3717 MICHELSON ST. in LAKEWOOD, CA)
(National Center for Education Statistics) - STATE ID-1936756 Organizations: PARAMOUNT UNIFIED (SCHOOL DISTRICT)
EXXONMOBIL OIL CORP. (2626 DEL AMO BLVD in LAKEWOOD, CA)
HAZARDOUS WASTE BIENNIAL REPORTER (Resource Conservation and Recovery Act (tracking hazardous waste)) Large Quantity Generators, more that 1000 kg of hazardous waste/month (Resource Conservation and Recovery Act (tracking hazardous waste)) Organizations: EXXONMOBIL OIL CORPORATION (CONTACT/OWNER)
HUCK INTERNATIONAL INCORPORATED (3969 PARAMOUNT BLVD. in LAKEWOOD, CA)
Large Quantity Generators, more that 1000 kg of hazardous waste/month (Resource Conservation and Recovery Act (tracking hazardous waste)) TRI REPORTER (Tracking of toxic chemicals releasing facilities) Business SIC classification: BOLTS, NUTS, SCREWS, RIVETS, AND WASHERS Business NAICS classification: BOLT, NUT, SCREW, RIVET, AND WASHER MANUFACTURING.; OTHER COMMERCIAL AND SERVICE INDUSTRY MACHINERY MANUFACTURING.; OTHER AIRCRAFT PARTS AND AUXILIARY EQUIPMENT MANUFACTURING. Alternative names: CORANT TECH. . INC., LITTON FASTENING SYSTEMS
Housing units lacking complete kitchen facilities: 1.7%
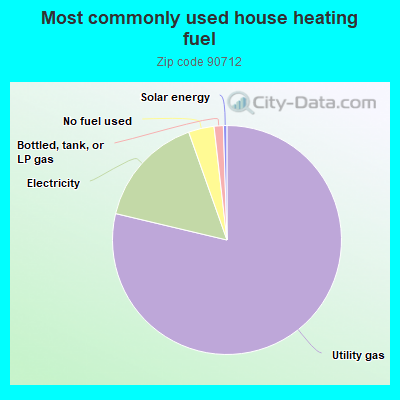
78.4%Utility gas
15.8%Electricity
3.6%No fuel used
1.3%Bottled, tank, or LP gas
0.5%Solar energy
Population in 1990: 28,992. Population change in the 1990s: +1,179 (+4.1%).
Place of birth for U.S.-born residents:
This state: 20,547
Northeast: 756
Midwest: 1,405
South: 1,265
West: 614
62% of the 90712 zip code residents lived in the same house 5 years ago. Out of people who lived in different houses, 81% lived in this county. Out of people who lived in different counties, 50% lived in California.
93% of the 90712 zip code residents lived in the same house 1 year ago. Out of people who lived in different houses, 76% moved from this county. Out of people who lived in different houses, 18% moved from different county within same state. Out of people who lived in different houses, 0% moved from different state. Out of people who lived in different houses, 6% moved from abroad.
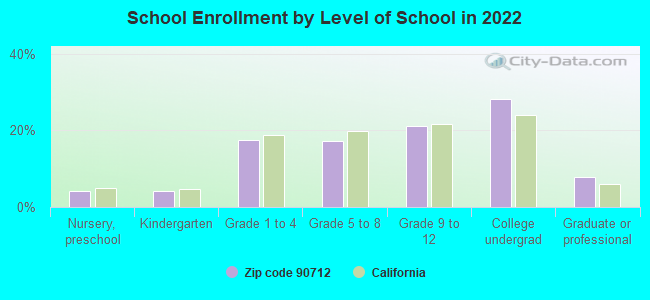
Private vs. public school enrollment:
Students in private schools in grades 1 to 8 (elementary and middle school): 650
Here:
24.7%
California:
10.5%
Students in private schools in grades 9 to 12 (high school): 213
Here:
13.5%
California:
8.5%
Students in private undergraduate colleges: 267
Here:
12.6%
California:
15.9%
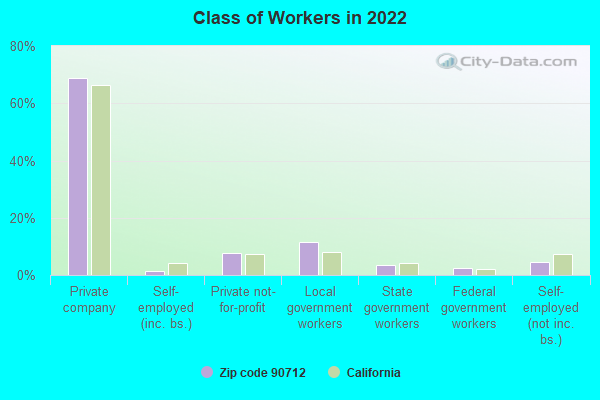
Occupation by median earnings in the past 12 months ($)
116,861Life, physical, and social science occupations
110,770Law enforcement workers including supervisors
98,505Architecture and engineering occupations
97,350Health diagnosing and treating practitioners and other technical occupations
93,646Computer and mathematical occupations
86,633Legal occupations
Companies with federal contracts located in this zip code (LAKEWOOD, CA):
TFC MANUFACTURING, INC (2141 E BIXBY ROAD; small business) 100 employees, $0 revenue: $1,981,138 in 81 contractsfrom 2001 to 2006
Contracts for Specialized Shipping and Storage Containers, Gas Turbines and Jet Engines, Non-Aircraft; and Components, Airframe Structural Components, Gas Turbines and Jet Engines, Aircraft; Prime Moving, and Components, and moreby Army, Defense Logistics Agency Signed by year:2000: $0; 2001: $1,347,985; 2002: -$263,619; 2003: $244,260; 2004: $318,975; 2005: $218,133; 2006: $115,404.
Biggest contracts:
$332,750 with Army for Specialized Shipping and Storage Containers. Signed on 2001-11-08. Completion date: 2002-09-30.
$301,080, same as above.Signed on 2001-09-28. Completion date: 2003-09-30.
$204,960, same as above.Signed on 2004-04-07. Completion date: 2004-07-30.
$173,900, same as above.Signed on 2001-02-07. Completion date: 2001-12-24.
SONA CONSTRUCTION (5619 WAGNER AVENUE; small business) : $674,202 in 4 contractsfrom 2000 to 2002
$350,000 with Air Force for Maintenance, Repair or Alteration of Real Property -- Other Administrative Facilities and Service Buildings. Signed on 2000-09-28. Completion date: 2001-09-01.
$199,801, same as above.Signed on 2002-09-16. Completion date: 2003-09-30.
$84,401, same as above.Signed on 2002-03-22. Completion date: 2002-11-29.
$40,000, same as above.Signed on 2000-05-22. Completion date: 2000-09-30.
PINEL CONSTRUCTION (3671 INDUSTRY AVE STE B5; small business)
$70,152 with Air Force for Gas Services. Signed on 2001-06-11. Completion date: 2001-08-28.
COAST CAPITAL USA (5150 CANDLEWOOD ST STE 9; small business)
$57,136 with Army for ADP Software. Taking place in KY. Signed on 2000-09-16. Completion date: 2000-08-25.
AIRGAS WEST, INC (4007 PARAMOUNT BLVD STE 10; small business) : $42,330 in 7 contractsfrom 2003 to 2005
Contracts for Gases: Compressed and Liquefied, , Gas Welding, Heat Cutting, and Metalizing Equipment, Drugs and Biologicals by Navy, Indian Health Service, National Oceanic and Atmospheric Administration/Under Secretary for Oceans and Atmosphere, Bureau of Prisoners/Federal Prison System, and others Signed by year:2000: $0; 2001: $0; 2002: $0; 2003: $5,000; 2004: $900; 2005: $36,430; 2006: $0.
Biggest contracts:
$14,861 with Navy for Gases: Compressed and Liquefied. Signed on 2005-10-21. Completion date: 2005-11-02.
$12,538 with Indian Health Service for . Taking place in AZ. Signed on 2005-02-15. Completion date: 2005-02-22.
$5,110 with National Oceanic and Atmospheric Administration/Under Secretary for Oceans and Atmosphere for Gases: Compressed and Liquefied. Taking place in AZ. Signed on 2005-10-01. Completion date: 2006-09-30.
$5,000, same as above.Signed on 2003-10-13. Completion date: 2004-09-30.
CHAMPION INDUSTRIAL PRODUCTS, (5420 FACULTY AVE; small business) : $26,549 in 7 contractsfrom 2003 to 2004
Contracts for Miscellaneous Communication Equipment by Navy Signed by year:2000: $0; 2001: $0; 2002: $0; 2003: $10,043; 2004: $16,506; 2005: $0; 2006: $0.
Biggest contracts:
$9,936 with Navy for Miscellaneous Communication Equipment. Signed on 2003-07-22. Completion date: 2003-09-19.
$7,050, same as above.Signed on 2004-08-06. Completion date: 2004-09-10.
$5,790, same as above.Signed on 2004-01-05. Completion date: 2004-02-17.
$5,790, same as above.Signed on 2004-02-23. Completion date: 2004-04-19.
RSM TECHNOLOGIES, INC (2923 CANDLEWOOD ST; small business)
$8,800 with Army for Boxes, Cartons, and Crates. Signed on 2005-06-01. Completion date: 2005-06-30.
Top industries in this zip code by the number of employees in 2005:
Administrative and Support and Waste Management and Remediation Services: Temporary Help Services (over 1000 employees: 1 establishment, 500-999 employees: 1 establishment, 250-499 employees: 1 establishment, 100-249 employees: 1 establishment, 1-4 employees: 1 establishment)


 Nearest zip codes: 90807, 90713, 90805, 90706, 90808, 90755.