Estimated zip code population in 2022: 95,713 Zip code population in 2010: 93,524 Zip code population in 2000: 91,663
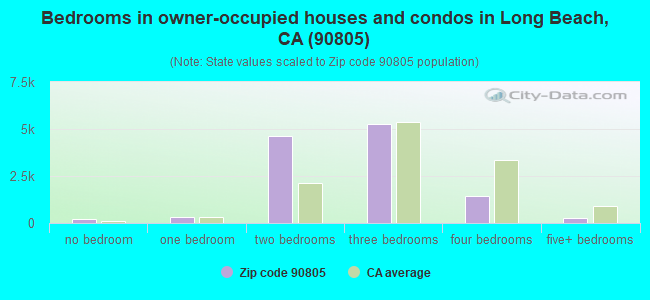
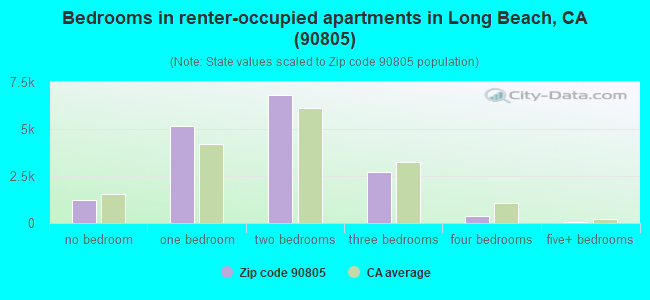
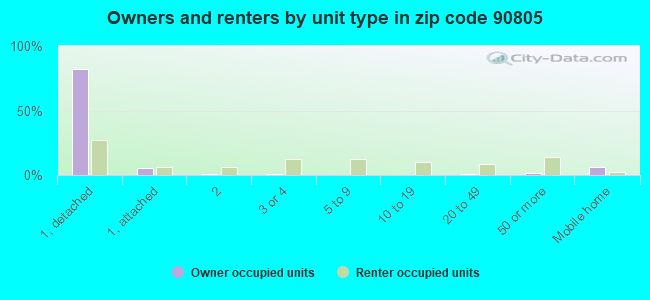
Houses and condos: 29,347 Renter-occupied apartments: 16,413
% of renters here:
57%
State:
44%
March 2022 cost of living index in zip code 90805: 135.1 (high, U.S. average is 100)
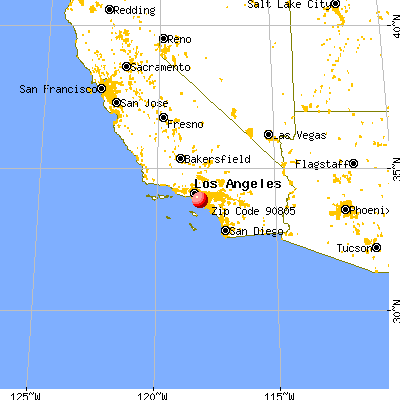
Land area: 7.4 sq. mi. Water area: 0.2 sq. mi.
Population density: 12,989 people per square mile
(very high).
OSM Map
General Map
Google Map
MSN Map
OSM Map
General Map
Google Map
MSN Map
OSM Map
General Map
Google Map
MSN Map
OSM Map
General Map
Google Map
MSN Map
Please wait while loading the map...
Real estate property taxes paid for housing units in 2022:
This zip code:
0.6% ($3,683)
California:
0.7% ($4,831)
Median real estate property taxes paid for housing units with mortgages in 2022: $4,021 (0.6%) Median real estate property taxes paid for housing units with no mortgage in 2022: $2,986 (0.5%)
Averages for the 2020 tax year for zip code 90805, filed in 2021:
Average Adjusted Gross Income (AGI) in 2020: $42,788 (Individual Income Tax Returns)
Here:
$42,788
State:
$95,910
Salary/wage: $41,318 (reported on 85.7% of returns)
Here:
$41,318
State:
$77,331
(% of AGI for various income ranges: 1230.5% for AGIs below $25k, 3949.3% for AGIs $25k-50k, 7631.5% for AGIs $50k-75k, 11518.2% for AGIs $75k-100k, 19933.6% for AGIs $100k-200k, 55457.0% for AGIs over 200k)
Taxable interest for individuals: $332 (reported on 19.1% of returns)
This zip code:
$332
California:
$2,294
(% of AGI for various income ranges: 3.5% for AGIs below $25k, 4.5% for AGIs $25k-50k, 11.2% for AGIs $50k-75k, 24.3% for AGIs $75k-100k, 35.7% for AGIs $100k-200k, 265.0% for AGIs over 200k)
Ordinary dividends: $1,679 (reported on 4.7% of returns)
Here:
$1,679
State:
$10,949
(% of AGI for various income ranges: 3.2% for AGIs below $25k, 3.3% for AGIs $25k-50k, 9.3% for AGIs $50k-75k, 19.4% for AGIs $75k-100k, 48.3% for AGIs $100k-200k, 1085.0% for AGIs over 200k)
Net capital gain/loss in AGI: +$5,482 (reported on 6.2% of returns)
Here:
+$5,482
State:
+$49,306
(% of AGI for various income ranges: 0.2% for AGIs below $25k, 4.3% for AGIs $25k-50k, 14.7% for AGIs $50k-75k, 49.3% for AGIs $75k-100k, 174.9% for AGIs $100k-200k, 9841.0% for AGIs over 200k)
Profit/loss from business: +$5,929 (reported on 17.9% of returns)
Here:
+$5,929
State:
+$15,671
(% of AGI for various income ranges: 171.8% for AGIs below $25k, 99.6% for AGIs $25k-50k, 133.2% for AGIs $50k-75k, 142.3% for AGIs $75k-100k, 282.2% for AGIs $100k-200k, 1349.0% for AGIs over 200k)
Taxable individual retirement arrangement distribution: $14,884 (reported on 1.9% of returns)
90805:
$14,884
California:
$23,505
(% of AGI for various income ranges: 13.2% for AGIs below $25k, 15.0% for AGIs $25k-50k, 44.9% for AGIs $50k-75k, 104.8% for AGIs $75k-100k, 236.2% for AGIs $100k-200k, 1259.0% for AGIs over 200k)
Total itemized deductions: $27,669 (reported on 9.8% of returns)
Here:
$27,669
State:
$39,517
(% of AGI for various income ranges: 39.0% for AGIs below $25k, 149.6% for AGIs $25k-50k, 568.9% for AGIs $50k-75k, 1155.8% for AGIs $75k-100k, 2399.5% for AGIs $100k-200k, 8035.0% for AGIs over 200k)
Charity contributions: $5,067 (reported on 8.0% of returns)
Here:
$5,067
State:
$12,598
(% of AGI for various income ranges: 2.9% for AGIs below $25k, 19.9% for AGIs $25k-50k, 79.1% for AGIs $50k-75k, 175.1% for AGIs $75k-100k, 398.7% for AGIs $100k-200k, 1370.0% for AGIs over 200k)
Taxes paid: $8,014 (reported on 9.7% of returns)
90805:
$8,014
State:
$8,807
(% of AGI for various income ranges: 9.3% for AGIs below $25k, 37.4% for AGIs $25k-50k, 166.0% for AGIs $50k-75k, 367.1% for AGIs $75k-100k, 737.2% for AGIs $100k-200k, 1563.0% for AGIs over 200k)
Earned income credit: $2,324 (reported on 24.2% of returns)
Here:
$2,324
State:
$2,074
(% of AGI for various income ranges: 129.6% for AGIs below $25k, 82.4% for AGIs $25k-50k, 1.1% for AGIs $50k-75k)
Percentage of individuals using paid preparers for their 2020 taxes: 92.1%
Here:
92%
State:
92%
(% for various income ranges: 90.7% for AGIs below $25k, 93.0% for AGIs $25k-50k, 93.2% for AGIs $50k-75k, 92.6% for AGIs $75k-100k, 92.7% for AGIs $100k-200k, 90.3% for AGIs over 200k)
Averages for the 2012 tax year for zip code 90805, filed in 2013:
Average Adjusted Gross Income (AGI) in 2012: $33,596 (Individual Income Tax Returns)
Here:
$33,596
State:
$72,726
Salary/wage: $33,101 (reported on 87.8% of returns)
Here:
$33,101
State:
$59,079
(% of AGI for various income ranges: 79.0% for AGIs below $25k, 90.5% for AGIs $25k-50k, 90.3% for AGIs $50k-75k, 88.6% for AGIs $75k-100k, 86.8% for AGIs $100k-200k, 42.9% for AGIs over 200k)
Taxable interest for individuals: $306 (reported on 18.1% of returns)
This zip code:
$306
California:
$2,146
(% of AGI for various income ranges: 0.2% for AGIs below $25k, 0.1% for AGIs $25k-50k, 0.2% for AGIs $50k-75k, 0.2% for AGIs $75k-100k, 0.2% for AGIs $100k-200k, 0.4% for AGIs over 200k)
Ordinary dividends: $1,477 (reported on 3.6% of returns)
Here:
$1,477
State:
$9,308
(% of AGI for various income ranges: 0.1% for AGIs below $25k, 0.1% for AGIs $50k-75k, 0.2% for AGIs $75k-100k, 0.3% for AGIs $100k-200k, 0.8% for AGIs over 200k)
Net capital gain/loss in AGI: +$3,179 (reported on 2.8% of returns)
Here:
+$3,179
State:
+$30,460
(% of AGI for various income ranges: 0.7% for AGIs $100k-200k, 10.3% for AGIs over 200k)
Profit/loss from business: +$8,163 (reported on 16.8% of returns)
Here:
+$8,163
State:
+$17,064
(% of AGI for various income ranges: 13.6% for AGIs below $25k, 2.8% for AGIs $25k-50k, 1.0% for AGIs $50k-75k, 0.7% for AGIs $75k-100k, 1.2% for AGIs $100k-200k)
Taxable individual retirement arrangement distribution: $12,690 (reported on 2.4% of returns)
90805:
$12,690
California:
$19,557
(% of AGI for various income ranges: 0.5% for AGIs below $25k, 0.6% for AGIs $25k-50k, 0.7% for AGIs $50k-75k, 1.2% for AGIs $75k-100k, 2.3% for AGIs $100k-200k)
Total itemized deductions: $20,381 (32% of AGI, reported on 24.4% of returns)
Here:
$20,381
State:
$34,004
Here:
32.3% of AGI
State:
22.7% of AGI
(% of AGI for various income ranges: 5.6% for AGIs below $25k, 12.3% for AGIs $25k-50k, 19.2% for AGIs $50k-75k, 21.3% for AGIs $75k-100k, 21.4% for AGIs $100k-200k, 13.5% for AGIs over 200k)
Charity contributions: $2,705 (reported on 19.7% of returns)
Here:
$2,705
State:
$4,659
(% of AGI for various income ranges: 0.4% for AGIs below $25k, 1.3% for AGIs $25k-50k, 2.0% for AGIs $50k-75k, 2.4% for AGIs $75k-100k, 2.6% for AGIs $100k-200k, 1.4% for AGIs over 200k)
Taxes paid: $5,335 (reported on 24.4% of returns)
90805:
$5,335
State:
$14,448
(% of AGI for various income ranges: 1.1% for AGIs below $25k, 2.6% for AGIs $25k-50k, 4.8% for AGIs $50k-75k, 6.1% for AGIs $75k-100k, 7.0% for AGIs $100k-200k, 6.5% for AGIs over 200k)
Earned income credit: $2,642 (reported on 34.3% of returns)
Here:
$2,642
State:
$2,286
(% of AGI for various income ranges: 10.6% for AGIs below $25k, 1.8% for AGIs $25k-50k)
Percentage of individuals using paid preparers for their 2012 taxes: 74.0%
Here:
74%
State:
64%
(% for various income ranges: 72.7% for AGIs below $25k, 75.4% for AGIs $25k-50k, 75.1% for AGIs $50k-75k, 75.5% for AGIs $75k-100k, 75.6% for AGIs $100k-200k, 87.5% for AGIs over 200k)
Averages for the 2004 tax year for zip code 90805, filed in 2005:
Average Adjusted Gross Income (AGI) in 2004: $29,963 (Individual Income Tax Returns)
Here:
$29,963
State:
$58,600
Salary/wage: $29,676 (reported on 90.7% of returns)
Here:
$29,676
State:
$49,455
(% of AGI for various income ranges: 87.7% for AGIs below $10k, 86.8% for AGIs $10k-25k, 92.9% for AGIs $25k-50k, 92.7% for AGIs $50k-75k, 91.0% for AGIs $75k-100k, 75.1% for AGIs over 100k)
Taxable interest for individuals: $538 (reported on 25.1% of returns)
This zip code:
$538
California:
$2,365
(% of AGI for various income ranges: 0.8% for AGIs below $10k, 0.4% for AGIs $10k-25k, 0.4% for AGIs $25k-50k, 0.3% for AGIs $50k-75k, 0.5% for AGIs $75k-100k, 1.0% for AGIs over 100k)
Taxable dividends: $1,132 (reported on 5.4% of returns)
Here:
$1,132
State:
$4,746
(% of AGI for various income ranges: 0.4% for AGIs below $10k, 0.1% for AGIs $10k-25k, 0.1% for AGIs $25k-50k, 0.1% for AGIs $50k-75k, 0.3% for AGIs $75k-100k, 0.7% for AGIs over 100k)
Net capital gain/loss: +$5,507 (reported on 4.3% of returns)
Here:
+$5,507
State:
+$23,418
(% of AGI for various income ranges: -0.4% for AGIs below $10k, -0.0% for AGIs $10k-25k, 0.1% for AGIs $25k-50k, 0.3% for AGIs $50k-75k, 0.8% for AGIs $75k-100k, 7.5% for AGIs over 100k)
Profit/loss from business: +$7,384 (reported on 13.6% of returns)
Here:
+$7,384
State:
+$16,826
(% of AGI for various income ranges: 13.9% for AGIs below $10k, 7.4% for AGIs $10k-25k, 2.3% for AGIs $25k-50k, 1.0% for AGIs $50k-75k, 1.0% for AGIs $75k-100k, 3.4% for AGIs over 100k)
IRA payment deduction: $2,538 (reported on 1.2% of returns)
90805:
$2,538
California:
$3,192
(% of AGI for various income ranges: 0.1% for AGIs below $10k, 0.1% for AGIs $10k-25k, 0.1% for AGIs $25k-50k, 0.1% for AGIs $50k-75k, 0.1% for AGIs $75k-100k, 0.1% for AGIs over 100k)
Self-employed pension: $8,259 (reported on 0.1% of returns)
Here:
$8,259
California:
$17,688
Total itemized deductions: $18,994 (36% of AGI, reported on 29.4% of returns)
Here:
$18,994
State:
$28,113
Here:
36.3% of AGI
State:
25.3% of AGI
(% of AGI for various income ranges: 7.4% for AGIs below $10k, 8.8% for AGIs $10k-25k, 18.3% for AGIs $25k-50k, 25.1% for AGIs $50k-75k, 25.1% for AGIs $75k-100k, 21.2% for AGIs over 100k)
Charity contributions deductions: $2,689 (5% of AGI, reported on 25.2% of returns)
Here:
$2,689
State:
$3,923
Here:
4.9% of AGI
State:
3.3% of AGI
(% of AGI for various income ranges: 0.3% for AGIs below $10k, 0.7% for AGIs $10k-25k, 2.1% for AGIs $25k-50k, 3.2% for AGIs $50k-75k, 3.4% for AGIs $75k-100k, 3.3% for AGIs over 100k)
Total tax: $2,924 (reported on 58.9% of returns)
90805:
$2,924
State:
$10,761
(% of AGI for various income ranges: 3.1% for AGIs below $10k, 2.9% for AGIs $10k-25k, 4.4% for AGIs $25k-50k, 6.4% for AGIs $50k-75k, 8.4% for AGIs $75k-100k, 13.9% for AGIs over 100k)
Earned income credit: $2,046 (reported on 32.5% of returns)
Here:
$2,046
State:
$1,763
Percentage of individuals using paid preparers for their 2004 taxes: 76.1%
Here:
76%
State:
66%
(% for various income ranges: 70.3% for AGIs below $10k, 78.0% for AGIs $10k-25k, 77.0% for AGIs $25k-50k, 76.7% for AGIs $50k-75k, 78.5% for AGIs $75k-100k, 78.7% for AGIs over 100k)
Likely homosexual households (counted as self-reported same-sex unmarried-partner households)
Lesbian couples: 0.0% of all households
Gay men: 0.1% of all households
Household received Food Stamps/SNAP in the past 12 months: 7,015 Household did not receive Food Stamps/SNAP in the past 12 months: 22,360
Women who had a birth in the past 12 months: 1,582 (556 now married, 1,038 unmarried) Women who did not have a birth in the past 12 months: 25,748 (8,203 now married, 17,628 unmarried)
Housing units in zip code 90805 with a mortgage: 8,443 (672 second mortgage, 73 home equity loan, 513 both second mortgage and home equity loan) Houses without a mortgage: 227
Median monthly owner costs for units with a mortgage: $2,272 Median monthly owner costs for units without a mortgage: $578
Residents with income below the poverty level in 2022:
This zip code:
18.9%
Whole state:
12.2%
Residents with income below 50% of the poverty level in 2022:
This zip code:
10.1%
Whole state:
6.2%
Median number of rooms in houses and condos:
Here:
5.1
State:
6.0
Median number of rooms in apartments:
Here:
3.8
State:
3.9
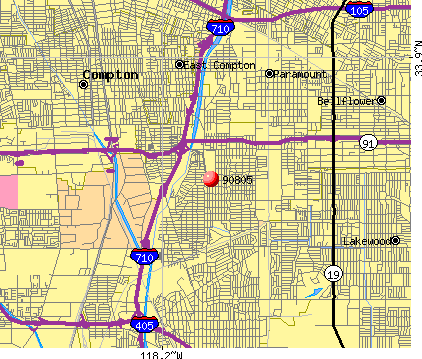
Notable locations in this zip code not listed on our city pages
Notable locations in zip code 90805: Lighthipe Substation (A), North Branch Long Beach Public Library (B), City of Long Beach Fire Department Station 12 (C), City of Long Beach Fire Department Station 11 (D). Display/hide their locations on the map
Churches in zip code 90805 include: Church of Christ (A), Community Presbyterian Church (B), Faith Tabernacle (C), First Southern Baptist Church (D), Gethsemane Baptist Church (E), New Jerusalem Baptist Church (F), North Long Beach Christian Church (G), North Long Beach Foursquare Church (H), Open Door Church of God in Christ (I). Display/hide their locations on the map
Parks in zip code 90805 include: Camp Suanga (1), Coolidge Park (2), Houghton Park (3), Ramona Park (4), Scherer Park (5), Atlantic Plaza Park (6), Jackson Park (7). Display/hide their locations on the map
9,776 married couples with children.
8,429 single-parent households (1,429 men, 7,000 women).
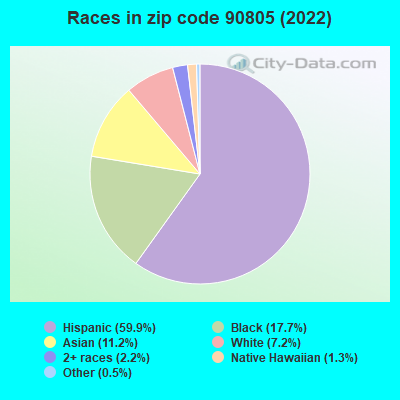
40.0% of residents of 90805 zip code speak English at home.
50.0% of residents speak Spanish at home (67% very well, 14% well, 13% not well, 6% not at all).
0.9% of residents speak other Indo-European language at home (80% very well, 15% well, 4% not well, 1% not at all).
8.6% of residents speak Asian or Pacific Island language at home (61% very well, 23% well, 14% not well, 2% not at all).
0.3% of residents speak other language at home (77% very well, 23% well).
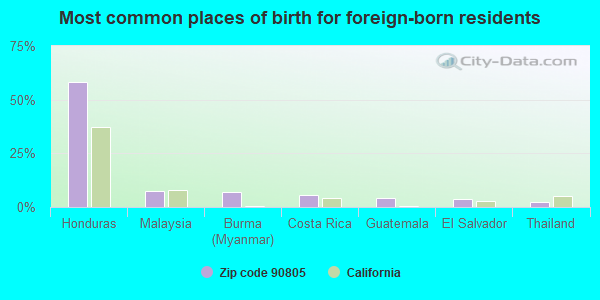
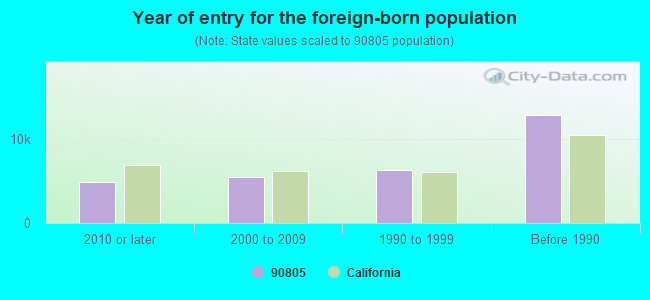
Foreign born population: 28,776 (30.1%) (50.1% of them are naturalized citizens)
Major facilities with environmental interests located in this zip code:
EDGINGTON OIL COMPANY (2400 E. ARTESIA BLVD. in LONG BEACH, CA)
AIR MINOR (AIRS/AFS) STATE MASTER (California - Hazardous Waste Tracking) - HAZARDOU WASTE PROGRAM COMPLIANCE ACTIVITY (Tracking inspections of insecticide, fungicide, and rodenticide, and toxic substances) CRITERIA AND HAZARDOUS AIR POLLUTANT INVENTORY (Inventory of air pollution sources) HAZARDOUS WASTE BIENNIAL REPORTER (Resource Conservation and Recovery Act (tracking hazardous waste)) Large Quantity Generators, more that 1000 kg of hazardous waste/month (Resource Conservation and Recovery Act (tracking hazardous waste)) - notification TRI REPORTER (Tracking of toxic chemicals releasing facilities) Business SIC classification: PETROLEUM REFINING Alternative names: EDGINGTON OIL REFINERY
LONG BEACH USD-HARTE ELEMENTARY (1671 E PHILLIPS STREET in LONG BEACH, CA)
STATE MASTER (California - Hazardous Waste Tracking) - HAZARDOU WASTE PROGRAM (National Center for Education Statistics) - STATE ID-6015358 Small Quantity Generators, between 100 kg and 1000 kg of hazardous waste/month (Resource Conservation and Recovery Act (tracking hazardous waste)) Organizations: LONG BEACH UNIFIED (SCHOOL DISTRICT)
Alternative names: LBUSD-HARTE ELEMENTARY
LONG BEACH USD-GRANT ELEMENTARY (1225 EAST 64TH STREET in LONG BEACH, CA)
STATE MASTER (California - Hazardous Waste Tracking) - HAZARDOU WASTE PROGRAM (National Center for Education Statistics) - STATE ID-6015341 Small Quantity Generators, between 100 kg and 1000 kg of hazardous waste/month (Resource Conservation and Recovery Act (tracking hazardous waste)) Organizations: LONG BEACH UNIFIED (SCHOOL DISTRICT)
Alternative names: LBUSD-GRANT ELEMENTARY
LONG BEACH USD-SUTTER ELEMENTARY (5075 DAISY AVENUE in LONG BEACH, CA)
STATE MASTER (California - Hazardous Waste Tracking) - HAZARDOU WASTE PROGRAM (National Center for Education Statistics) - STATE ID-6015630 Small Quantity Generators, between 100 kg and 1000 kg of hazardous waste/month (Resource Conservation and Recovery Act (tracking hazardous waste)) Organizations: LONG BEACH UNIFIED (SCHOOL DISTRICT)
Alternative names: LBUSD-SUTTER ELEMENTARY
LONG BEACH USD-JORDAN HIGH SCHOOL (6500 ATLANTIC AVENUE in LONG BEACH, CA)
STATE MASTER (California - Hazardous Waste Tracking) - HAZARDOU WASTE PROGRAM (National Center for Education Statistics) - STATE ID-1934470 Small Quantity Generators, between 100 kg and 1000 kg of hazardous waste/month (Resource Conservation and Recovery Act (tracking hazardous waste)) Organizations: LONG BEACH UNIFIED (SCHOOL DISTRICT)
Alternative names: LBUSD-JORDAN HIGH SCHOOL
BANDAG LICENSING CORPORATION (2500 THOMPSON ST. in LONG BEACH, CA)
STATE MASTER (California - Hazardous Waste Tracking) - HAZARDOU WASTE PROGRAM COMPLIANCE ACTIVITY (Tracking inspections of insecticide, fungicide, and rodenticide, and toxic substances) CRITERIA AND HAZARDOUS AIR POLLUTANT INVENTORY (Inventory of air pollution sources) Small Quantity Generators, between 100 kg and 1000 kg of hazardous waste/month (Resource Conservation and Recovery Act (tracking hazardous waste)) - notification TRI REPORTER (Tracking of toxic chemicals releasing facilities) Business SIC classification: TIRES AND INNER TUBES Business NAICS classification: ALL OTHER RUBBER PRODUCT MANUFACTURING. Alternative names: MASTER PROCESSING CORP
LUBECO INCORPORATED (6859 DOWNEY AVE in LONG BEACH, CA)
STATE MASTER (California - Hazardous Waste Tracking) - HAZARDOU WASTE PROGRAM CRITERIA AND HAZARDOUS AIR POLLUTANT INVENTORY (Inventory of air pollution sources) HAZARDOUS WASTE BIENNIAL REPORTER (Resource Conservation and Recovery Act (tracking hazardous waste)) Large Quantity Generators, more that 1000 kg of hazardous waste/month (Resource Conservation and Recovery Act (tracking hazardous waste)) Business SIC and NAICS classification: ELECTROPLATING, PLATING, POLISHING, ANODIZING, AND COLORING Organizations: STEVE ROSSI (CONTACT/OWNER)
ADDAMS ELEMENTARY SCHOOL (5320 PINE AVE in LONG BEACH, CA)
(Geographic Names Information System) (National Center for Education Statistics) - STATE ID-6015119 Small Quantity Generators, between 100 kg and 1000 kg of hazardous waste/month (Resource Conservation and Recovery Act (tracking hazardous waste)) Organizations: LONG BEACH UNIFIED (SCHOOL DISTRICT)
Alternative names: LONG BEACH USD-ADDAMS ELEMENTARY
JAYCO ENT (5501 DAIRY AVE in LONG BEACH, CA)
STATE MASTER (California - Hazardous Waste Tracking) - HAZARDOU WASTE PROGRAM Small Quantity Generators, between 100 kg and 1000 kg of hazardous waste/month (Resource Conservation and Recovery Act (tracking hazardous waste)) - notification Organizations: JOHN J CLEGG (CONTACT/OWNER)
LONG BEACH USD-KING ELEMENTARY (145 E ARTESIA BLVD in LONG BEACH, CA)
(National Center for Education Statistics) - STATE ID-6015416 Small Quantity Generators, between 100 kg and 1000 kg of hazardous waste/month (Resource Conservation and Recovery Act (tracking hazardous waste)) Organizations: LONG BEACH UNIFIED (SCHOOL DISTRICT)
MCKINLEY ELEMENTARY (6822 PARAMOUNT BLVD. in LONG BEACH, CA)
(National Center for Education Statistics) - STATE ID-6015515 Small Quantity Generators, between 100 kg and 1000 kg of hazardous waste/month (Resource Conservation and Recovery Act (tracking hazardous waste)) Organizations: LONG BEACH UNIFIED (SCHOOL DISTRICT)
Alternative names: LONG BEACH USD MCKINLEY ELEM
JIMS AUTO REPAIR (5217 CHERRY AVE in NORTH LONG BEACH, CA)
STATE MASTER (California - Hazardous Waste Tracking) - HAZARDOU WASTE PROGRAM Small Quantity Generators, between 100 kg and 1000 kg of hazardous waste/month (Resource Conservation and Recovery Act (tracking hazardous waste)) - notification Business NAICS classification: GENERAL AUTOMOTIVE REPAIR. Organizations: JAMES R SKIFTER (CONTACT/OWNER)
J S AUTOBODY (5363 CHERRY AVE in LONG BEACH, CA)
STATE MASTER (California - Hazardous Waste Tracking) - HAZARDOU WASTE PROGRAM Small Quantity Generators, between 100 kg and 1000 kg of hazardous waste/month (Resource Conservation and Recovery Act (tracking hazardous waste)) - notification Business NAICS classification: GENERAL AUTOMOTIVE REPAIR. Organizations: MASSER MAJIDSAFAIE (CONTACT/OWNER)
Housing units lacking complete plumbing facilities: 1.1% Housing units lacking complete kitchen facilities: 3.2%
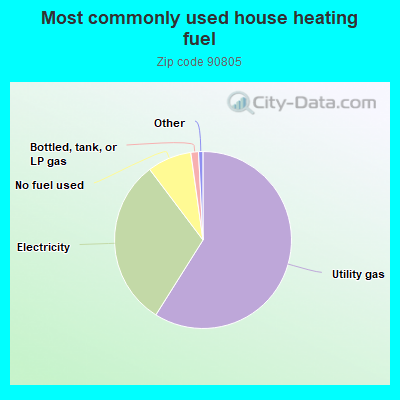
59.0%Utility gas
30.8%Electricity
8.1%No fuel used
1.4%Bottled, tank, or LP gas
Population in 1990: 74,011. Population change in the 1990s: +17,652 (+23.9%).
Place of birth for U.S.-born residents:
This state: 58,402
Northeast: 1,303
Midwest: 2,084
South: 3,041
West: 1,036
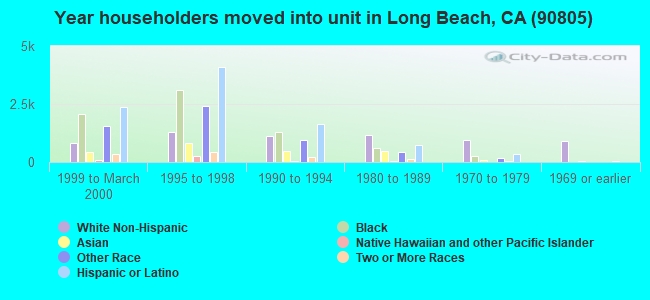
49% of the 90805 zip code residents lived in the same house 5 years ago. Out of people who lived in different houses, 90% lived in this county. Out of people who lived in different counties, 50% lived in California.
94% of the 90805 zip code residents lived in the same house 1 year ago. Out of people who lived in different houses, 74% moved from this county. Out of people who lived in different houses, 13% moved from different county within same state. Out of people who lived in different houses, 11% moved from different state. Out of people who lived in different houses, 4% moved from abroad.
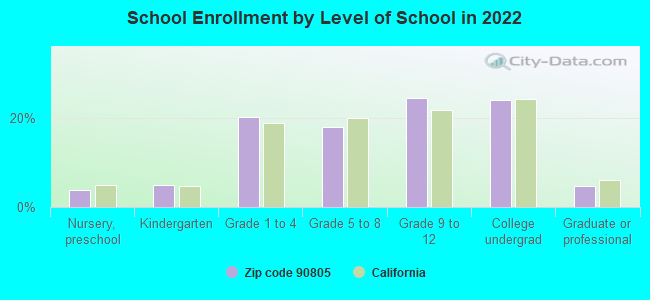
Private vs. public school enrollment:
Students in private schools in grades 1 to 8 (elementary and middle school): 1,026
Here:
10.3%
California:
10.5%
Students in private schools in grades 9 to 12 (high school): 255
Here:
4.0%
California:
8.5%
Students in private undergraduate colleges: 507
Here:
8.1%
California:
15.9%
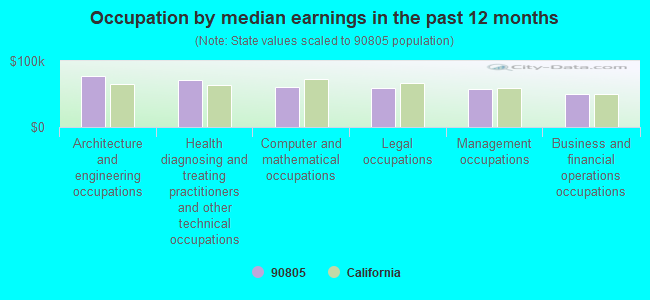
Occupation by median earnings in the past 12 months ($)
77,074Architecture and engineering occupations
71,935Health diagnosing and treating practitioners and other technical occupations
60,782Computer and mathematical occupations
58,947Legal occupations
57,045Management occupations
50,204Business and financial operations occupations
Companies with federal contracts located in this zip code (LONG BEACH, CA):
G L COLLINS CORPORATION (5875 OBISPO AVE; small business) : $4,377,994 in 69 contractsfrom 1999 to 2006
Contracts for Helicopter Rotor Blades, Drive Mechanisms and Components, Combination and Miscellaneous Instruments, Aircraft Hydraulic, Vacuum, and De-icing System Components, Miscellaneous Power Transmission Equipment, and moreby Army, Defense Logistics Agency, Air Force Signed by year:2000: $725,497; 2001: $843,790; 2002: $380,505; 2003: $610,444; 2004: $506,869; 2005: $848,800; 2006: $422,309.
Biggest contracts:
$291,000 with Army for Helicopter Rotor Blades, Drive Mechanisms and Components. Signed on 2003-12-22. Completion date: 2008-03-30.
$285,430 with Defense Logistics Agency for Combination and Miscellaneous Instruments. Signed on 2005-05-04. Completion date: 2005-10-05.
$247,690 with Army for Helicopter Rotor Blades, Drive Mechanisms and Components. Signed on 2001-01-30. Completion date: 2005-09-30.
$207,264 with Defense Logistics Agency for Combination and Miscellaneous Instruments. Signed on 2004-09-30. Completion date: 2005-02-17.
ANTELOPE VALLEY BUS INC (3333 E 69TH ST) : $476,153 in 21 contractsfrom 2000 to 2005
Contracts for Motor Passenger Services, Passenger Motor Charter Service, Other Transportation Travel and Relocation Services, Space Transportation and Launch Services, and moreby Department of Veterans Affairs, NASA, Navy, Army, and others Signed by year:2000: $27,000; 2001: -$23,000; 2002: $41,000; 2003: $106,676; 2004: $211,905; 2005: $112,572; 2006: $0.
Biggest contracts:
$91,400 with Department of Veterans Affairs for Motor Passenger Services. Signed on 2003-10-01. Completion date: 2004-09-30.
$84,416 with Department of Veterans Affairs for Passenger Motor Charter Service. Signed on 2004-06-25. Effective on 2004-07-16. Completion date: 2004-07-25.
$82,481 with Department of Veterans Affairs for Other Transportation Travel and Relocation Services. Signed on 2004-10-01. Completion date: 2004-12-31.
$56,064 with Department of Veterans Affairs for Motor Passenger Services. Signed on 2005-04-28. Completion date: 2005-06-30.
BRAGG INVESTMENT COMPANY INC (6188 N PARAMOUNT BLVD; small business) : $92,561 in 10 contractsfrom 2000 to 2005
Contracts for Miscellaneous Vehicular Components, Maintenance, Repair and Rebuilding of Equipment -- Tractors, Maintenance, Repair and Rebuilding of Equipment -- Ground Effect Vehicles, Motor Vehicles, Trailers, and Cycles, Miscellaneous Construction Equipment, and moreby Air Force, U.S. Army Corps of Engineers - civil program financing only, Army, Navy, and others Signed by year:2000: $62,482; 2001: $0; 2002: $0; 2003: $0; 2004: $19,607; 2005: $10,472; 2006: $0.
Biggest contracts:
$34,322 with Air Force for Miscellaneous Vehicular Components. Taking place in OH. Signed on 2000-09-08. Completion date: 2000-09-30.
$28,160 with U.S. Army Corps of Engineers - civil program financing only for Maintenance, Repair and Rebuilding of Equipment -- Tractors. Signed on 2000-09-25. Completion date: 2000-09-29.
$7,093 with Air Force for Maintenance, Repair and Rebuilding of Equipment -- Ground Effect Vehicles, Motor Vehicles, Trailers, and Cycles. Signed on 2004-09-09. Completion date: 2004-09-30.
$6,524 with Army for Miscellaneous Construction Equipment. Signed on 2004-12-30. Completion date: 2004-12-17.
NC DYNAMICS INC (3401 E 69 TH ST; small business)
$78,875 with Air Force for Miscellaneous Power Transmission Equipment. Signed on 2002-09-16. Completion date: 2002-12-16.
CUSA CC, LLC (3333 E 69TH ST; small business) : $48,922 in 5 contractsfrom 2003 to 2006
Contracts for Other Vehicle Charter for Transportation of Things, Passenger Motor Charter Service, Passenger Motor Vehicles, Motor Passenger Services by Navy, Air Force Signed by year:2000: $0; 2001: $0; 2002: $0; 2003: $10,510; 2004: $22,603; 2005: $6,855; 2006: $8,954.
Biggest contracts:
$22,603 with Navy for Other Vehicle Charter for Transportation of Things. Signed on 2004-06-15. Completion date: 2004-06-12.
$8,954 with Air Force for Passenger Motor Charter Service. Signed on 2006-03-23. Completion date: 2007-02-26.
$6,855 with Air Force for Passenger Motor Vehicles. Signed on 2005-02-25. Completion date: 2005-02-25.
$5,510 with Navy for Motor Passenger Services. Signed on 2003-08-18. Completion date: 2003-08-27.
ANYTIME PLUMBING & PIPE INC (1054 E MARKET ST; small business) : $1,800 in 2 contractsin 2003
$5,000 with Air Force for Inspection Services (including commercial testing and lab services, except medical/dental) -- Plumbing, Heating, and Waste Disposal Equipment. Signed on 2003-05-30. Completion date: 2003-06-27.
-$3,200, same as above.Signed on 2003-07-22. Completion date: 2003-07-22.
Top industries in this zip code by the number of employees in 2005:
2005 - 2018 National Fire Incident Reporting System (NFIRS) incidents
Based on the data from the years 2005 - 2018 the average number of fire incidents per year is 167. The highest number of reported fires - 302 took place in 2007, and the least - 0 in 2015. The data has a decreasing trend.
When looking into fire subcategories, the most reports belonged to: Outside Fires (35.8%), and Structure Fires (32.3%).
Fire incident types reported to NFIRS in Zip Code 90805


 Nearest zip codes: 90221, 90712, 90723, 90807, 90220, 90706.


 Based on the data from the years 2005 - 2018 the average number of fire incidents per year is 167. The highest number of reported fires - 302 took place in 2007, and the least - 0 in 2015. The data has a decreasing trend.
 When looking into fire subcategories, the most reports belonged to: Outside Fires (35.8%), and Structure Fires (32.3%).