Compton, California Submit your own pictures of this city and show them to the world
OSM Map
General Map
Google Map
MSN Map
OSM Map
General Map
Google Map
MSN Map
OSM Map
General Map
Google Map
MSN Map
OSM Map
General Map
Google Map
MSN Map
Please wait while loading the map...
Population in 2022: 91,988 (100% urban, 0% rural). Population change since 2000: -1.6%Males: 46,330 Females: 45,658
March 2022 cost of living index in Compton: 137.1 (high, U.S. average is 100) Percentage of residents living in poverty in 2022: 20.7%for White Non-Hispanic residents , 14.3% for Black residents , 22.6% for Hispanic or Latino residents , 14.9% for American Indian residents , 18.0% for Native Hawaiian and other Pacific Islander residents , 25.7% for other race residents , 18.5% for two or more races residents )
Profiles of local businesses
Business Search - 14 Million verified businesses
Data:
Median household income ($)
Median household income (% change since 2000)
Household income diversity
Ratio of average income to average house value (%)
Ratio of average income to average rent
Median household income ($) - White
Median household income ($) - Black or African American
Median household income ($) - Asian
Median household income ($) - Hispanic or Latino
Median household income ($) - American Indian and Alaska Native
Median household income ($) - Multirace
Median household income ($) - Other Race
Median household income for houses/condos with a mortgage ($)
Median household income for apartments without a mortgage ($)
Races - White alone (%)
Races - White alone (% change since 2000)
Races - Black alone (%)
Races - Black alone (% change since 2000)
Races - American Indian alone (%)
Races - American Indian alone (% change since 2000)
Races - Asian alone (%)
Races - Asian alone (% change since 2000)
Races - Hispanic (%)
Races - Hispanic (% change since 2000)
Races - Native Hawaiian and Other Pacific Islander alone (%)
Races - Native Hawaiian and Other Pacific Islander alone (% change since 2000)
Races - Two or more races (%)
Races - Two or more races (% change since 2000)
Races - Other race alone (%)
Races - Other race alone (% change since 2000)
Racial diversity
Unemployment (%)
Unemployment (% change since 2000)
Unemployment (%) - White
Unemployment (%) - Black or African American
Unemployment (%) - Asian
Unemployment (%) - Hispanic or Latino
Unemployment (%) - American Indian and Alaska Native
Unemployment (%) - Multirace
Unemployment (%) - Other Race
Population density (people per square mile)
Population - Males (%)
Population - Females (%)
Population - Males (%) - White
Population - Males (%) - Black or African American
Population - Males (%) - Asian
Population - Males (%) - Hispanic or Latino
Population - Males (%) - American Indian and Alaska Native
Population - Males (%) - Multirace
Population - Males (%) - Other Race
Population - Females (%) - White
Population - Females (%) - Black or African American
Population - Females (%) - Asian
Population - Females (%) - Hispanic or Latino
Population - Females (%) - American Indian and Alaska Native
Population - Females (%) - Multirace
Population - Females (%) - Other Race
Coronavirus confirmed cases (Apr 27, 2024)
Deaths caused by coronavirus (Apr 27, 2024)
Coronavirus confirmed cases (per 100k population) (Apr 27, 2024)
Deaths caused by coronavirus (per 100k population) (Apr 27, 2024)
Daily increase in number of cases (Apr 27, 2024)
Weekly increase in number of cases (Apr 27, 2024)
Cases doubled (in days) (Apr 27, 2024)
Hospitalized patients (Apr 18, 2022)
Negative test results (Apr 18, 2022)
Total test results (Apr 18, 2022)
COVID Vaccine doses distributed (per 100k population) (Sep 19, 2023)
COVID Vaccine doses administered (per 100k population) (Sep 19, 2023)
COVID Vaccine doses distributed (Sep 19, 2023)
COVID Vaccine doses administered (Sep 19, 2023)
Likely homosexual households (%)
Likely homosexual households (% change since 2000)
Likely homosexual households - Lesbian couples (%)
Likely homosexual households - Lesbian couples (% change since 2000)
Likely homosexual households - Gay men (%)
Likely homosexual households - Gay men (% change since 2000)
Cost of living index
Median gross rent ($)
Median contract rent ($)
Median monthly housing costs ($)
Median house or condo value ($)
Median house or condo value ($ change since 2000)
Mean house or condo value by units in structure - 1, detached ($)
Mean house or condo value by units in structure - 1, attached ($)
Mean house or condo value by units in structure - 2 ($)
Mean house or condo value by units in structure by units in structure - 3 or 4 ($)
Mean house or condo value by units in structure - 5 or more ($)
Mean house or condo value by units in structure - Boat, RV, van, etc. ($)
Mean house or condo value by units in structure - Mobile home ($)
Median house or condo value ($) - White
Median house or condo value ($) - Black or African American
Median house or condo value ($) - Asian
Median house or condo value ($) - Hispanic or Latino
Median house or condo value ($) - American Indian and Alaska Native
Median house or condo value ($) - Multirace
Median house or condo value ($) - Other Race
Median resident age
Resident age diversity
Median resident age - Males
Median resident age - Females
Median resident age - White
Median resident age - Black or African American
Median resident age - Asian
Median resident age - Hispanic or Latino
Median resident age - American Indian and Alaska Native
Median resident age - Multirace
Median resident age - Other Race
Median resident age - Males - White
Median resident age - Males - Black or African American
Median resident age - Males - Asian
Median resident age - Males - Hispanic or Latino
Median resident age - Males - American Indian and Alaska Native
Median resident age - Males - Multirace
Median resident age - Males - Other Race
Median resident age - Females - White
Median resident age - Females - Black or African American
Median resident age - Females - Asian
Median resident age - Females - Hispanic or Latino
Median resident age - Females - American Indian and Alaska Native
Median resident age - Females - Multirace
Median resident age - Females - Other Race
Commute - mean travel time to work (minutes)
Travel time to work - Less than 5 minutes (%)
Travel time to work - Less than 5 minutes (% change since 2000)
Travel time to work - 5 to 9 minutes (%)
Travel time to work - 5 to 9 minutes (% change since 2000)
Travel time to work - 10 to 19 minutes (%)
Travel time to work - 10 to 19 minutes (% change since 2000)
Travel time to work - 20 to 29 minutes (%)
Travel time to work - 20 to 29 minutes (% change since 2000)
Travel time to work - 30 to 39 minutes (%)
Travel time to work - 30 to 39 minutes (% change since 2000)
Travel time to work - 40 to 59 minutes (%)
Travel time to work - 40 to 59 minutes (% change since 2000)
Travel time to work - 60 to 89 minutes (%)
Travel time to work - 60 to 89 minutes (% change since 2000)
Travel time to work - 90 or more minutes (%)
Travel time to work - 90 or more minutes (% change since 2000)
Marital status - Never married (%)
Marital status - Now married (%)
Marital status - Separated (%)
Marital status - Widowed (%)
Marital status - Divorced (%)
Median family income ($)
Median family income (% change since 2000)
Median non-family income ($)
Median non-family income (% change since 2000)
Median per capita income ($)
Median per capita income (% change since 2000)
Median family income ($) - White
Median family income ($) - Black or African American
Median family income ($) - Asian
Median family income ($) - Hispanic or Latino
Median family income ($) - American Indian and Alaska Native
Median family income ($) - Multirace
Median family income ($) - Other Race
Median year house/condo built
Median year apartment built
Year house built - Built 2005 or later (%)
Year house built - Built 2000 to 2004 (%)
Year house built - Built 1990 to 1999 (%)
Year house built - Built 1980 to 1989 (%)
Year house built - Built 1970 to 1979 (%)
Year house built - Built 1960 to 1969 (%)
Year house built - Built 1950 to 1959 (%)
Year house built - Built 1940 to 1949 (%)
Year house built - Built 1939 or earlier (%)
Average household size
Household density (households per square mile)
Average household size - White
Average household size - Black or African American
Average household size - Asian
Average household size - Hispanic or Latino
Average household size - American Indian and Alaska Native
Average household size - Multirace
Average household size - Other Race
Occupied housing units (%)
Vacant housing units (%)
Owner occupied housing units (%)
Renter occupied housing units (%)
Vacancy status - For rent (%)
Vacancy status - For sale only (%)
Vacancy status - Rented or sold, not occupied (%)
Vacancy status - For seasonal, recreational, or occasional use (%)
Vacancy status - For migrant workers (%)
Vacancy status - Other vacant (%)
Residents with income below the poverty level (%)
Residents with income below 50% of the poverty level (%)
Children below poverty level (%)
Poor families by family type - Married-couple family (%)
Poor families by family type - Male, no wife present (%)
Poor families by family type - Female, no husband present (%)
Poverty status for native-born residents (%)
Poverty status for foreign-born residents (%)
Poverty among high school graduates not in families (%)
Poverty among people who did not graduate high school not in families (%)
Residents with income below the poverty level (%) - White
Residents with income below the poverty level (%) - Black or African American
Residents with income below the poverty level (%) - Asian
Residents with income below the poverty level (%) - Hispanic or Latino
Residents with income below the poverty level (%) - American Indian and Alaska Native
Residents with income below the poverty level (%) - Multirace
Residents with income below the poverty level (%) - Other Race
Air pollution - Air Quality Index (AQI)
Air pollution - CO
Air pollution - NO2
Air pollution - SO2
Air pollution - Ozone
Air pollution - PM10
Air pollution - PM25
Air pollution - Pb
Crime - Murders per 100,000 population
Crime - Rapes per 100,000 population
Crime - Robberies per 100,000 population
Crime - Assaults per 100,000 population
Crime - Burglaries per 100,000 population
Crime - Thefts per 100,000 population
Crime - Auto thefts per 100,000 population
Crime - Arson per 100,000 population
Crime - City-data.com crime index
Crime - Violent crime index
Crime - Property crime index
Crime - Murders per 100,000 population (5 year average)
Crime - Rapes per 100,000 population (5 year average)
Crime - Robberies per 100,000 population (5 year average)
Crime - Assaults per 100,000 population (5 year average)
Crime - Burglaries per 100,000 population (5 year average)
Crime - Thefts per 100,000 population (5 year average)
Crime - Auto thefts per 100,000 population (5 year average)
Crime - Arson per 100,000 population (5 year average)
Crime - City-data.com crime index (5 year average)
Crime - Violent crime index (5 year average)
Crime - Property crime index (5 year average)
1996 Presidential Elections Results (%) - Democratic Party (Clinton)
1996 Presidential Elections Results (%) - Republican Party (Dole)
1996 Presidential Elections Results (%) - Other
2000 Presidential Elections Results (%) - Democratic Party (Gore)
2000 Presidential Elections Results (%) - Republican Party (Bush)
2000 Presidential Elections Results (%) - Other
2004 Presidential Elections Results (%) - Democratic Party (Kerry)
2004 Presidential Elections Results (%) - Republican Party (Bush)
2004 Presidential Elections Results (%) - Other
2008 Presidential Elections Results (%) - Democratic Party (Obama)
2008 Presidential Elections Results (%) - Republican Party (McCain)
2008 Presidential Elections Results (%) - Other
2012 Presidential Elections Results (%) - Democratic Party (Obama)
2012 Presidential Elections Results (%) - Republican Party (Romney)
2012 Presidential Elections Results (%) - Other
2016 Presidential Elections Results (%) - Democratic Party (Clinton)
2016 Presidential Elections Results (%) - Republican Party (Trump)
2016 Presidential Elections Results (%) - Other
2020 Presidential Elections Results (%) - Democratic Party (Biden)
2020 Presidential Elections Results (%) - Republican Party (Trump)
2020 Presidential Elections Results (%) - Other
Ancestries Reported - Arab (%)
Ancestries Reported - Czech (%)
Ancestries Reported - Danish (%)
Ancestries Reported - Dutch (%)
Ancestries Reported - English (%)
Ancestries Reported - French (%)
Ancestries Reported - French Canadian (%)
Ancestries Reported - German (%)
Ancestries Reported - Greek (%)
Ancestries Reported - Hungarian (%)
Ancestries Reported - Irish (%)
Ancestries Reported - Italian (%)
Ancestries Reported - Lithuanian (%)
Ancestries Reported - Norwegian (%)
Ancestries Reported - Polish (%)
Ancestries Reported - Portuguese (%)
Ancestries Reported - Russian (%)
Ancestries Reported - Scotch-Irish (%)
Ancestries Reported - Scottish (%)
Ancestries Reported - Slovak (%)
Ancestries Reported - Subsaharan African (%)
Ancestries Reported - Swedish (%)
Ancestries Reported - Swiss (%)
Ancestries Reported - Ukrainian (%)
Ancestries Reported - United States (%)
Ancestries Reported - Welsh (%)
Ancestries Reported - West Indian (%)
Ancestries Reported - Other (%)
Educational Attainment - No schooling completed (%)
Educational Attainment - Less than high school (%)
Educational Attainment - High school or equivalent (%)
Educational Attainment - Less than 1 year of college (%)
Educational Attainment - 1 or more years of college (%)
Educational Attainment - Associate degree (%)
Educational Attainment - Bachelor's degree (%)
Educational Attainment - Master's degree (%)
Educational Attainment - Professional school degree (%)
Educational Attainment - Doctorate degree (%)
School Enrollment - Nursery, preschool (%)
School Enrollment - Kindergarten (%)
School Enrollment - Grade 1 to 4 (%)
School Enrollment - Grade 5 to 8 (%)
School Enrollment - Grade 9 to 12 (%)
School Enrollment - College undergrad (%)
School Enrollment - Graduate or professional (%)
School Enrollment - Not enrolled in school (%)
School enrollment - Public schools (%)
School enrollment - Private schools (%)
School enrollment - Not enrolled (%)
Median number of rooms in houses and condos
Median number of rooms in apartments
Housing units lacking complete plumbing facilities (%)
Housing units lacking complete kitchen facilities (%)
Density of houses
Urban houses (%)
Rural houses (%)
Households with people 60 years and over (%)
Households with people 65 years and over (%)
Households with people 75 years and over (%)
Households with one or more nonrelatives (%)
Households with no nonrelatives (%)
Population in households (%)
Family households (%)
Nonfamily households (%)
Population in families (%)
Family households with own children (%)
Median number of bedrooms in owner occupied houses
Mean number of bedrooms in owner occupied houses
Median number of bedrooms in renter occupied houses
Mean number of bedrooms in renter occupied houses
Median number of vehichles in owner occupied houses
Mean number of vehichles in owner occupied houses
Median number of vehichles in renter occupied houses
Mean number of vehichles in renter occupied houses
Mortgage status - with mortgage (%)
Mortgage status - with second mortgage (%)
Mortgage status - with home equity loan (%)
Mortgage status - with both second mortgage and home equity loan (%)
Mortgage status - without a mortgage (%)
Average family size
Average family size - White
Average family size - Black or African American
Average family size - Asian
Average family size - Hispanic or Latino
Average family size - American Indian and Alaska Native
Average family size - Multirace
Average family size - Other Race
Geographical mobility - Same house 1 year ago (%)
Geographical mobility - Moved within same county (%)
Geographical mobility - Moved from different county within same state (%)
Geographical mobility - Moved from different state (%)
Geographical mobility - Moved from abroad (%)
Place of birth - Born in state of residence (%)
Place of birth - Born in other state (%)
Place of birth - Native, outside of US (%)
Place of birth - Foreign born (%)
Housing units in structures - 1, detached (%)
Housing units in structures - 1, attached (%)
Housing units in structures - 2 (%)
Housing units in structures - 3 or 4 (%)
Housing units in structures - 5 to 9 (%)
Housing units in structures - 10 to 19 (%)
Housing units in structures - 20 to 49 (%)
Housing units in structures - 50 or more (%)
Housing units in structures - Mobile home (%)
Housing units in structures - Boat, RV, van, etc. (%)
House/condo owner moved in on average (years ago)
Renter moved in on average (years ago)
Year householder moved into unit - Moved in 1999 to March 2000 (%)
Year householder moved into unit - Moved in 1995 to 1998 (%)
Year householder moved into unit - Moved in 1990 to 1994 (%)
Year householder moved into unit - Moved in 1980 to 1989 (%)
Year householder moved into unit - Moved in 1970 to 1979 (%)
Year householder moved into unit - Moved in 1969 or earlier (%)
Means of transportation to work - Drove car alone (%)
Means of transportation to work - Carpooled (%)
Means of transportation to work - Public transportation (%)
Means of transportation to work - Bus or trolley bus (%)
Means of transportation to work - Streetcar or trolley car (%)
Means of transportation to work - Subway or elevated (%)
Means of transportation to work - Railroad (%)
Means of transportation to work - Ferryboat (%)
Means of transportation to work - Taxicab (%)
Means of transportation to work - Motorcycle (%)
Means of transportation to work - Bicycle (%)
Means of transportation to work - Walked (%)
Means of transportation to work - Other means (%)
Working at home (%)
Industry diversity
Most Common Industries - Agriculture, forestry, fishing and hunting, and mining (%)
Most Common Industries - Agriculture, forestry, fishing and hunting (%)
Most Common Industries - Mining, quarrying, and oil and gas extraction (%)
Most Common Industries - Construction (%)
Most Common Industries - Manufacturing (%)
Most Common Industries - Wholesale trade (%)
Most Common Industries - Retail trade (%)
Most Common Industries - Transportation and warehousing, and utilities (%)
Most Common Industries - Transportation and warehousing (%)
Most Common Industries - Utilities (%)
Most Common Industries - Information (%)
Most Common Industries - Finance and insurance, and real estate and rental and leasing (%)
Most Common Industries - Finance and insurance (%)
Most Common Industries - Real estate and rental and leasing (%)
Most Common Industries - Professional, scientific, and management, and administrative and waste management services (%)
Most Common Industries - Professional, scientific, and technical services (%)
Most Common Industries - Management of companies and enterprises (%)
Most Common Industries - Administrative and support and waste management services (%)
Most Common Industries - Educational services, and health care and social assistance (%)
Most Common Industries - Educational services (%)
Most Common Industries - Health care and social assistance (%)
Most Common Industries - Arts, entertainment, and recreation, and accommodation and food services (%)
Most Common Industries - Arts, entertainment, and recreation (%)
Most Common Industries - Accommodation and food services (%)
Most Common Industries - Other services, except public administration (%)
Most Common Industries - Public administration (%)
Occupation diversity
Most Common Occupations - Management, business, science, and arts occupations (%)
Most Common Occupations - Management, business, and financial occupations (%)
Most Common Occupations - Management occupations (%)
Most Common Occupations - Business and financial operations occupations (%)
Most Common Occupations - Computer, engineering, and science occupations (%)
Most Common Occupations - Computer and mathematical occupations (%)
Most Common Occupations - Architecture and engineering occupations (%)
Most Common Occupations - Life, physical, and social science occupations (%)
Most Common Occupations - Education, legal, community service, arts, and media occupations (%)
Most Common Occupations - Community and social service occupations (%)
Most Common Occupations - Legal occupations (%)
Most Common Occupations - Education, training, and library occupations (%)
Most Common Occupations - Arts, design, entertainment, sports, and media occupations (%)
Most Common Occupations - Healthcare practitioners and technical occupations (%)
Most Common Occupations - Health diagnosing and treating practitioners and other technical occupations (%)
Most Common Occupations - Health technologists and technicians (%)
Most Common Occupations - Service occupations (%)
Most Common Occupations - Healthcare support occupations (%)
Most Common Occupations - Protective service occupations (%)
Most Common Occupations - Fire fighting and prevention, and other protective service workers including supervisors (%)
Most Common Occupations - Law enforcement workers including supervisors (%)
Most Common Occupations - Food preparation and serving related occupations (%)
Most Common Occupations - Building and grounds cleaning and maintenance occupations (%)
Most Common Occupations - Personal care and service occupations (%)
Most Common Occupations - Sales and office occupations (%)
Most Common Occupations - Sales and related occupations (%)
Most Common Occupations - Office and administrative support occupations (%)
Most Common Occupations - Natural resources, construction, and maintenance occupations (%)
Most Common Occupations - Farming, fishing, and forestry occupations (%)
Most Common Occupations - Construction and extraction occupations (%)
Most Common Occupations - Installation, maintenance, and repair occupations (%)
Most Common Occupations - Production, transportation, and material moving occupations (%)
Most Common Occupations - Production occupations (%)
Most Common Occupations - Transportation occupations (%)
Most Common Occupations - Material moving occupations (%)
People in Group quarters - Institutionalized population (%)
People in Group quarters - Correctional institutions (%)
People in Group quarters - Federal prisons and detention centers (%)
People in Group quarters - Halfway houses (%)
People in Group quarters - Local jails and other confinement facilities (including police lockups) (%)
People in Group quarters - Military disciplinary barracks (%)
People in Group quarters - State prisons (%)
People in Group quarters - Other types of correctional institutions (%)
People in Group quarters - Nursing homes (%)
People in Group quarters - Hospitals/wards, hospices, and schools for the handicapped (%)
People in Group quarters - Hospitals/wards and hospices for chronically ill (%)
People in Group quarters - Hospices or homes for chronically ill (%)
People in Group quarters - Military hospitals or wards for chronically ill (%)
People in Group quarters - Other hospitals or wards for chronically ill (%)
People in Group quarters - Hospitals or wards for drug/alcohol abuse (%)
People in Group quarters - Mental (Psychiatric) hospitals or wards (%)
People in Group quarters - Schools, hospitals, or wards for the mentally retarded (%)
People in Group quarters - Schools, hospitals, or wards for the physically handicapped (%)
People in Group quarters - Institutions for the deaf (%)
People in Group quarters - Institutions for the blind (%)
People in Group quarters - Orthopedic wards and institutions for the physically handicapped (%)
People in Group quarters - Wards in general hospitals for patients who have no usual home elsewhere (%)
People in Group quarters - Wards in military hospitals for patients who have no usual home elsewhere (%)
People in Group quarters - Juvenile institutions (%)
People in Group quarters - Long-term care (%)
People in Group quarters - Homes for abused, dependent, and neglected children (%)
People in Group quarters - Residential treatment centers for emotionally disturbed children (%)
People in Group quarters - Training schools for juvenile delinquents (%)
People in Group quarters - Short-term care, detention or diagnostic centers for delinquent children (%)
People in Group quarters - Type of juvenile institution unknown (%)
People in Group quarters - Noninstitutionalized population (%)
People in Group quarters - College dormitories (includes college quarters off campus) (%)
People in Group quarters - Military quarters (%)
People in Group quarters - On base (%)
People in Group quarters - Barracks, unaccompanied personnel housing (UPH), (Enlisted/Officer), ;and similar group living quarters for military personnel (%)
People in Group quarters - Transient quarters for temporary residents (%)
People in Group quarters - Military ships (%)
People in Group quarters - Group homes (%)
People in Group quarters - Homes or halfway houses for drug/alcohol abuse (%)
People in Group quarters - Homes for the mentally ill (%)
People in Group quarters - Homes for the mentally retarded (%)
People in Group quarters - Homes for the physically handicapped (%)
People in Group quarters - Other group homes (%)
People in Group quarters - Religious group quarters (%)
People in Group quarters - Dormitories (%)
People in Group quarters - Agriculture workers' dormitories on farms (%)
People in Group quarters - Job Corps and vocational training facilities (%)
People in Group quarters - Other workers' dormitories (%)
People in Group quarters - Crews of maritime vessels (%)
People in Group quarters - Other nonhousehold living situations (%)
People in Group quarters - Other noninstitutional group quarters (%)
Residents speaking English at home (%)
Residents speaking English at home - Born in the United States (%)
Residents speaking English at home - Native, born elsewhere (%)
Residents speaking English at home - Foreign born (%)
Residents speaking Spanish at home (%)
Residents speaking Spanish at home - Born in the United States (%)
Residents speaking Spanish at home - Native, born elsewhere (%)
Residents speaking Spanish at home - Foreign born (%)
Residents speaking other language at home (%)
Residents speaking other language at home - Born in the United States (%)
Residents speaking other language at home - Native, born elsewhere (%)
Residents speaking other language at home - Foreign born (%)
Class of Workers - Employee of private company (%)
Class of Workers - Self-employed in own incorporated business (%)
Class of Workers - Private not-for-profit wage and salary workers (%)
Class of Workers - Local government workers (%)
Class of Workers - State government workers (%)
Class of Workers - Federal government workers (%)
Class of Workers - Self-employed workers in own not incorporated business and Unpaid family workers (%)
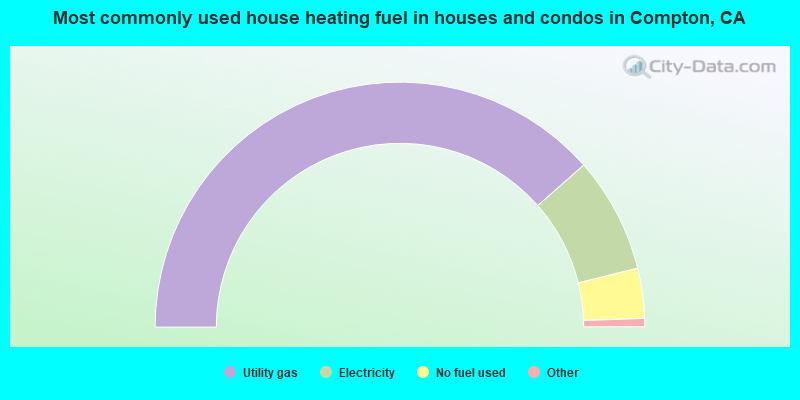
House heating fuel used in houses and condos - Utility gas (%)
House heating fuel used in houses and condos - Bottled, tank, or LP gas (%)
House heating fuel used in houses and condos - Electricity (%)
House heating fuel used in houses and condos - Fuel oil, kerosene, etc. (%)
House heating fuel used in houses and condos - Coal or coke (%)
House heating fuel used in houses and condos - Wood (%)
House heating fuel used in houses and condos - Solar energy (%)
House heating fuel used in houses and condos - Other fuel (%)
House heating fuel used in houses and condos - No fuel used (%)
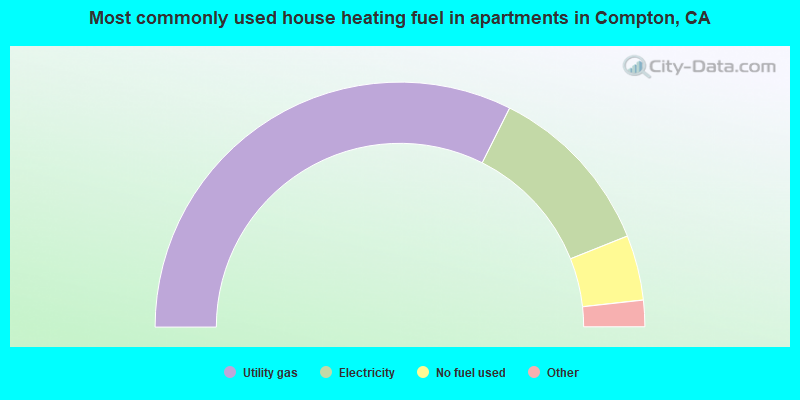
House heating fuel used in apartments - Utility gas (%)
House heating fuel used in apartments - Bottled, tank, or LP gas (%)
House heating fuel used in apartments - Electricity (%)
House heating fuel used in apartments - Fuel oil, kerosene, etc. (%)
House heating fuel used in apartments - Coal or coke (%)
House heating fuel used in apartments - Wood (%)
House heating fuel used in apartments - Solar energy (%)
House heating fuel used in apartments - Other fuel (%)
House heating fuel used in apartments - No fuel used (%)
Armed forces status - In Armed Forces (%)
Armed forces status - Civilian (%)
Armed forces status - Civilian - Veteran (%)
Armed forces status - Civilian - Nonveteran (%)
Fatal accidents locations in years 2005-2021
Fatal accidents locations in 2005
Fatal accidents locations in 2006
Fatal accidents locations in 2007
Fatal accidents locations in 2008
Fatal accidents locations in 2009
Fatal accidents locations in 2010
Fatal accidents locations in 2011
Fatal accidents locations in 2012
Fatal accidents locations in 2013
Fatal accidents locations in 2014
Fatal accidents locations in 2015
Fatal accidents locations in 2016
Fatal accidents locations in 2017
Fatal accidents locations in 2018
Fatal accidents locations in 2019
Fatal accidents locations in 2020
Fatal accidents locations in 2021
Alcohol use - People drinking some alcohol every month (%)
Alcohol use - People not drinking at all (%)
Alcohol use - Average days/month drinking alcohol
Alcohol use - Average drinks/week
Alcohol use - Average days/year people drink much
Audiometry - Average condition of hearing (%)
Audiometry - People that can hear a whisper from across a quiet room (%)
Audiometry - People that can hear normal voice from across a quiet room (%)
Audiometry - Ears ringing, roaring, buzzing (%)
Audiometry - Had a job exposure to loud noise (%)
Audiometry - Had off-work exposure to loud noise (%)
Blood Pressure & Cholesterol - Has high blood pressure (%)
Blood Pressure & Cholesterol - Checking blood pressure at home (%)
Blood Pressure & Cholesterol - Frequently checking blood cholesterol (%)
Blood Pressure & Cholesterol - Has high cholesterol level (%)
Consumer Behavior - Money monthly spent on food at supermarket/grocery store
Consumer Behavior - Money monthly spent on food at other stores
Consumer Behavior - Money monthly spent on eating out
Consumer Behavior - Money monthly spent on carryout/delivered foods
Consumer Behavior - Income spent on food at supermarket/grocery store (%)
Consumer Behavior - Income spent on food at other stores (%)
Consumer Behavior - Income spent on eating out (%)
Consumer Behavior - Income spent on carryout/delivered foods (%)
Current Health Status - General health condition (%)
Current Health Status - Blood donors (%)
Current Health Status - Has blood ever tested for HIV virus (%)
Current Health Status - Left-handed people (%)
Dermatology - People using sunscreen (%)
Diabetes - Diabetics (%)
Diabetes - Had a blood test for high blood sugar (%)
Diabetes - People taking insulin (%)
Diet Behavior & Nutrition - Diet health (%)
Diet Behavior & Nutrition - Milk product consumption (# of products/month)
Diet Behavior & Nutrition - Meals not home prepared (#/week)
Diet Behavior & Nutrition - Meals from fast food or pizza place (#/week)
Diet Behavior & Nutrition - Ready-to-eat foods (#/month)
Diet Behavior & Nutrition - Frozen meals/pizza (#/month)
Drug Use - People that ever used marijuana or hashish (%)
Drug Use - Ever used hard drugs (%)
Drug Use - Ever used any form of cocaine (%)
Drug Use - Ever used heroin (%)
Drug Use - Ever used methamphetamine (%)
Health Insurance - People covered by health insurance (%)
Kidney Conditions-Urology - Avg. # of times urinating at night
Medical Conditions - People with asthma (%)
Medical Conditions - People with anemia (%)
Medical Conditions - People with psoriasis (%)
Medical Conditions - People with overweight (%)
Medical Conditions - Elderly people having difficulties in thinking or remembering (%)
Medical Conditions - People who ever received blood transfusion (%)
Medical Conditions - People having trouble seeing even with glass/contacts (%)
Medical Conditions - People with arthritis (%)
Medical Conditions - People with gout (%)
Medical Conditions - People with congestive heart failure (%)
Medical Conditions - People with coronary heart disease (%)
Medical Conditions - People with angina pectoris (%)
Medical Conditions - People who ever had heart attack (%)
Medical Conditions - People who ever had stroke (%)
Medical Conditions - People with emphysema (%)
Medical Conditions - People with thyroid problem (%)
Medical Conditions - People with chronic bronchitis (%)
Medical Conditions - People with any liver condition (%)
Medical Conditions - People who ever had cancer or malignancy (%)
Mental Health - People who have little interest in doing things (%)
Mental Health - People feeling down, depressed, or hopeless (%)
Mental Health - People who have trouble sleeping or sleeping too much (%)
Mental Health - People feeling tired or having little energy (%)
Mental Health - People with poor appetite or overeating (%)
Mental Health - People feeling bad about themself (%)
Mental Health - People who have trouble concentrating on things (%)
Mental Health - People moving or speaking slowly or too fast (%)
Mental Health - People having thoughts they would be better off dead (%)
Oral Health - Average years since last visit a dentist
Oral Health - People embarrassed because of mouth (%)
Oral Health - People with gum disease (%)
Oral Health - General health of teeth and gums (%)
Oral Health - Average days a week using dental floss/device
Oral Health - Average days a week using mouthwash for dental problem
Oral Health - Average number of teeth
Pesticide Use - Households using pesticides to control insects (%)
Pesticide Use - Households using pesticides to kill weeds (%)
Physical Activity - People doing vigorous-intensity work activities (%)
Physical Activity - People doing moderate-intensity work activities (%)
Physical Activity - People walking or bicycling (%)
Physical Activity - People doing vigorous-intensity recreational activities (%)
Physical Activity - People doing moderate-intensity recreational activities (%)
Physical Activity - Average hours a day doing sedentary activities
Physical Activity - Average hours a day watching TV or videos
Physical Activity - Average hours a day using computer
Physical Functioning - People having limitations keeping them from working (%)
Physical Functioning - People limited in amount of work they can do (%)
Physical Functioning - People that need special equipment to walk (%)
Physical Functioning - People experiencing confusion/memory problems (%)
Physical Functioning - People requiring special healthcare equipment (%)
Prescription Medications - Average number of prescription medicines taking
Preventive Aspirin Use - Adults 40+ taking low-dose aspirin (%)
Reproductive Health - Vaginal deliveries (%)
Reproductive Health - Cesarean deliveries (%)
Reproductive Health - Deliveries resulted in a live birth (%)
Reproductive Health - Pregnancies resulted in a delivery (%)
Reproductive Health - Women breastfeeding newborns (%)
Reproductive Health - Women that had a hysterectomy (%)
Reproductive Health - Women that had both ovaries removed (%)
Reproductive Health - Women that have ever taken birth control pills (%)
Reproductive Health - Women taking birth control pills (%)
Reproductive Health - Women that have ever used Depo-Provera or injectables (%)
Reproductive Health - Women that have ever used female hormones (%)
Sexual Behavior - People 18+ that ever had sex (vaginal, anal, or oral) (%)
Sexual Behavior - Males 18+ that ever had vaginal sex with a woman (%)
Sexual Behavior - Males 18+ that ever performed oral sex on a woman (%)
Sexual Behavior - Males 18+ that ever had anal sex with a woman (%)
Sexual Behavior - Males 18+ that ever had any sex with a man (%)
Sexual Behavior - Females 18+ that ever had vaginal sex with a man (%)
Sexual Behavior - Females 18+ that ever performed oral sex on a man (%)
Sexual Behavior - Females 18+ that ever had anal sex with a man (%)
Sexual Behavior - Females 18+ that ever had any kind of sex with a woman (%)
Sexual Behavior - Average age people first had sex
Sexual Behavior - Average number of female sex partners in lifetime (males 18+)
Sexual Behavior - Average number of female vaginal sex partners in lifetime (males 18+)
Sexual Behavior - Average age people first performed oral sex on a woman (18+)
Sexual Behavior - Average number of woman performed oral sex on in lifetime (18+)
Sexual Behavior - Average number of male sex partners in lifetime (males 18+)
Sexual Behavior - Average number of male anal sex partners in lifetime (males 18+)
Sexual Behavior - Average age people first performed oral sex on a man (18+)
Sexual Behavior - Average number of male oral sex partners in lifetime (18+)
Sexual Behavior - People using protection when performing oral sex (%)
Sexual Behavior - Average number of times people have vaginal or anal sex a year
Sexual Behavior - People having sex without condom (%)
Sexual Behavior - Average number of male sex partners in lifetime (females 18+)
Sexual Behavior - Average number of male vaginal sex partners in lifetime (females 18+)
Sexual Behavior - Average number of female sex partners in lifetime (females 18+)
Sexual Behavior - Circumcised males 18+ (%)
Sleep Disorders - Average hours sleeping at night
Sleep Disorders - People that has trouble sleeping (%)
Smoking-Cigarette Use - People smoking cigarettes (%)
Taste & Smell - People 40+ having problems with smell (%)
Taste & Smell - People 40+ having problems with taste (%)
Taste & Smell - People 40+ that ever had wisdom teeth removed (%)
Taste & Smell - People 40+ that ever had tonsils teeth removed (%)
Taste & Smell - People 40+ that ever had a loss of consciousness because of a head injury (%)
Taste & Smell - People 40+ that ever had a broken nose or other serious injury to face or skull (%)
Taste & Smell - People 40+ that ever had two or more sinus infections (%)
Weight - Average height (inches)
Weight - Average weight (pounds)
Weight - Average BMI
Weight - People that are obese (%)
Weight - People that ever were obese (%)
Weight - People trying to lose weight (%)
66,484 71.7% Hispanic 22,441 24.2% Black alone 1,055 1.1% Other race alone 1,013 1.1% Two or more races 881 0.9% Asian alone 760 0.8% White alone 102 0.1% Native Hawaiian and Other 62 0.07% American Indian alone
The City-Data.com crime index weighs serious crimes and violent crimes more heavily. Higher means more crime, U.S. average is 246.1. It adjusts for the number of visitors and daily workers commuting into cities.
- means the value is smaller than the state average.
- means the value is about the same as the state average.
- means the value is bigger than the state average.
- means the value is much bigger than the state average.
Crime rate in Compton detailed stats: murders, rapes, robberies, assaults, burglaries, thefts, arson Officers per 1,000 residents here:
0.01California average:
1.98
Latest news from Compton, CA collected exclusively by city-data.com from local newspapers, TV, and radio stations
Ancestries: African (1.5%).
Current Local Time:
Land area: 10.1 square miles.
Population density: 9,077 people per square mile (high).
27,141 residents are foreign born (28.4% Latin America ).
This city:
29.3%California:
26.5%
Median real estate property taxes paid for housing units with mortgages in 2022: $4,245 (0.8%)Median real estate property taxes paid for housing units with no mortgage in 2022: $2,176 (0.4%)
Nearest city with pop. 200,000+: Long Beach, CA
Nearest city with pop. 1,000,000+: Los Angeles, CA
Nearest cities:
Latitude: 33.90 N, Longitude: 118.23 W
Nickname or alias (official or unofficial): The Hub City
Daytime population change due to commuting: -8,678 (-9.4%)Workers who live and work in this city: 6,459 (17.4%)
Property values in Compton, CA
Single-family new house construction building permits:
2022: 111 buildings , average cost: $111,5002021: 51 buildings , average cost: $82,2002020: 21 buildings , average cost: $79,0002019: 29 buildings , average cost: $180,3002018: 6 buildings , average cost: $116,1002017: 5 buildings , average cost: $223,4002016: 23 buildings , average cost: $245,6002015: 3 buildings , average cost: $186,0002014: 1 building , cost: $186,0002013: 4 buildings , average cost: $186,0002012: 1 building , cost: $245,4002011: 25 buildings , average cost: $107,2002010: 34 buildings , average cost: $109,2002009: 39 buildings , average cost: $93,3002008: 144 buildings , average cost: $132,7002007: 24 buildings , average cost: $114,1002006: 17 buildings , average cost: $100,4002005: 121 buildings , average cost: $131,9002004: 46 buildings , average cost: $89,6002003: 44 buildings , average cost: $86,6002002: 12 buildings , average cost: $140,9002001: 18 buildings , average cost: $135,5002000: 6 buildings , average cost: $96,3001999: 20 buildings , average cost: $87,2001998: 48 buildings , average cost: $118,8001997: 24 buildings , average cost: $108,700Unemployment in December 2023:
Population change in the 1990s: +3,068 (+3.4%).
Most common occupations in Compton, CA (%)
Both Males Females
Other production occupations, including supervisors (8.2%)
Laborers and material movers, hand (5.7%)
Building and grounds cleaning and maintenance occupations (5.1%)
Material recording, scheduling, dispatching, and distributing workers (5.0%)
Driver/sales workers and truck drivers (4.8%)
Other office and administrative support workers, including supervisors (4.3%)
Metal workers and plastic workers (3.6%)
Other production occupations, including supervisors (9.1%)
Driver/sales workers and truck drivers (8.2%)
Laborers and material movers, hand (7.0%)
Building and grounds cleaning and maintenance occupations (6.6%)
Material recording, scheduling, dispatching, and distributing workers (5.7%)
Metal workers and plastic workers (5.6%)
Electrical equipment mechanics and other installation, maintenance, and repair workers, including supervisors (3.8%)
Other production occupations, including supervisors (7.1%)
Other office and administrative support workers, including supervisors (6.8%)
Cashiers (5.2%)
Information and record clerks, except customer service representatives (4.3%)
Laborers and material movers, hand (4.2%)
Textile, apparel, and furnishings workers (4.1%)
Material recording, scheduling, dispatching, and distributing workers (4.1%)
Earthquake activity:
Compton-area historical earthquake activity is significantly above California state average. It is 6849% greater than the overall U.S. average. On 7/21/1952 at 11:52:14, a magnitude 7.7 (7.7 UK, Class: Major, Intensity: VIII - XII) earthquake occurred 88.2 miles away from the city center, causing $50,000,000 total damage On 6/28/1992 at 11:57:34, a magnitude 7.6 (6.2 MB, 7.6 MS, 7.3 MW, Depth: 0.7 mi) earthquake occurred 99.1 miles away from Compton center, causing 3 deaths ( 1 shaking deaths, 2 other deaths) and 400 injuries, causing $100,000,000 total damage and $40,000,000 insured lossesOn 10/16/1999 at 09:46:44, a magnitude 7.4 (6.3 MB, 7.4 MS, 7.2 MW, 7.3 ML) earthquake occurred 111.0 miles away from the city center On 11/4/1927 at 13:51:53, a magnitude 7.5 (7.5 UK) earthquake occurred 174.9 miles away from the city center On 1/17/1994 at 12:30:55, a magnitude 6.8 (6.4 MB, 6.8 MS, 6.7 MW, Depth: 11.4 mi, Class: Strong, Intensity: VII - IX) earthquake occurred 26.9 miles away from the city center, causing 60 deaths ( 60 shaking deaths) and 7000 injuriesOn 4/21/1918 at 22:32:30, a magnitude 6.8 (6.8 UK) earthquake occurred 45.5 miles away from Compton center Magnitude types: body-wave magnitude (MB), local magnitude (ML), surface-wave magnitude (MS), moment magnitude (MW) Natural disasters: The number of natural disasters in Los Angeles County (57) is a lot greater than the US average (15).Major Disasters (Presidential) Declared: 27Emergencies Declared: 3Fires: 37, Floods: 16, Storms: 9, Winter Storms: 6, Landslides: 5, Mudslides: 5, Earthquakes: 3, Freeze: 1, Heavy Rain: 1, Hurricane: 1, Snow: 1, Tornado: 1, Wind: 1, Other: 1 (Note: some incidents may be assigned to more than one category). Main business address for: ARDEN GROUP INC RETAIL-GROCERY STORES ).
Hospitals and medical centers in Compton: RAYMOND HOUSE (709 RAYMOND STREET) SUTTER HOUSE (711 RAYMOND STREET) VILLA MARIA ELENA HEALTHCARE C (2309 N SANTA FE AVE)
GATEWAY PLAZA DIALYSIS CENTER (1580 W. ROSECRANS AVENUE)
MOBILE DIALYSIS SERVICES, INC. (COMPTON) (801 W. COMPTON BLVD.)
Airports located in Compton: Amtrak stations near Compton: 9 miles: LONG BEACH (601 N. LONG BEACH BLVD.) - Bus Station Services: fully wheelchair accessible, public restrooms, public payphones, full-service food facilities, paid short-term parking, paid long-term parking, call for taxi service, public transit connection.
11 miles: SAN PEDRO (CATALINA TERMINAL, BERTH 95) - Bus Station Services: partially wheelchair accessible, enclosed waiting area, public restrooms, public payphones, snack bar, paid short-term parking, paid long-term parking, call for taxi service.
12 miles: LOS ANGELES (800 N. ALAMEDA ST.) Services: ticket office, fully wheelchair accessible, enclosed waiting area, public restrooms, public payphones, snack bar, free short-term parking, paid long-term parking, car rental agency, taxi stand, public transit connection.
College/University in Compton: El Camino College-Compton Center Full-time enrollment: 4,506; Location: 1111 East Artesia Blvd.; Public; Website: www.compton.edu)
Other colleges/universities with over 2000 students near Compton:
California State University-Dominguez Hills (about 3 miles; Carson, CA ; Full-time enrollment: 9,862)
Los Angeles Southwest College (about 6 miles; Los Angeles, CA ; FT enrollment: 3,247)
ICDC College (about 6 miles; Huntington Park, CA ; FT enrollment: 2,621)
El Camino Community College District (about 6 miles; Torrance, CA ; FT enrollment: 13,952)
United Education Institute-Huntington Park Campus (about 7 miles; Huntington Park, CA ; FT enrollment: 5,151)
Long Beach City College (about 7 miles; Long Beach, CA ; FT enrollment: 15,602)
Wyotech-Long Beach (about 8 miles; Long Beach, CA ; FT enrollment: 2,453)
Public high schools in Compton: DOMINGUEZ HIGH Students: 1,782, Location: 15301 S. SAN JOSE AVE., Grades: 9-12)COMPTON HIGH Students: 1,742, Location: 601 S. ACACIA ST., Grades: 9-12)CENTENNIAL HIGH Students: 965, Location: 2606 N. CENTRAL AVE., Grades: 9-12)LIFELINE EDUCATION CHARTER Students: 207, Location: 225 S. SANTA FE AVE., Grades: 6-12, Charter school )CESAR CHAVEZ CONTINUATION HIGH Students: 79, Location: 12501 N. WILMINGTON, Grades: 9-12)THURGOOD MARSHALL Students: 11, Location: 12501 N. WILMINGTON, Grades: KG-12)COMPTON COMMUNITY DAY HIGH Students: 9, Location: 2300 W. CALDWELL ST, Grades: 9-12)HARRIET TUBMAN HIGH Students: 2, Location: 12501 N. WILMINGTON, Grades: 9-12)COMPTON UNIFIED ROP Location: 700 N. BULLIS RD., Grades: 9-12)Private high schools in Compton: EKO MULTIPURPOSE CENTER Students: 34, Location: 403 S SANTA FE AVE, Grades: 1-12)
PROGRESSIVE ACHIEVEMENT CENTER Students: 24, Location: 302 N LONG BEACH BLVD, Grades: UG-12)
Biggest public elementary/middle schools in Compton: DAVIS MIDDLE Students: 1,175, Location: 621 W. POPLAR ST., Grades: 6-8)ROOSEVELT MIDDLE Students: 1,117, Location: 1200 E. ALONDRA BLVD., Grades: 6-8)WHALEY MIDDLE Students: 908, Location: 14401 S. GIBSON AVE., Grades: 6-8)BUNCHE MIDDLE Students: 730, Location: 12338 MONA BLVD., Grades: 6-8)ROOSEVELT ELEMENTARY Students: 603, Location: 700 N. BRADFIELD AVE., Grades: KG-6)ENTERPRISE MIDDLE Students: 559, Location: 2600 W. COMPTON BLVD., Grades: 6-8)KELLY ELEMENTARY Students: 559, Location: 2320 E. ALONDRA BLVD., Grades: KG-6)DICKISON ELEMENTARY Students: 548, Location: 905 N. ARANBE ST., Grades: KG-5)WALTON MIDDLE Students: 520, Location: 900 W. GREENLEAF AVE., Grades: 6-8)CLINTON, WILLIAM JEFFERSON Students: 477, Location: 6500 COMPTON BLVD., Grades: KG-7)Private elementary/middle schools in Compton: OPTIMAL CHRISTIAN ACADEMY Students: 311, Location: 1300 E PALMER ST, Grades: PK-8)
OUR LADY OF VICTORY SCHOOL Students: 107, Location: 601 E PALMER ST, Grades: KG-8)
FIRST CHRISTIAN NEW LIFE ACADEMY Students: 45, Location: 225 SOUTH SANTA FE AVENUE, Grades: PK-8)
ST TIMOTHYS EPISCOPAL SCHOOL Students: 44, Location: 312 S OLEANDER AVE, Grades: PK-8)
JUNIORVERSITY Students: 41, Location: 2400 S CENTRAL AVE, Grades: PK-1)
See full list of schools located in Compton User-submitted facts and corrections:
Roman Catholic Church in Compton: Sacred Heart Church, 1720 N. Culver Avenue, Compton, CA 90222
Local government website: http://www.comptoncity.org/
Notable locations in Compton: (A) , East Rancho Dominguez Branch Los Angeles County Public Library (B) , Compton Branch County of Los Angeles Public Library (C) , Cressey Park Fire Station (D) , Medreach Ambulance Service Rancho Dominguez (E) , Angeles Abbey Mausoleum (F) , Compton Sheriffs Station (G) , City of Compton Fire Department Station 4 (H) , City of Compton Fire Department Station 3 (I) , City of Compton Fire Department Station 2 (J) , City of Compton Fire Department Station 1 Headquarters (K) . Display/hide their locations on the map
Shopping Center: (1) . Display/hide its location on the map
Main business address in Compton: (A) . Display/hide its location on the map
Churches in Compton include: (A) , The Church of Jesus Christ of Latter Day Saints (B) , First Lutheran Church (C) , Grace Covenant Church (D) , Love and Unity Church of God in Christ (E) , Martin Temple African Methodist Episcopal Zion Church (F) , Our Lady of Victory Roman Catholic Church (G) , Saint Peters United Methodist Church (H) , Nehemiah Missionary Baptist Church (I) . Display/hide their locations on the map
Cemetery: (1) . Display/hide its location on the map
Parks in Compton include: (1) , South Park (2) , Burrel McDonald Park (3) , Wilson Park (4) , Tragview Park (5) , Doctor Walter R Tucker Park (6) , East Rancho Dominguez County Park (7) , Ellerman Park (8) , Gonzales Park (9) . Display/hide their locations on the map
Hotel:
Birthplace of: Brandon Jennings - Basketball player, Dr. Dre - African hip hop producer and rapper, Suge Knight - (born 1965), record producer, Krist Novoselic - (born 1966), a musician of Nirvana (band), Alex Acker - NBA player (Detroit Pistons, born : Jan 21, 1983), Dave Scott (choreographer) - Hip-hop choreographer and talent developer, DeLawrence Grant - 2005 NFL player (Oakland Raiders, born : Nov 18, 1979), DeMar DeRozan - Basketball player, B.G. Knocc Out - Rapper., DeVon Walker - Football player.
Los Angeles County has a predicted average indoor radon screening level between 2 and 4 pCi/L (pico curies per liter) - Moderate Potential Average household size: This city:
4.2 peopleCalifornia:
2.9 people
Percentage of family households: This city:
83.5%Whole state:
68.7%
Percentage of households with unmarried partners: This city:
8.2%Whole state:
7.2%
Likely homosexual households (counted as self-reported same-sex unmarried-partner households)
Lesbian couples: 0.5% of all households Gay men: 0.2% of all households
People in group quarters in Compton in 2010:
244 people in workers' group living quarters and job corps centers
140 people in emergency and transitional shelters (with sleeping facilities) for people experiencing homelessness
120 people in other noninstitutional facilities
104 people in group homes intended for adults
84 people in nursing facilities/skilled-nursing facilities
35 people in residential treatment centers for adults
20 people in group homes for juveniles (non-correctional)
8 people in correctional facilities intended for juveniles
People in group quarters in Compton in 2000:
270 people in other noninstitutional group quarters
184 people in homes or halfway houses for drug/alcohol abuse
73 people in nursing homes
53 people in other group homes
40 people in homes for the mentally retarded
10 people in other types of correctional institutions
10 people in homes for the physically handicapped
5 people in schools, hospitals, or wards for the intellectually disabled
5 people in unknown juvenile institutions
Banks with branches in Compton (2011 data):
Bank of America, National Association: East Compton Branch at 518 South Long Beach Boulevard, branch established on 1962/06/15; Gateway Towne Center at 242 Towne Center Drive, branch established on 2008/03/11. Info updated 2009/11/18: Bank assets: $1,451,969.3 mil, Deposits: $1,077,176.8 mil, headquarters in Charlotte, NC, positive income , 5782 total offices , Holding Company: Bank Of America Corporation
Wells Fargo Bank, National Association: Compton Gateway Plaza Branch at 1902 W. Rosecrans Ave, branch established on 2005/03/28; Compton Town Center at 1625 South Alameda Street, branch established on 2007/12/10. Info updated 2011/04/05: Bank assets: $1,161,490.0 mil, Deposits: $905,653.0 mil, headquarters in Sioux Falls, SD, positive income , 6395 total offices , Holding Company: Wells Fargo & Company
OneUnited Bank: E. Compton Blvd Branch at 205 E. Compton Boulevard, branch established on 1973/01/01. Info updated 2008/10/08: Bank assets: $562.4 mil, Deposits: $319.5 mil, headquarters in Boston, MA, positive income , Commercial Lending Specialization, 9 total offices
Bank of the West: Compton Branch at 1701 North Long Beach Boulevard, branch established on 1959/06/12. Info updated 2009/11/16: Bank assets: $62,408.3 mil, Deposits: $43,995.2 mil, headquarters in San Francisco, CA, positive income , 647 total offices , Holding Company: Bnp Paribas
For population 15 years and over in Compton:
Never married: 47.4%Now married: 41.7%Separated: 2.2%Widowed: 3.5%Divorced: 5.2% For population 25 years and over in Compton:
High school or higher: 65.4%Bachelor's degree or higher: 13.0%Graduate or professional degree: 4.7%Unemployed: 13.7%Mean travel time to work (commute): 23.9 minutes
Education Gini index (Inequality in education) Here:
21.0California average:
15.5
Religion statistics for Compton, CA (based on Los Angeles County data)
Religion Adherents Congregations Catholic 3,542,994 275 Evangelical Protestant 814,611 3,249 Other 451,594 1,023 Mainline Protestant 229,056 860 Black Protestant 112,338 290 Orthodox 63,517 76 None 4,604,495 -
Source: Clifford Grammich, Kirk Hadaway, Richard Houseal, Dale E.Jones, Alexei Krindatch, Richie Stanley and Richard H.Taylor. 2012. 2010 U.S.Religion Census: Religious Congregations & Membership Study. Association of Statisticians of American Religious Bodies. Jones, Dale E., et al. 2002. Congregations and Membership in the United States 2000. Nashville, TN: Glenmary Research Center. Graphs represent county-level data
Food Environment Statistics: Number of grocery stores : 2,084Los Angeles County :
2.12 / 10,000 pop.California :
2.14 / 10,000 pop.
Number of supercenters and club stores : 32This county :
0.03 / 10,000 pop.California :
0.04 / 10,000 pop.
Number of convenience stores (no gas) : 567This county :
0.58 / 10,000 pop.State :
0.62 / 10,000 pop.
Number of convenience stores (with gas) : 1,206Here :
1.23 / 10,000 pop.California :
1.49 / 10,000 pop.
Number of full-service restaurants : 7,008Los Angeles County :
7.15 / 10,000 pop.California :
7.42 / 10,000 pop.
Adult obesity rate : Los Angeles County :
20.4%California :
21.3%
Low-income preschool obesity rate : Los Angeles County :
18.6%State :
17.9%
Health and Nutrition: Healthy diet rate : Compton:
45.7%California:
49.4%
Average overall health of teeth and gums : Here:
45.6%California:
48.0%
People feeling badly about themselves : This city:
21.9%California:
20.2%
People not drinking alcohol at all : Compton:
10.7%California:
11.2%
Average hours sleeping at night : Overweight people : Compton:
31.8%California:
31.5%
General health condition : Here:
53.7%California:
56.4%
Average condition of hearing : This city:
83.1%State:
80.9%
More about Health and Nutrition of Compton, CA Residents
Local government employment and payroll (March 2022)
Function
Full-time employees
Monthly full-time payroll
Average yearly full-time wage
Part-time employees
Monthly part-time payroll
Firefighters
54 $739,322 $164,294 0 $0 Other and Unallocable
35 $207,933 $71,291 16 $12,588 Streets and Highways
28 $174,140 $74,631 0 $0 Water Supply
27 $152,672 $67,854 0 $0 Parks and Recreation
26 $125,241 $57,804 0 $0 Police - Other
24 $127,678 $63,839 0 $0 Other Government Administration
21 $164,072 $93,755 8 $29,920 Financial Administration
18 $119,785 $79,857 0 $0 Housing and Community Development (Local)
12 $81,851 $81,851 0 $0 Judicial and Legal
10 $98,723 $118,468 0 $0 Fire - Other
4 $22,047 $66,141 0 $0
Totals for Government
259 $2,013,463 $93,288 24 $42,509
Compton government finances - Expenditure in 2017 (per resident):
Construction - Housing and Community Development: $7,482,000 ($81.34)
Local Fire Protection: $611,000 ($6.64)General - Other: $502,000 ($5.46)Police Protection: $242,000 ($2.63)Current Operations - Central Staff Services: $40,130,000 ($436.25)
Police Protection: $23,598,000 ($256.53)Local Fire Protection: $17,428,000 ($189.46)Water Utilities: $12,398,000 ($134.78)Solid Waste Management: $11,079,000 ($120.44)Housing and Community Development: $8,839,000 ($96.09)Regular Highways: $4,141,000 ($45.02)Electric Utilities: $3,992,000 ($43.40)Protective Inspection and Regulation - Other: $1,954,000 ($21.24)Transit Utilities: $1,417,000 ($15.40)Parks and Recreation: $974,000 ($10.59)Sewerage: $294,000 ($3.20)Health - Other: $217,000 ($2.36)General - Interest on Debt: $2,377,000 ($25.84)
Other Capital Outlay - General - Other: $2,574,000 ($27.98)
Sewerage: $60,000 ($0.65)Central Staff Services: $5,000 ($0.05)Regular Highways: $5,000 ($0.05)Parks and Recreation: $4,000 ($0.04)
Compton government finances - Revenue in 2017 (per resident):
Charges - Solid Waste Management: $11,748,000 ($127.71)
Regular Highways: $4,113,000 ($44.71)Other: $2,397,000 ($26.06)Sewerage: $906,000 ($9.85)Parks and Recreation: $10,000 ($0.11)Federal Intergovernmental - Other: $10,721,000 ($116.55)
Housing and Community Development: $653,000 ($7.10)Local Intergovernmental - Other: $1,121,000 ($12.19)
Miscellaneous - Interest Earnings: $1,950,000 ($21.20)
Fines and Forfeits: $1,660,000 ($18.05)Rents: $294,000 ($3.20)Special Assessments: $163,000 ($1.77)General Revenue - Other: $10,000 ($0.11)Revenue - Water Utilities: $15,462,000 ($168.09)
Transit Utilities: $54,000 ($0.59)State Intergovernmental - Highways: $1,907,000 ($20.73)
Other: $391,000 ($4.25)General Local Government Support: $274,000 ($2.98)Tax - Property: $17,861,000 ($194.17)
Public Utilities Sales: $13,153,000 ($142.99)General Sales and Gross Receipts: $6,566,000 ($71.38)Occupation and Business License - Other: $3,562,000 ($38.72)Other License: $3,259,000 ($35.43)Documentary and Stock Transfer: $208,000 ($2.26)Other Selective Sales: $111,000 ($1.21)
Compton government finances - Debt in 2017 (per resident):
Long Term Debt - Beginning Outstanding - Unspecified Public Purpose: $113,453,000 ($1233.35)
Outstanding Unspecified Public Purpose: $103,544,000 ($1125.63)Retired Unspecified Public Purpose: $38,654,000 ($420.21)Issue, Unspecified Public Purpose: $28,745,000 ($312.49)
Compton government finances - Cash and Securities in 2017 (per resident):
Other Funds - Cash and Securities: $28,205,000 ($306.62)
Sinking Funds - Cash and Securities: $3,399,000 ($36.95)
2.98% of this county's 2021 resident taxpayers lived in other counties in 2020 ($81,235 average adjusted gross income )
Here:
2.98%California average:
5.19%
0.01% of residents moved from foreign countries ($155 average AGI )Los Angeles County:
0.01%California average:
0.03%
Top counties from which taxpayers relocated into this county between 2020 and 2021:
4.68% of this county's 2020 resident taxpayers moved to other counties in 2021 ($97,324 average adjusted gross income )
Here:
4.68%California average:
6.14%
0.01% of residents moved to foreign countries ($196 average AGI )Los Angeles County:
0.01%California average:
0.02%
Top counties to which taxpayers relocated from this county between 2020 and 2021:
Businesses in Compton, CA
Name Count Name Count
24 Hour Fitness 1 Little Caesars Pizza 2 7-Eleven 2 McDonald's 4 99 Cents Only Stores 1 Nike 4 AT&T 1 Panda Express 2 AutoZone 3 Payless 2 Baskin-Robbins 1 Pizza Hut 1 Burger King 1 Popeyes 1 Burlington Coat Factory 1 RadioShack 1 CVS 2 Rite Aid 2 Carl\s Jr. 2 Rodeway Inn 1 Church's Chicken 1 Staples 1 Domino's Pizza 1 Starbucks 4 El Pollo Loco 1 Subway 6 FedEx 6 T-Mobile 4 GNC 3 T.G.I. Driday's 1 GameStop 3 Taco Bell 2 H&R Block 3 Target 1 Home Depot 1 The Room Place 1 IHOP 1 Toys"R"Us 1 Jack In The Box 2 True Value 1 KFC 2 U-Haul 1 Kroger 2 UPS 6
Strongest AM radio stations in Compton:
KNX (1070 AM; 50 kW; LOS ANGELES, CA; Owner: INFINITY BROADCASTING OPERATIONS, INC.)
KLTX (1390 AM; 5 kW; LONG BEACH, CA; Owner: HI-FAVOR BROADCASTING, LLC)
KFI (640 AM; 50 kW; LOS ANGELES, CA; Owner: CAPSTAR TX LIMITED PARTNERSHIP)
KFWB (980 AM; 50 kW; LOS ANGELES, CA; Owner: INFINITY BROADCASTING OPERATIONS, INC.)
KLAC (570 AM; 50 kW; LOS ANGELES, CA; Owner: AMFM RADIO LICENSES, L.L.C.)
KMPC (1540 AM; 50 kW; LOS ANGELES, CA; Owner: ROSE CITY RADIO CORPORATION)
KBLA (1580 AM; 50 kW; SANTA MONICA, CA)
KTNQ (1020 AM; 50 kW; LOS ANGELES, CA; Owner: KTNQ-AM LICENSE CORP.)
KXTA (1150 AM; 50 kW; LOS ANGELES, CA; Owner: CITICASTERS LICENSES, L.P.)
KSPN (710 AM; 50 kW; LOS ANGELES, CA; Owner: KABC-AM RADIO, INC.)
KXMX (1190 AM; 25 kW; ANAHEIM, CA; Owner: NEW INSPIRATION BROADCASTING COMPANY)
KDIS (1110 AM; 50 kW; PASADENA, CA; Owner: ABC,INC.)
KRLA (870 AM; 20 kW; GLENDALE, CA; Owner: NEW INSPIRATION BROADCASTING COMPANY)
Strongest FM radio stations in Compton:
KBUE (105.5 FM; LONG BEACH, CA; Owner: LBI RADIO LICENSE CORP.)
KZLA-FM (93.9 FM; LOS ANGELES, CA; Owner: EMMIS RADIO LICENSE CORPORATION)
KKBT (100.3 FM; LOS ANGELES, CA; Owner: RADIO ONE LICENSES, LLC)
KPWR (105.9 FM; LOS ANGELES, CA; Owner: EMMIS RADIO LICENSE CORPORATION)
KLSX (97.1 FM; LOS ANGELES, CA; Owner: INFINITY BROADCASTING OPERATIONS, INC.)
KUSC (91.5 FM; LOS ANGELES, CA; Owner: UNIVERSITY OF SOUTHERN CALIFORNIA)
KKLA-FM (99.5 FM; LOS ANGELES, CA; Owner: NEW INSPIRATION BROADCASTING CO., INC.)
KRTH-FM (101.1 FM; LOS ANGELES, CA; Owner: INFINITY BROADCASTING OPERATIONS, INC.)
KCBS-FM (93.1 FM; LOS ANGELES, CA; Owner: INFINITY BROADCASTING OPERATIONS, INC.)
KSCA (101.9 FM; GLENDALE, CA; Owner: HBC LICENSE CORPORATION)
KLOS (95.5 FM; LOS ANGELES, CA; Owner: KLOS-FM RADIO, INC.)
K212FA (90.3 FM; TEMPLE CITY, CA; Owner: EDUCATIONAL MEDIA FOUNDATION)
KOST (103.5 FM; LOS ANGELES, CA; Owner: CAPSTAR TX LIMITED PARTNERSHIP)
KLVE (107.5 FM; LOS ANGELES, CA; Owner: KLVE-FM LICENSE CORP.)
KIIS-FM (102.7 FM; LOS ANGELES, CA; Owner: CITICASTERS LICENSES, L.P.)
KPCC (89.3 FM; PASADENA, CA; Owner: PASADENA AREA COMMUNITY COLLEGE DISTRICT)
KHHT (92.3 FM; LOS ANGELES, CA; Owner: AMFM RADIO LICENSES, L.L.C.)
KBIG-FM (104.3 FM; LOS ANGELES, CA; Owner: AMFM RADIO LICENSES, L.L.C.)
KLAX-FM (97.9 FM; EAST LOS ANGELES, CA; Owner: KLAX LICENSING, INC.)
KMZT-FM (105.1 FM; LOS ANGELES, CA; Owner: MOUNT WILSON FM BROADCASTERS, INC.)
TV broadcast stations around Compton:
KTRO-LP (Channel 50; LANCASTER, CA; Owner: ROBERT D. ADELMAN)
KCBS-TV (Channel 2; LOS ANGELES, CA; Owner: CBS BROADCASTING INC.)
KTLA-TV (Channel 5; LOS ANGELES, CA; Owner: KTLA INC.)
KABC-TV (Channel 7; LOS ANGELES, CA; Owner: ABC HOLDING COMPANY, INC.)
KCAL-TV (Channel 9; LOS ANGELES, CA; Owner: VIACOM TELEVISION STATIONS GROUP OF LOS ANGELES LLC)
KNBC (Channel 4; LOS ANGELES, CA; Owner: NBC SUBSIDIARY (KNBC-TV), INC.)
KMEX-TV (Channel 34; LOS ANGELES, CA; Owner: KMEX LICENSE PARTNERSHIP, G.P.)
KAZA-TV (Channel 54; AVALON, CA; Owner: PAPPAS SOUTHERN CALIFORNIA LICENSE LLC)
KDOC-TV (Channel 56; ANAHEIM, CA; Owner: GOLDEN ORANGE BROADCASTING CO., INC.)
KOCE-TV (Channel 50; HUNTINGTON BEACH, CA; Owner: BD. OF TRUSTEES, COAST COMMUNITY COLLEGE DIST.)
KSCI (Channel 18; LONG BEACH, CA; Owner: KSLS, INC.)
KXLA (Channel 44; RANCHO PALOS VERDES, CA; Owner: RANCHO PALOS VERDES BROADCASTERS, INC.)
KCET (Channel 28; LOS ANGELES, CA; Owner: COMMUNITY TELEVISION OF SOUTHERN CALIFORNIA)
KFTR (Channel 46; ONTARIO, CA; Owner: TELEFUTURA LOS ANGELES LLC)
National Bridge Inventory (NBI) Statistics 65 Number of bridges1,135ft / 346m Total length $79,452,000 Total costs3,384,538 Total average daily traffic235,193 Total average daily truck traffic
New bridges - historical statistics
1 1910-1919 7 1930-1939 1 1940-1949 10 1950-1959 1 1960-1969 16 1970-1979 12 1980-1989 12 1990-1999 5 2000-2009
See full National Bridge Inventory statistics for Compton, CA
Home Mortgage Disclosure Act Aggregated Statistics For Year 2009(Based on 17 full and 8 partial tracts) A) FHA, FSA/RHS & VA B) Conventional C) Refinancings D) Home Improvement Loans E) Loans on Dwellings For 5+ Families F) Non-occupant Loans on G) Loans On Manufactured Number Average Value Number Average Value Number Average Value Number Average Value Number Average Value Number Average Value Number Average Value
LOANS ORIGINATED 525 $194,398 152 $144,235 311 $183,175 21 $88,400 6 $429,173 84 $140,680 4 $37,308 APPLICATIONS APPROVED, NOT ACCEPTED 60 $196,454 29 $171,920 91 $198,704 4 $16,978 0 $0 15 $199,445 2 $57,900 APPLICATIONS DENIED 164 $199,586 72 $141,228 448 $220,539 44 $81,335 0 $0 65 $160,471 11 $49,655 APPLICATIONS WITHDRAWN 109 $196,467 53 $122,284 139 $198,277 20 $125,064 0 $0 30 $147,403 1 $32,290 FILES CLOSED FOR INCOMPLETENESS 34 $192,985 19 $152,999 74 $235,510 3 $106,113 0 $0 19 $169,384 0 $0
Aggregated Statistics For Year 2008(Based on 17 full and 8 partial tracts) A) FHA, FSA/RHS & VA B) Conventional C) Refinancings D) Home Improvement Loans E) Loans on Dwellings For 5+ Families F) Non-occupant Loans on G) Loans On Manufactured Number Average Value Number Average Value Number Average Value Number Average Value Number Average Value Number Average Value Number Average Value
LOANS ORIGINATED 91 $231,725 223 $196,357 641 $236,239 99 $165,883 11 $691,827 137 $220,594 6 $67,762 APPLICATIONS APPROVED, NOT ACCEPTED 31 $232,276 93 $221,236 277 $255,683 36 $111,394 0 $0 46 $240,141 9 $71,122 APPLICATIONS DENIED 78 $231,307 173 $249,118 1,084 $277,395 213 $112,244 8 $711,288 136 $239,986 18 $130,872 APPLICATIONS WITHDRAWN 49 $215,341 94 $194,320 334 $266,865 42 $149,231 3 $456,930 42 $240,510 3 $213,717 FILES CLOSED FOR INCOMPLETENESS 8 $241,204 31 $267,344 132 $290,248 22 $145,358 1 $1,550,000 19 $268,336 0 $0
Aggregated Statistics For Year 2007(Based on 17 full and 8 partial tracts) A) FHA, FSA/RHS & VA B) Conventional C) Refinancings D) Home Improvement Loans E) Loans on Dwellings For 5+ Families F) Non-occupant Loans on G) Loans On Manufactured Number Average Value Number Average Value Number Average Value Number Average Value Number Average Value Number Average Value Number Average Value
LOANS ORIGINATED 11 $325,666 684 $265,558 2,335 $274,371 336 $204,329 19 $516,911 321 $274,240 12 $70,735 APPLICATIONS APPROVED, NOT ACCEPTED 0 $0 242 $264,280 783 $289,242 87 $180,249 1 $450,000 102 $270,045 14 $68,293 APPLICATIONS DENIED 14 $225,784 738 $279,693 2,191 $307,199 434 $155,615 3 $445,810 267 $291,208 22 $79,751 APPLICATIONS WITHDRAWN 7 $262,863 223 $252,384 873 $287,666 112 $196,224 4 $562,835 88 $279,994 0 $0 FILES CLOSED FOR INCOMPLETENESS 0 $0 107 $279,796 319 $297,120 35 $240,913 0 $0 32 $318,765 2 $271,000
Aggregated Statistics For Year 2006(Based on 17 full and 8 partial tracts) A) FHA, FSA/RHS & VA B) Conventional C) Refinancings D) Home Improvement Loans E) Loans on Dwellings For 5+ Families F) Non-occupant Loans on G) Loans On Manufactured Number Average Value Number Average Value Number Average Value Number Average Value Number Average Value Number Average Value Number Average Value
LOANS ORIGINATED 2 $253,495 1,774 $228,838 3,792 $263,983 536 $196,905 25 $842,256 531 $252,503 9 $78,686 APPLICATIONS APPROVED, NOT ACCEPTED 0 $0 464 $231,873 895 $260,414 116 $194,079 0 $0 157 $274,033 12 $58,515 APPLICATIONS DENIED 0 $0 1,132 $241,749 2,383 $278,652 475 $151,537 9 $566,356 314 $270,969 15 $89,417 APPLICATIONS WITHDRAWN 1 $264,000 589 $233,273 1,620 $268,823 143 $192,644 3 $367,000 157 $258,010 3 $137,333 FILES CLOSED FOR INCOMPLETENESS 1 $158,460 110 $229,525 396 $260,309 27 $204,690 0 $0 38 $272,128 1 $47,730
Aggregated Statistics For Year 2005(Based on 17 full and 8 partial tracts) A) FHA, FSA/RHS & VA B) Conventional C) Refinancings D) Home Improvement Loans E) Loans on Dwellings For 5+ Families F) Non-occupant Loans on G) Loans On Manufactured Number Average Value Number Average Value Number Average Value Number Average Value Number Average Value Number Average Value Number Average Value
LOANS ORIGINATED 8 $245,578 1,941 $194,053 4,477 $220,897 465 $177,329 34 $564,957 631 $206,794 16 $87,916 APPLICATIONS APPROVED, NOT ACCEPTED 2 $165,500 522 $192,606 915 $211,597 72 $130,505 0 $0 154 $206,668 24 $95,676 APPLICATIONS DENIED 6 $201,593 895 $199,995 2,371 $227,250 440 $130,750 5 $479,666 261 $230,107 24 $79,357 APPLICATIONS WITHDRAWN 2 $145,665 549 $197,432 1,926 $220,900 156 $179,564 4 $3,277,242 201 $215,899 14 $106,784 FILES CLOSED FOR INCOMPLETENESS 0 $0 101 $223,085 426 $222,542 24 $173,834 0 $0 37 $207,560 1 $188,000
Aggregated Statistics For Year 2004(Based on 17 full and 8 partial tracts) A) FHA, FSA/RHS & VA B) Conventional C) Refinancings D) Home Improvement Loans E) Loans on Dwellings For 5+ Families F) Non-occupant Loans on G) Loans On Manufactured Number Average Value Number Average Value Number Average Value Number Average Value Number Average Value Number Average Value Number Average Value
LOANS ORIGINATED 53 $227,190 1,833 $153,549 4,205 $174,209 401 $138,157 32 $982,875 561 $173,418 5 $54,746 APPLICATIONS APPROVED, NOT ACCEPTED 12 $211,718 538 $166,347 1,016 $170,518 99 $149,634 4 $452,828 164 $167,312 11 $57,203 APPLICATIONS DENIED 9 $210,104 832 $155,395 2,171 $170,854 383 $104,806 6 $405,912 241 $177,608 18 $34,327 APPLICATIONS WITHDRAWN 19 $219,951 439 $158,627 1,444 $170,695 114 $119,340 2 $2,411,590 109 $172,217 3 $26,000 FILES CLOSED FOR INCOMPLETENESS 8 $178,624 94 $149,969 428 $173,288 28 $109,155 0 $0 44 $166,414 1 $72,680
Aggregated Statistics For Year 2003(Based on 17 full and 8 partial tracts) A) FHA, FSA/RHS & VA B) Conventional C) Refinancings D) Home Improvement Loans E) Loans on Dwellings For 5+ Families F) Non-occupant Loans on Number Average Value Number Average Value Number Average Value Number Average Value Number Average Value Number Average Value
LOANS ORIGINATED 192 $171,121 1,240 $131,694 3,676 $135,534 81 $50,090 30 $381,882 475 $133,528 APPLICATIONS APPROVED, NOT ACCEPTED 22 $162,776 323 $134,825 775 $137,914 36 $59,351 1 $664,640 159 $138,267 APPLICATIONS DENIED 43 $169,626 587 $131,895 2,132 $137,719 164 $36,397 7 $368,437 201 $142,550 APPLICATIONS WITHDRAWN 48 $178,588 253 $139,953 1,275 $137,120 32 $55,626 7 $419,827 103 $135,774 FILES CLOSED FOR INCOMPLETENESS 11 $158,345 38 $131,948 222 $138,585 5 $28,018 0 $0 26 $137,909
Aggregated Statistics For Year 2002(Based on 7 full and 7 partial tracts) A) FHA, FSA/RHS & VA B) Conventional C) Refinancings D) Home Improvement Loans E) Loans on Dwellings For 5+ Families F) Non-occupant Loans on Number Average Value Number Average Value Number Average Value Number Average Value Number Average Value Number Average Value
LOANS ORIGINATED 205 $148,142 549 $111,581 1,226 $121,749 46 $27,340 6 $975,468 163 $104,403 APPLICATIONS APPROVED, NOT ACCEPTED 22 $137,465 114 $115,338 305 $123,142 8 $34,762 0 $0 33 $117,775 APPLICATIONS DENIED 43 $142,515 251 $111,233 870 $122,733 95 $26,525 1 $523,020 76 $115,422 APPLICATIONS WITHDRAWN 41 $139,792 116 $112,403 572 $130,604 26 $32,095 2 $1,079,300 27 $114,479 FILES CLOSED FOR INCOMPLETENESS 6 $159,278 40 $125,313 343 $130,008 0 $0 0 $0 19 $104,994
Aggregated Statistics For Year 2001(Based on 7 full and 7 partial tracts) A) FHA, FSA/RHS & VA B) Conventional C) Refinancings D) Home Improvement Loans E) Loans on Dwellings For 5+ Families F) Non-occupant Loans on Number Average Value Number Average Value Number Average Value Number Average Value Number Average Value Number Average Value
LOANS ORIGINATED 254 $133,329 363 $100,846 911 $113,983 42 $28,340 2 $1,087,820 166 $102,791 APPLICATIONS APPROVED, NOT ACCEPTED 35 $140,104 70 $106,168 187 $113,607 10 $28,246 1 $398,000 25 $99,957 APPLICATIONS DENIED 54 $137,298 168 $105,464 1,002 $108,459 155 $26,477 1 $37,220 73 $106,733 APPLICATIONS WITHDRAWN 55 $138,403 82 $119,201 497 $117,894 42 $29,317 0 $0 26 $119,176 FILES CLOSED FOR INCOMPLETENESS 20 $137,816 15 $89,105 173 $122,970 8 $39,896 0 $0 12 $97,805
Aggregated Statistics For Year 2000(Based on 7 full and 7 partial tracts) A) FHA, FSA/RHS & VA B) Conventional C) Refinancings D) Home Improvement Loans E) Loans on Dwellings For 5+ Families F) Non-occupant Loans on Number Average Value Number Average Value Number Average Value Number Average Value Number Average Value Number Average Value
LOANS ORIGINATED 350 $123,948 275 $93,010 467 $99,587 56 $27,334 13 $167,593 91 $86,112 APPLICATIONS APPROVED, NOT ACCEPTED 34 $123,791 55 $100,092 146 $94,883 27 $33,415 0 $0 21 $105,841 APPLICATIONS DENIED 87 $133,540 151 $104,215 682 $94,350 133 $26,344 2 $858,650 59 $106,629 APPLICATIONS WITHDRAWN 52 $129,767 79 $103,299 280 $93,822 20 $29,860 0 $0 21 $109,444 FILES CLOSED FOR INCOMPLETENESS 15 $127,709 17 $99,448 224 $116,203 1 $13,030 0 $0 23 $116,776
Aggregated Statistics For Year 1999(Based on 8 full and 14 partial tracts) A) FHA, FSA/RHS & VA B) Conventional C) Refinancings D) Home Improvement Loans E) Loans on Dwellings For 5+ Families F) Non-occupant Loans on Number Average Value Number Average Value Number Average Value Number Average Value Number Average Value Number Average Value
LOANS ORIGINATED 533 $125,101 390 $128,613 1,105 $100,090 213 $14,571 14 $192,713 245 $86,197 APPLICATIONS APPROVED, NOT ACCEPTED 36 $125,652 71 $93,668 350 $97,556 80 $24,782 4 $126,958 56 $86,053 APPLICATIONS DENIED 141 $133,596 225 $103,952 1,232 $98,216 261 $20,214 15 $257,901 154 $95,758 APPLICATIONS WITHDRAWN 76 $124,764 111 $106,995 595 $100,067 25 $25,088 11 $188,817 60 $108,729 FILES CLOSED FOR INCOMPLETENESS 19 $145,814 24 $93,050 406 $105,216 1 $88,970 1 $90,720 38 $97,755
Detailed mortgage data for all 25 tracts in Compton, CA
Private Mortgage Insurance Companies Aggregated Statistics For Year 2009(Based on 15 full and 7 partial tracts) A) Conventional B) Refinancings C) Non-occupant Loans on Number Average Value Number Average Value Number Average Value
LOANS ORIGINATED 40 $172,830 4 $236,150 0 $0 APPLICATIONS APPROVED, NOT ACCEPTED 29 $232,362 2 $265,850 1 $526,190 APPLICATIONS DENIED 8 $193,545 3 $218,137 1 $215,000 APPLICATIONS WITHDRAWN 2 $200,500 0 $0 0 $0 FILES CLOSED FOR INCOMPLETENESS 2 $228,410 1 $503,500 0 $0
Aggregated Statistics For Year 2008(Based on 17 full and 7 partial tracts) A) Conventional B) Refinancings C) Non-occupant Loans on Number Average Value Number Average Value Number Average Value
LOANS ORIGINATED 96 $290,045 58 $360,424 2 $335,240 APPLICATIONS APPROVED, NOT ACCEPTED 93 $350,956 120 $373,407 3 $365,127 APPLICATIONS DENIED 22 $253,870 20 $359,716 5 $301,790 APPLICATIONS WITHDRAWN 7 $308,540 9 $404,018 1 $405,000 FILES CLOSED FOR INCOMPLETENESS 8 $341,951 6 $366,695 4 $358,568
Aggregated Statistics For Year 2007(Based on 17 full and 7 partial tracts) A) Conventional B) Refinancings C) Non-occupant Loans on Number Average Value Number Average Value Number Average Value
LOANS ORIGINATED 99 $375,858 107 $379,089 3 $330,043 APPLICATIONS APPROVED, NOT ACCEPTED 18 $354,134 31 $373,635 3 $332,160 APPLICATIONS DENIED 13 $381,552 19 $405,381 2 $409,155 APPLICATIONS WITHDRAWN 4 $424,662 10 $391,791 0 $0 FILES CLOSED FOR INCOMPLETENESS 0 $0 1 $414,000 0 $0
Aggregated Statistics For Year 2006(Based on 16 full and 7 partial tracts) A) Conventional B) Refinancings C) Non-occupant Loans on Number Average Value Number Average Value Number Average Value
LOANS ORIGINATED 30 $369,495 50 $365,559 3 $310,920 APPLICATIONS APPROVED, NOT ACCEPTED 6 $353,897 22 $328,082 0 $0 APPLICATIONS DENIED 1 $476,390 4 $326,570 0 $0 APPLICATIONS WITHDRAWN 1 $576,000 7 $326,621 2 $481,500 FILES CLOSED FOR INCOMPLETENESS 0 $0 0 $0 0 $0
Aggregated Statistics For Year 2005(Based on 16 full and 7 partial tracts) A) Conventional B) Refinancings C) Non-occupant Loans on Number Average Value Number Average Value Number Average Value
LOANS ORIGINATED 49 $301,350 56 $287,735 2 $178,640 APPLICATIONS APPROVED, NOT ACCEPTED 18 $258,512 15 $255,407 2 $221,815 APPLICATIONS DENIED 2 $139,420 3 $329,287 1 $274,840 APPLICATIONS WITHDRAWN 5 $290,198 5 $261,068 2 $289,280 FILES CLOSED FOR INCOMPLETENESS 1 $239,000 0 $0 1 $239,000
Aggregated Statistics For Year 2004(Based on 17 full and 7 partial tracts) A) Conventional B) Refinancings C) Non-occupant Loans on Number Average Value Number Average Value Number Average Value
LOANS ORIGINATED 165 $215,111 64 $192,264 21 $216,356 APPLICATIONS APPROVED, NOT ACCEPTED 58 $205,150 36 $168,993 12 $235,030 APPLICATIONS DENIED 2 $224,555 1 $254,330 0 $0 APPLICATIONS WITHDRAWN 9 $219,776 14 $206,545 4 $163,010 FILES CLOSED FOR INCOMPLETENESS 4 $190,335 4 $147,275 1 $85,890
Aggregated Statistics For Year 2003(Based on 17 full and 7 partial tracts) A) Conventional B) Refinancings C) Non-occupant Loans on Number Average Value Number Average Value Number Average Value
LOANS ORIGINATED 294 $171,133 178 $152,162 18 $166,751 APPLICATIONS APPROVED, NOT ACCEPTED 46 $165,119 66 $152,480 4 $159,540 APPLICATIONS DENIED 7 $181,014 5 $159,194 1 $130,000 APPLICATIONS WITHDRAWN 7 $175,536 9 $157,234 1 $232,430 FILES CLOSED FOR INCOMPLETENESS 2 $217,000 1 $203,310 1 $313,000
Aggregated Statistics For Year 2002(Based on 7 full and 7 partial tracts) A) Conventional B) Refinancings C) Non-occupant Loans on Number Average Value Number Average Value Number Average Value
LOANS ORIGINATED 204 $145,684 92 $139,591 8 $119,554 APPLICATIONS APPROVED, NOT ACCEPTED 36 $127,726 35 $140,411 6 $101,610 APPLICATIONS DENIED 3 $82,867 3 $178,343 0 $0 APPLICATIONS WITHDRAWN 8 $113,379 9 $137,557 1 $144,970 FILES CLOSED FOR INCOMPLETENESS 0 $0 2 $132,115 0 $0
Aggregated Statistics For Year 2001(Based on 7 full and 7 partial tracts) A) Conventional B) Refinancings C) Non-occupant Loans on Number Average Value Number Average Value Number Average Value
LOANS ORIGINATED 134 $125,382 74 $133,920 9 $102,162 APPLICATIONS APPROVED, NOT ACCEPTED 33 $122,227 31 $132,803 7 $113,770 APPLICATIONS DENIED 9 $136,160 6 $139,890 2 $110,735 APPLICATIONS WITHDRAWN 5 $138,698 4 $127,965 2 $148,580 FILES CLOSED FOR INCOMPLETENESS 2 $116,500 0 $0 0 $0
Aggregated Statistics For Year 2000(Based on 7 full and 7 partial tracts) A) Conventional B) Refinancings C) Non-occupant Loans on Number Average Value Number Average Value Number Average Value
LOANS ORIGINATED 99 $118,015 67 $114,251 13 $95,389 APPLICATIONS APPROVED, NOT ACCEPTED 15 $132,068 14 $131,366 1 $125,970 APPLICATIONS DENIED 7 $130,607 3 $127,117 1 $58,930 APPLICATIONS WITHDRAWN 2 $116,430 3 $136,827 0 $0 FILES CLOSED FOR INCOMPLETENESS 0 $0 1 $110,680 0 $0
Aggregated Statistics For Year 1999(Based on 8 full and 14 partial tracts) A) Conventional B) Refinancings C) Non-occupant Loans on Number Average Value Number Average Value Number Average Value
LOANS ORIGINATED 64 $113,294 107 $122,201 8 $113,572 APPLICATIONS APPROVED, NOT ACCEPTED 10 $125,067 31 $120,680 3 $105,987 APPLICATIONS DENIED 6 $120,633 12 $125,833 3 $130,717 APPLICATIONS WITHDRAWN 4 $118,550 5 $119,582 1 $162,000 FILES CLOSED FOR INCOMPLETENESS 1 $149,460 3 $133,767 0 $0
Most common first names in Compton, CA among deceased individuals Name Count Lived (average)
James 418 67.2 years John 348 69.3 years Mary 329 73.9 years William 322 71.0 years Willie 318 68.7 years Robert 293 68.3 years Charles 182 66.9 years George 175 72.3 years Joseph 147 70.3 years Maria 143 72.0 years
Most common last names in Compton, CA among deceased individuals Last name Count Lived (average)
Williams 343 67.0 years Johnson 328 70.5 years Smith 302 69.2 years Jones 255 68.1 years Brown 210 66.7 years Jackson 175 70.7 years Davis 174 68.3 years Thomas 125 65.0 years Taylor 124 68.4 years Moore 124 67.1 years
Compton compared to California state average:
Black race population percentage significantly above state average. Hispanic race population percentage above state average. Median age below state average. Percentage of population with a bachelor's degree or higher below state average. Compton, CA compared to other similar cities:
#5 on the list of "Top 101 cities with the least people having Master's or Doctorate degrees (population 50,000+)"
#6 on the list of "Top 101 cities with the highest ratio of murders to rapes between 2002 and 2012 (population 50,000+)"
#7 on the list of "Top 101 cities with fewest building permits per 10,000 residents (population 50,000+)"
#9 on the list of "Top 100 least-educated cities (pop. 50,000+)"
#12 on the list of "Top 101 cities with largest percentage of females in industries: transportation and warehousing (population 50,000+)"
#12 on the list of "Top 101 cities with largest percentage of males in occupations: office and administrative support occupations (population 50,000+)"
#15 on the list of "Top 101 cities with largest percentage of females in occupations: fire fighting and prevention workers including supervisors (population 50,000+)"
#16 on the list of "Top 101 cities with the least people having Doctorate degrees (population 50,000+)"
#17 on the list of "Top 101 cities with largest percentage of females in occupations: material moving occupations (population 50,000+)"
#18 on the list of "Top 101 cities with largest percentage of females in occupations: transportation occupations (population 50,000+)"
#18 on the list of "Top 101 cities with the least people having professional degrees (population 50,000+)"
#21 on the list of "Top 101 cities with largest percentage of females in industries: manufacturing (population 50,000+)"
#22 on the list of "Top 101 cities with largest percentage of females in occupations: production occupations (population 50,000+)"
#24 on the list of "Top 101 cities with the highest number of murders per 100,000 residents, excludes tourist destinations and others with a lot of outsiders visiting based on city industries data (population 50,000+)"
#26 on the list of "Top 101 cities with the highest number of assaults per 100,000 residents, excludes tourist destinations and others with a lot of outsiders visiting based on city industries data (population 50,000+)"
#28 on the list of "Top 101 cities with largest percentage of males in occupations: material moving occupations (population 50,000+)"
#28 on the list of "Top 101 cities with the smallest house values disparities (population 50,000+)"
#34 on the list of "Top 101 cities with largest percentage of males in industries: transportation and warehousing (population 50,000+)"
#34 on the list of "Top 101 cities with the highest number of robberies per 100,000 residents, excludes tourist destinations and others with a lot of outsiders visiting based on city industries data (population 50,000+)"
#37 on the list of "Top 101 cities with the lowest number of thefts per 100,000 residents (population 50,000+)"
#18 (90059) on the list of "Top 101 zip codes with the lowest 2012 average taxable interest for individuals (pop 5,000+)"
#47 (90262) on the list of "Top 101 zip codes with the largest percentage of taxpayers using paid preparers for 2012 taxes (pop 5,000+)"
#61 (90059) on the list of "Top 101 zip codes with the largest percentage of Subsaharan African first ancestries"
#81 (90262) on the list of "Top 101 zip codes with the largest percentage of Greek first ancestries (pop 5,000+)"
#1 on the list of "Top 101 counties with the most Evangelical Protestant congregations"
#1 on the list of "Top 101 counties with the most Mainline Protestant congregations"
#1 on the list of "Top 101 counties with the most Orthodox adherents"
#1 on the list of "Top 101 counties with the highest ground withdrawal of fresh water for public supply (pop. 50,000+)"
#1 on the list of "Top 101 counties with the most Catholic adherents (pop. 50,000+)"
Top Patent Applicants
Debra Dunne (2)
Nanci Freeman (2)
Dave Werthmann (1)
Cord Rodman (1)
Rosalind Mcgary (1)
Ips Corporation (1)
Lisa A. Osborne (1)
Michael D. Hatter (1)
Irs, Corporation-Weld-On-Division (1)
Frank Casale (1)
Total of 11 patent applications in 2008-2024.
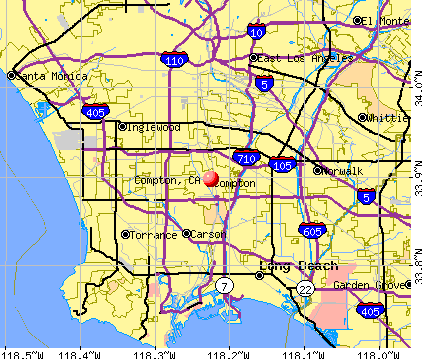


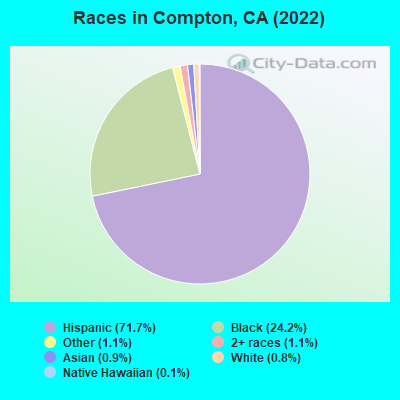
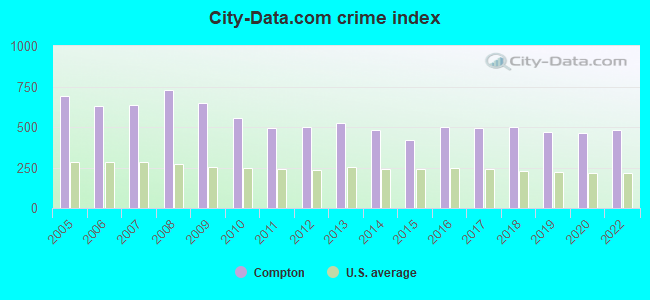
 Recent articles from our blog. Our writers, many of them Ph.D. graduates or candidates, create easy-to-read articles on a wide variety of topics.

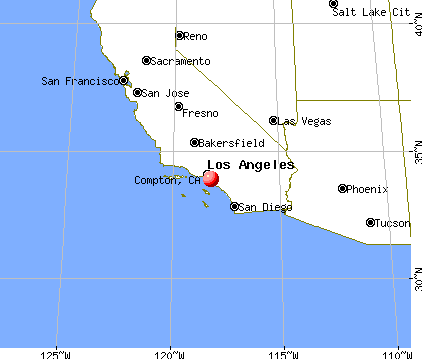
 (7.5 miles
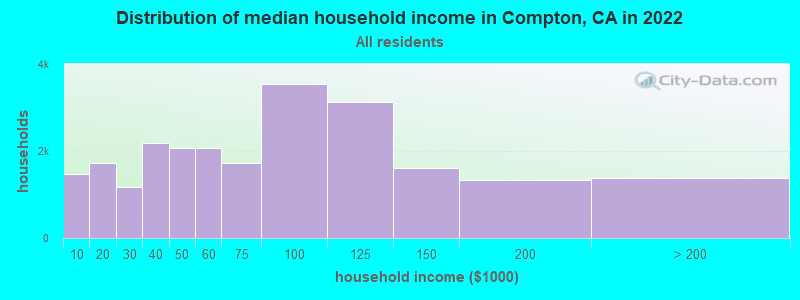
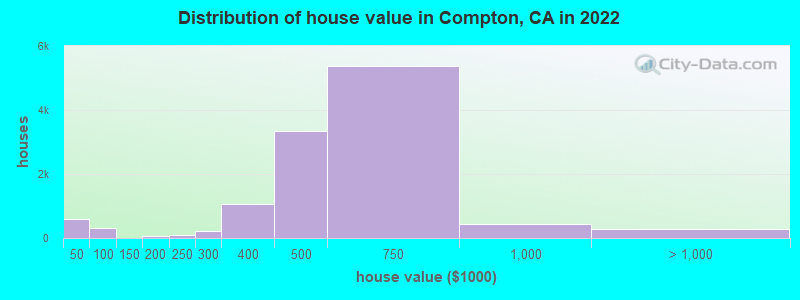
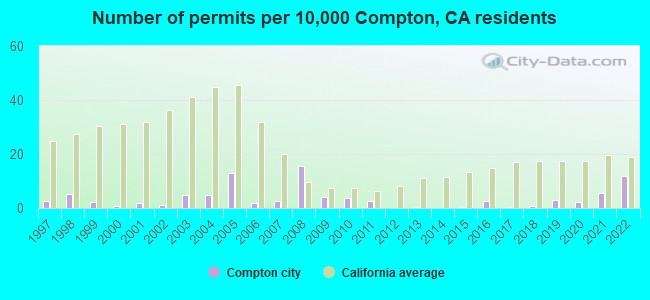
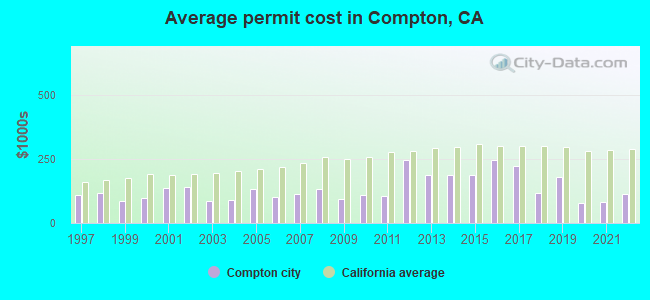
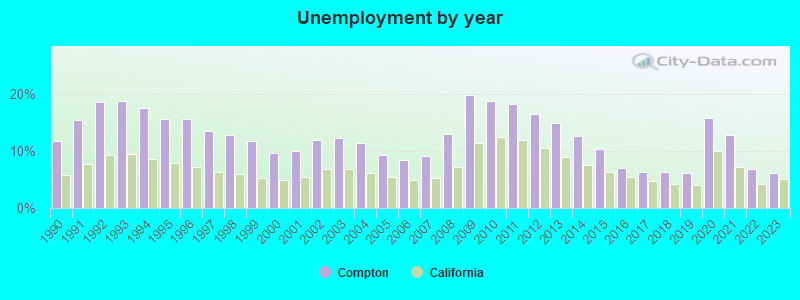
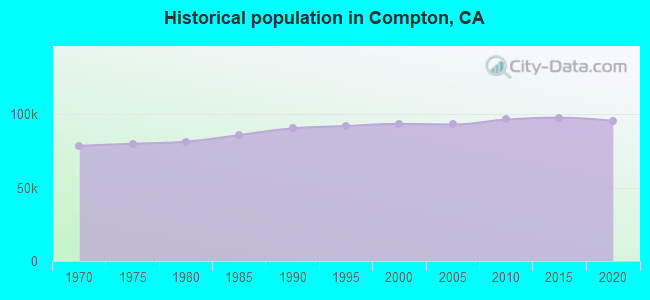
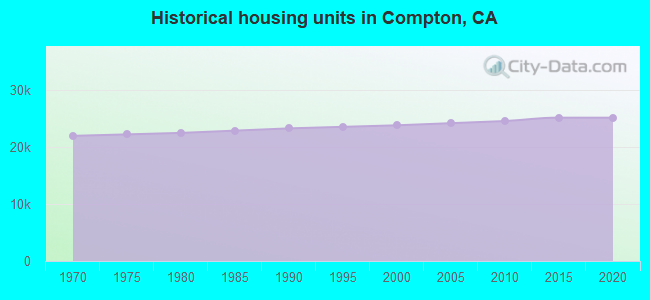

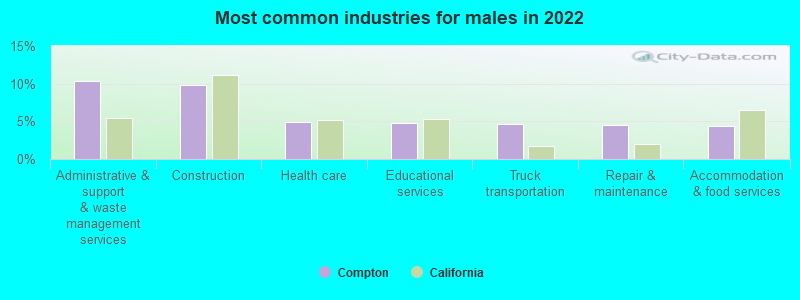
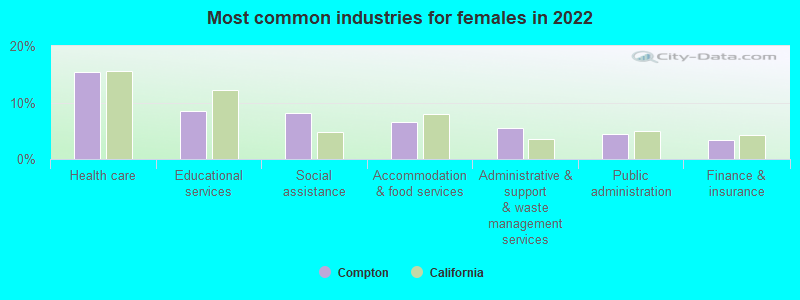
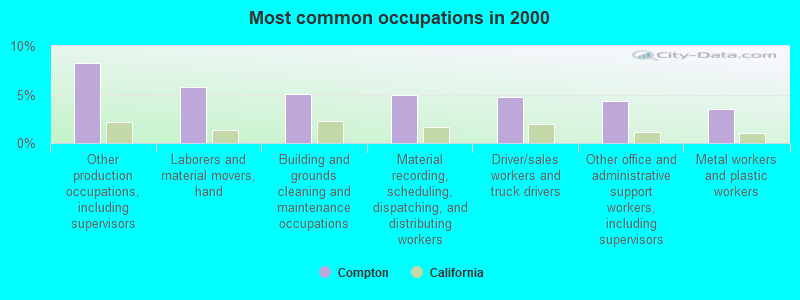
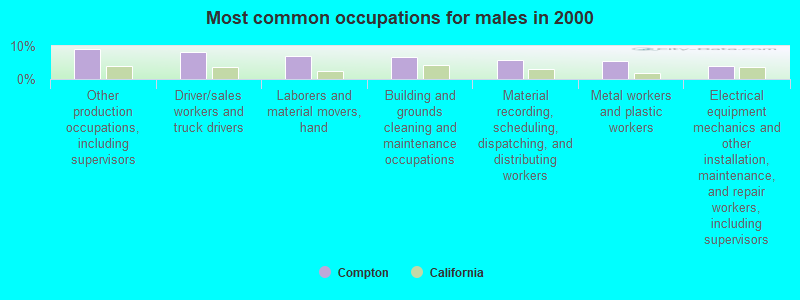
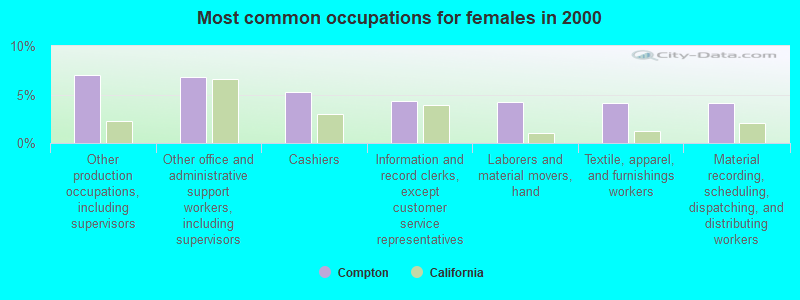
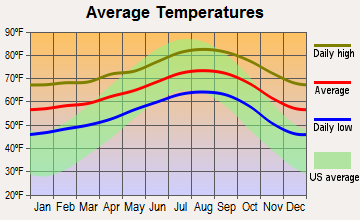
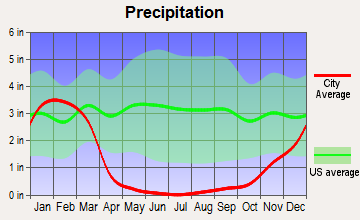
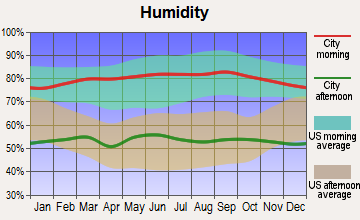
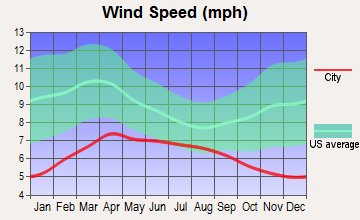
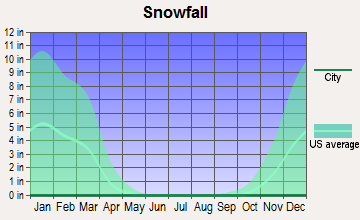
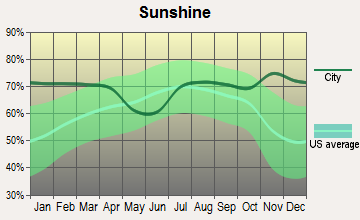
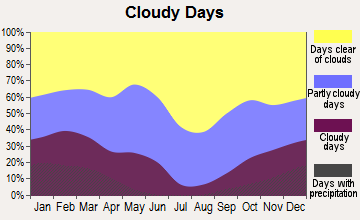
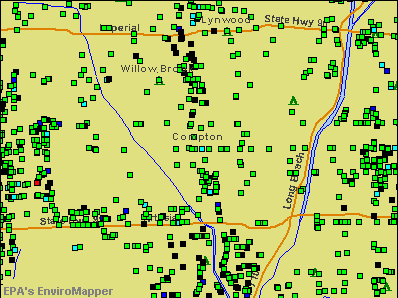

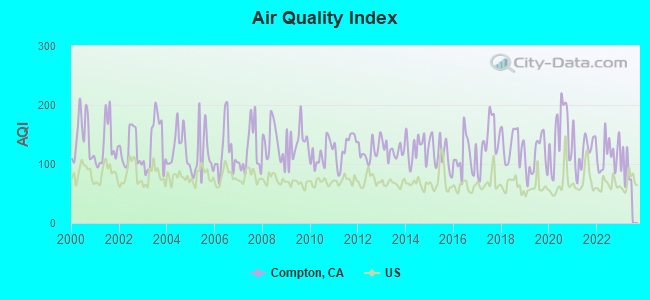
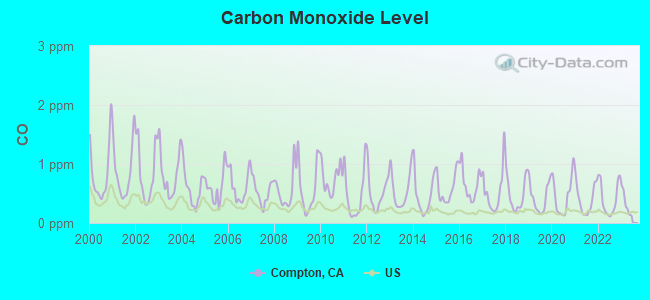
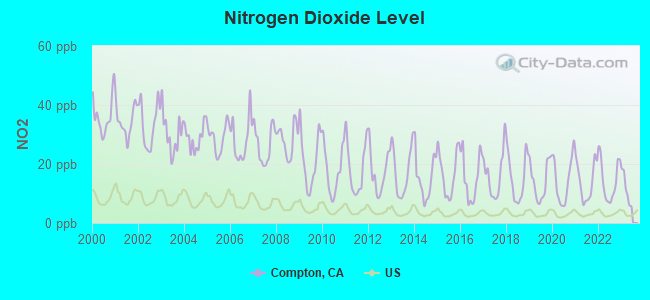
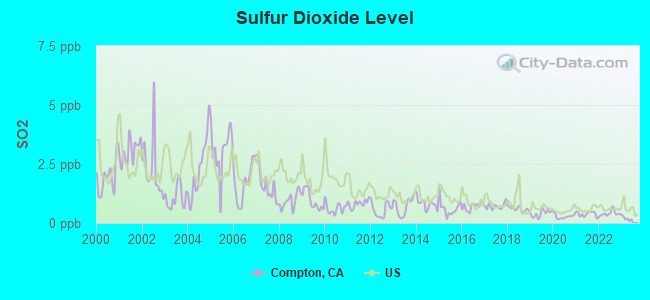
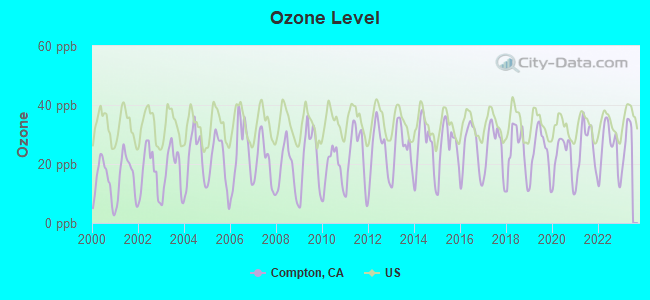
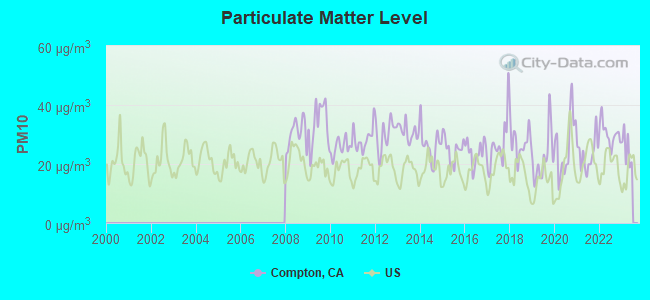
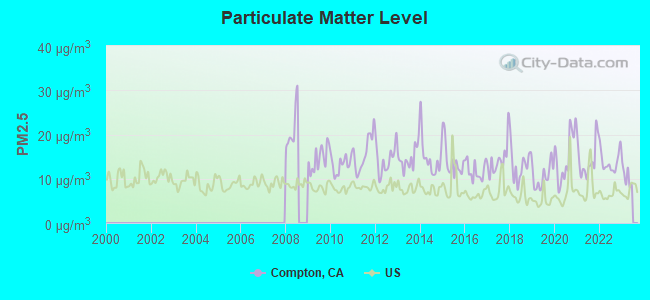
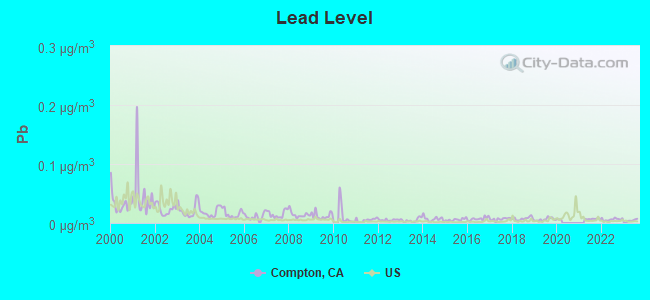

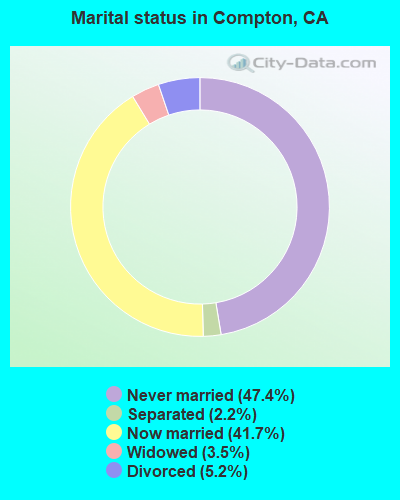
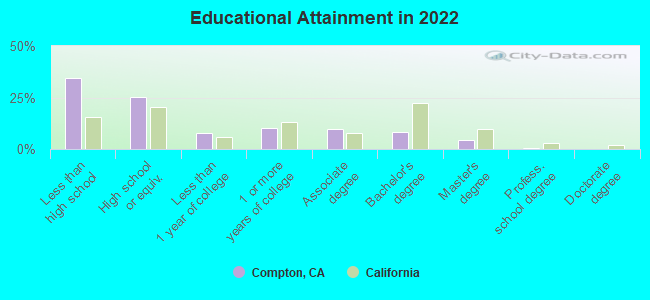
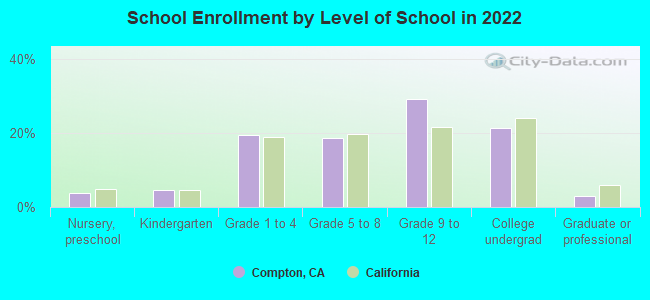
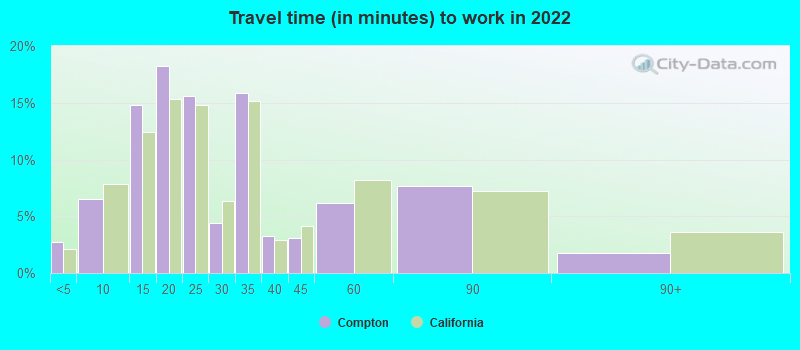
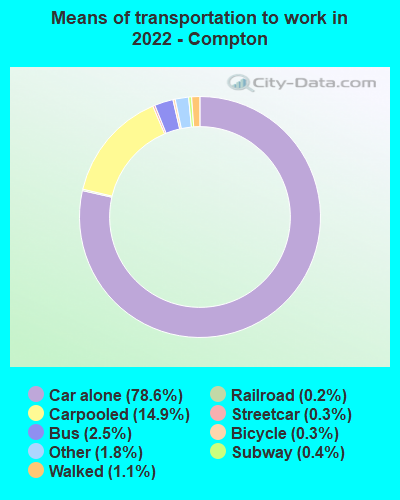


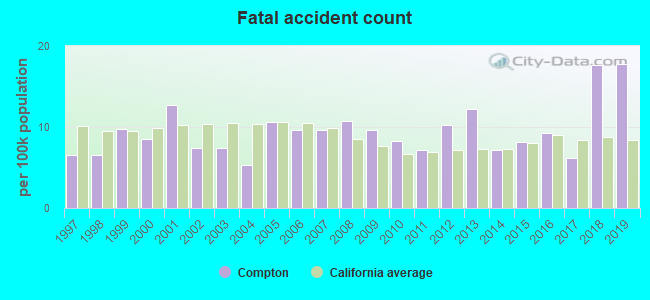
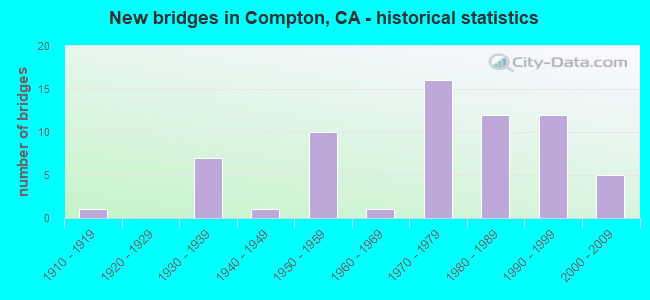
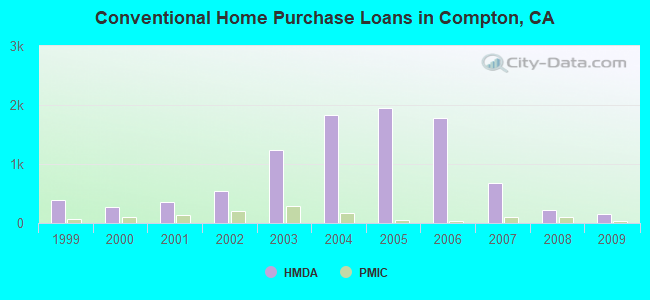
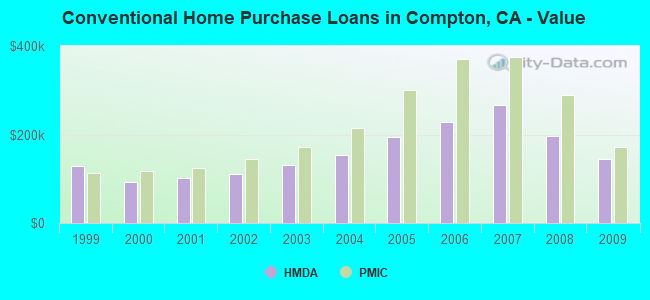
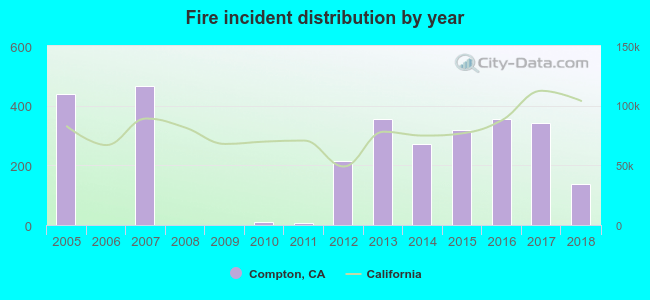 According to the data from the years 2005 - 2018 the average number of fires per year is 208. The highest number of reported fires - 466 took place in 2007, and the least - 0 in 2006. The data has a declining trend.
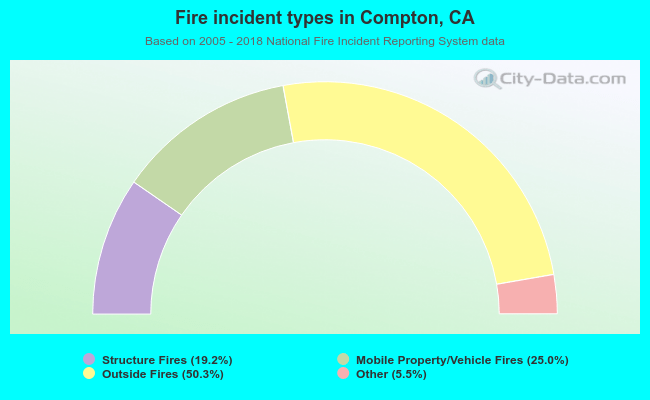 When looking into fire subcategories, the most reports belonged to: Outside Fires (50.3%), and Mobile Property/Vehicle Fires (25.0%).