Compton: Fire Incidents, California (CA)
Where are fire incidents reported in Compton, CA
Something went wrong! Please refresh the page.
| Fire incidents reported | |
|---|---|
| Sreet name | Count |
| COMPTON BLVD | 296 |
| ALONDRA BLVD | 248 |
| ALAMEDA ST | 216 |
| LONG BEACH BLVD | 142 |
| ROSECRANS AV | 136 |
| ROSECRANS | 116 |
| SANTA FE | 106 |
| SANTA FE AV | 104 |
| ACACIA AV | 100 |
| EL SEGUNDO BLVD | 92 |
| GREENLEAF BLVD | 92 |
| ARTESIA BLVD | 86 |
| CENTRAL AV | 84 |
| LAUREL ST | 82 |
| BULLIS RD | 76 |
| WILMINGTON AV | 76 |
| ATLANTIC | 72 |
| WILLOWBROOK AV | 68 |
| PALMER ST | 66 |
| RAYMOND ST | 66 |
| OAKS ST | 62 |
| KAY ST | 58 |
| ATLANTIC AV | 56 |
| CALDWELL ST | 54 |
| PINE ST | 54 |
| 91 ARTESIA | 50 |
| ACACIA | 48 |
| TAMARIND AV | 44 |
| BRADFIELD | 42 |
| POPLAR ST | 42 |
| Other | 83 |
2005 - 2018 National Fire Incident Reporting System (NFIRS) incidents
- Incident types reported to NFIRS in Compton, CA
- 22,91966.3%Rescue & EMS
- 5,33015.4%Good Intent Call
- 2,9178.4%Fire
- 1,3493.9%False Alarm
- 1,1793.4%Service Call
- 7922.3%Hazardous Condition
- 350.1%Overpressure Rupture
- Fire incident types reported to NFIRS in Compton, CA
- 1,46850.3%Outside Fires
- 72925.0%Mobile Property/Vehicle Fires
- 56119.2%Structure Fires
- 1595.5%Other
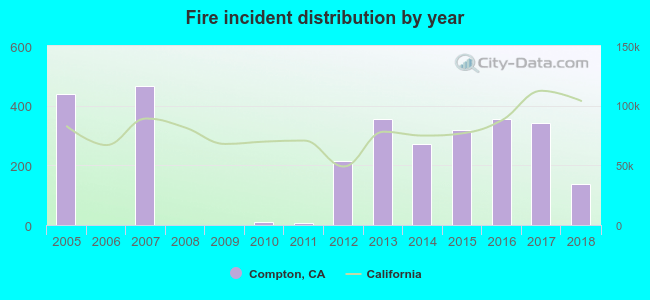 Based on the data from the years 2005 - 2018 the average number of fire incidents per year is 208. The highest number of reported fires - 466 took place in 2007, and the least - 0 in 2006. The data has a declining trend.
The average number of yearly fire incidents per 10k residents in Compton, CA compared to nearest cities:
(Note: Based on data for the last 3 years, including only cities with population 5,000 and above)
| Compton: | 28.2 |
| Lynwood: | 19.4 |
| Paramount: | 19.3 |
| South Gate: | 15.8 |
| Carson: | 21.2 |
| Gardena: | 27.7 |
| Walnut Park: | 11.5 |
| Cudahy: | 13.6 |
| Bellflower: | 19.1 |
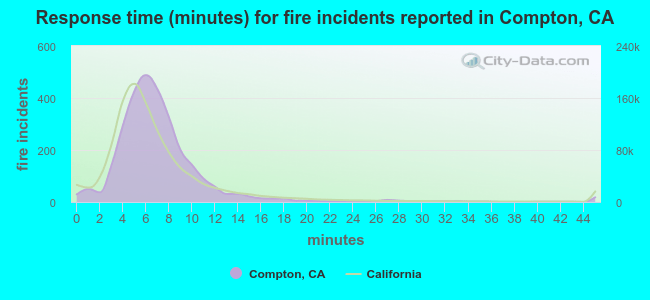 The median response time based on all reported fire incidents is 6 minutes. This is similar to the California median value.
The median response time in Compton, CA compared to nearest cities:
(Note: Based on data for all years, including only cities with at least 500 fire incidents)
| Compton: | 6 minutes |
| Lynwood: | 4 minutes |
| Paramount: | 5 minutes |
| South Gate: | 5 minutes |
| Carson: | 4 minutes |
| Gardena: | 5 minutes |
| Bellflower: | 4 minutes |
| Huntington Park: | 4 minutes |
| Downey: | 7 minutes |
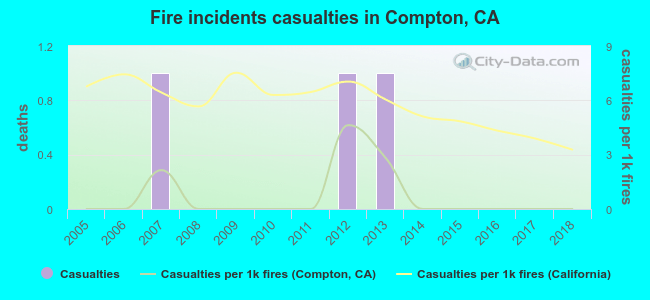 According to the data from the years 2005 - 2018 the average number of fire-related yearly casualties is 0. The highest number of reported injuries - 1 took place in 2007, and the lowest - 0 in 2005. The data has a constant trend.
The average number of casualties per 1,000 fires is 1. This indicator was the highest - 5 in 2012, and the lowest 0 in 2005. The trend for injuries per 1,000 fire incidents is constant. Compared to the California value the number of injuries per 1,000 fire incidents is much lower.
According to the data from the years 2005 - 2018 the average number of fire-related yearly casualties is 0. The highest number of reported injuries - 1 took place in 2007, and the lowest - 0 in 2005. The data has a constant trend.
The average number of casualties per 1,000 fires is 1. This indicator was the highest - 5 in 2012, and the lowest 0 in 2005. The trend for injuries per 1,000 fire incidents is constant. Compared to the California value the number of injuries per 1,000 fire incidents is much lower.Casualties per 1,000 incidents in Compton, CA compared to nearest cities:
(Note: Based on data for all years, including only cities with at least 500 fire incidents)
| Compton: | 1.0 |
| Lynwood: | 0.0 |
| Paramount: | 0.0 |
| South Gate: | 0.0 |
| Carson: | 1.5 |
| Gardena: | 1.4 |
| Bellflower: | 0.0 |
| Huntington Park: | 0.0 |
| Downey: | 7.7 |
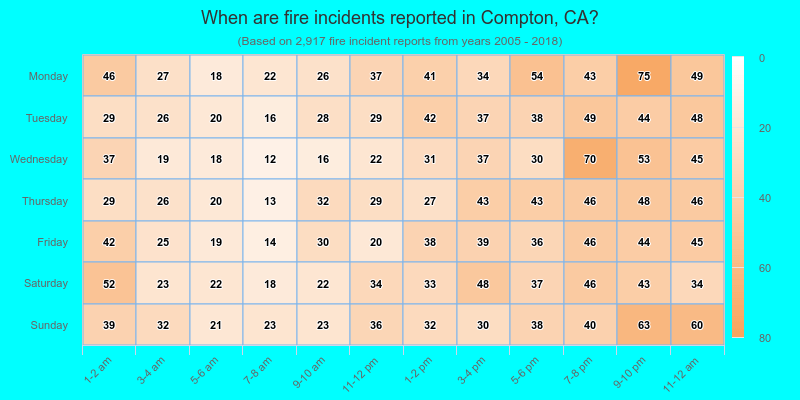
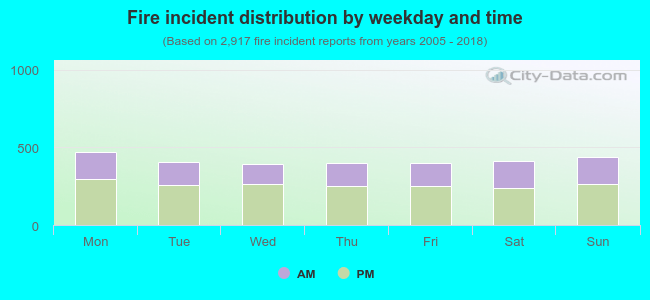 37.4% incidents where reported in the morning and 62.6% in the evening. The most fires (16.2%) took place on Monday, and the least (13.4%) on Wednesday.
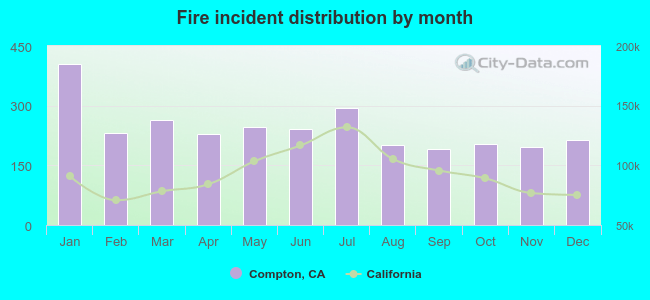 According to the 2,917 reports from years 2005 - 2018 most fires (13.9%) took place during January, and the least (6.6%) in September.
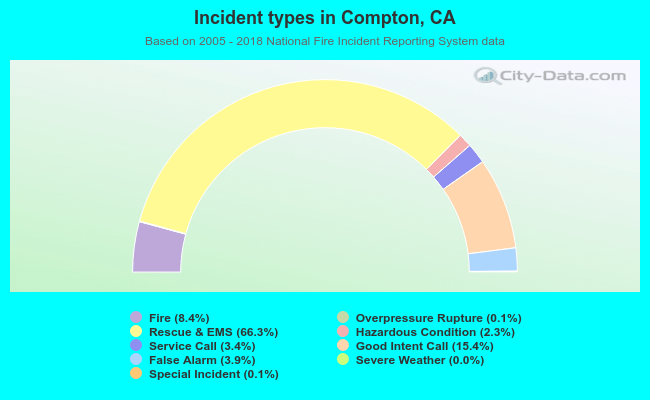 Out of all 34,556 cases reported during the years 2005 - 2018, the most belonged to the categories: Rescue & EMS (66.3%), Good Intent Call (15.4%), and Fire (8.4%).
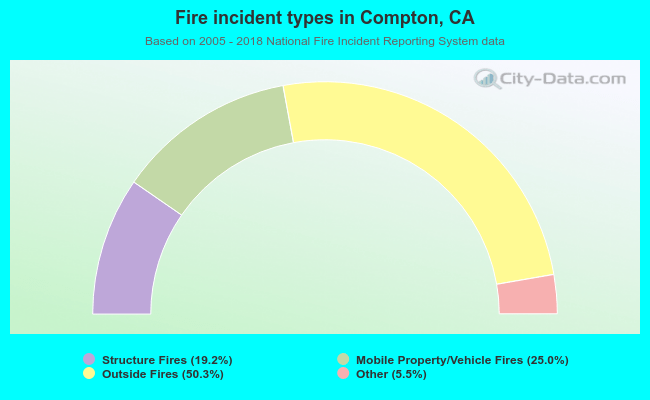 When looking into fire subcategories, the most reports belonged to: Outside Fires (50.3%), and Mobile Property/Vehicle Fires (25.0%).