Lynwood, California
Submit your own pictures of this city and show them to the world
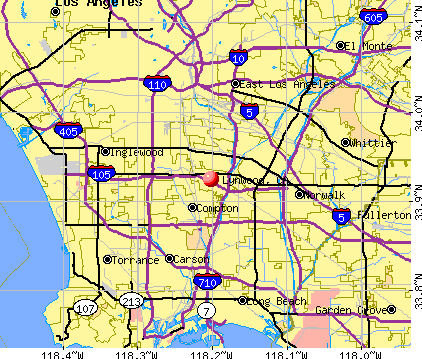
- OSM Map
- General Map
- Google Map
- MSN Map
Population change since 2000: -8.2%
 |
| Males: 31,953 | |
| Females: 32,133 |
| Median resident age: | 32.8 years |
| California median age: | 37.9 years |
Zip codes: 90280.
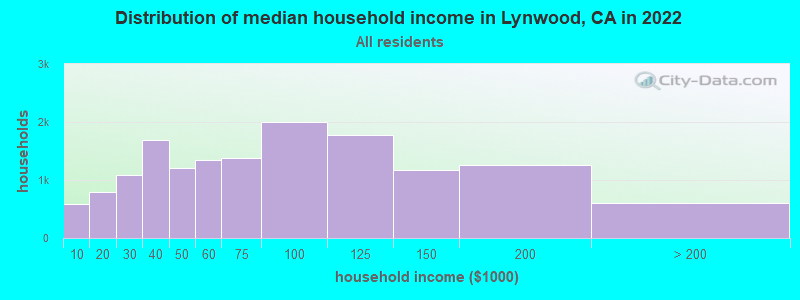
| Lynwood: | $64,481 |
| CA: | $91,551 |
Estimated per capita income in 2022: $20,064 (it was $9,542 in 2000)
Lynwood city income, earnings, and wages data
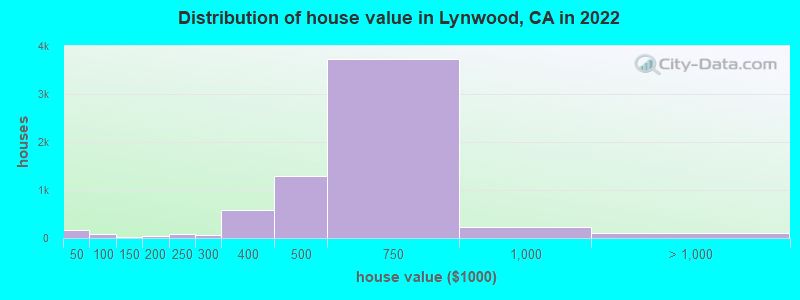
Estimated median house or condo value in 2022: $568,900 (it was $147,300 in 2000)
| Lynwood: | $568,900 |
| CA: | $715,900 |
Mean prices in 2022: all housing units: $628,872; detached houses: $612,533; townhouses or other attached units: $710,790; in 3-to-4-unit structures: over $1,000,000; in 5-or-more-unit structures: $627,075; mobile homes: over $1,000,000
Median gross rent in 2022: $1,578.
(42.7% for White Non-Hispanic residents, 10.7% for Black residents, 19.8% for Hispanic or Latino residents, 39.6% for American Indian residents, 82.0% for Native Hawaiian and other Pacific Islander residents, 17.2% for other race residents, 15.4% for two or more races residents)
Detailed information about poverty and poor residents in Lynwood, CA


Compare current foreclosures in Lynwood, CA:
| Photo | Address | Area | Beds / Baths | Price | Details |
|---|---|---|---|---|---|

|
#1
Palm Ave
Lynwood, CA 90262
|
1,454 sq. feet
|
2 baths 2 beds |
show details | |

|
#2
Santa Fe Ave
Lynwood, CA 90262
|
1,124 sq. feet
|
2 baths 3 beds |
show details | |

|
#3
Cedar Ave
Lynwood, CA 90262
|
1,092 sq. feet
|
2 baths 3 beds |
show details | |

|
#4
Virginia St
Lynwood, CA 90262
|
1,548 sq. feet
|
2 baths 3 beds |
show details | |

|
#5
Josephine St
Lynwood, CA 90262
|
1,414 sq. feet
|
1 baths 3 beds |
show details | |

|
#6
Palm Ave
Lynwood, CA 90262
|
1,454 sq. feet
|
1 baths 2 beds |
show details | |

|
#7
Harris Ave
Lynwood, CA 90262
|
1,579 sq. feet
|
6 baths 8 beds |
show details | |

|
#8
California Ave
Lynwood, CA 90262
|
1,322 sq. feet
|
1 baths 2 beds |
show details | |

|
#9
Arlington Ave
Lynwood, CA 90262
|
1,563 sq. feet
|
2 baths 2 beds |
show details | |

|
#10
Duncan Ave
Lynwood, CA 90262
|
2,342 sq. feet
|
3 baths 4 beds |
show details |
| Photo | Address | Area | Beds / Baths | Price | Details |
|---|---|---|---|---|---|

|
#11
Palm Ave
Lynwood, CA 90262
|
1,030 sq. feet
|
1 baths 3 beds |
show details | |

|
#12
Mulford Ave
Lynwood, CA 90262
|
888 sq. feet
|
3 baths 5 beds |
show details | |

|
#13
Belinda Ct
Lynwood, CA 90262
|
1,737 sq. feet
|
3 baths 4 beds |
show details | |

|
#14
Walnut Ave
Lynwood, CA 90262
|
1,023 sq. feet
|
1 baths 3 beds |
show details | |

|
#15
California Ave # B
Lynwood, CA 90262
|
1,836 sq. feet
|
3 baths 7 beds |
show details | |

|
#16
Le Sage St
Lynwood, CA 90262
|
1,022 sq. feet
|
1 baths 3 beds |
show details | |

|
#17
Josephine St
Lynwood, CA 90262
|
860 sq. feet
|
2 baths 4 beds |
show details | |

|
#18
Platt Ave
Lynwood, CA 90262
|
1,311 sq. feet
|
2 baths 3 beds |
show details | |

|
#19
Lynwood Rd
Lynwood, CA 90262
|
1,741 sq. feet
|
3 baths 5 beds |
show details | |

|
#20
Olanda St
Lynwood, CA 90262
|
1,414 sq. feet
|
2 baths 3 beds |
show details |
| Photo | Address | Area | Beds / Baths | Price | Details |
|---|---|---|---|---|---|

|
#21
Pine Ave
Lynwood, CA 90262
|
1,175 sq. feet
|
2 baths 3 beds |
show details | |

|
#22
Platt Ave
Lynwood, CA 90262
|
1,806 sq. feet
|
2 baths 4 beds |
show details | |

|
#23
108th St
Lynwood, CA 90262
|
1,749 sq. feet
|
2 baths 3 beds |
show details | |

|
#24
Virginia St
Lynwood, CA 90262
|
1,196 sq. feet
|
1 baths 3 beds |
show details | |

|
#25
Fernwood Ave
Lynwood, CA 90262
|
984 sq. feet
|
1 baths 3 beds |
show details | |

|
#26
Shirley Ave
Lynwood, CA 90262
|
3,576 sq. feet
|
5 baths 5 beds |
show details | |

|
#27
Eve Ave
Lynwood, CA 90262
|
1,032 sq. feet
|
1 baths 2 beds |
show details | |

|
#28
Clark St
Lynwood, CA 90262
|
1,596 sq. feet
|
2 baths 3 beds |
show details | |

|
#29
Long Beach Blvd
Lynwood, CA 90262
|
1,448 sq. feet
|
1 baths 3 beds |
show details | |

|
#30
San Miguel Ave
Lynwood, CA 90262
|
774 sq. feet
|
1 baths 2 beds |
show details |
| Photo | Address | Area | Beds / Baths | Price | Details |
|---|---|---|---|---|---|

|
#31
Peach St
Lynwood, CA 90262
|
1,110 sq. feet
|
1 baths 2 beds |
show details | |

|
#32
Cornish Ave
Lynwood, CA 90262
|
1,086 sq. feet
|
1 baths 2 beds |
show details | |

|
#33
Lynwood Rd
Lynwood, CA 90262
|
1,310 sq. feet
|
1 baths 3 beds |
show details | |

|
#34
Alma Ave
Lynwood, CA 90262
|
1,083 sq. feet
|
2 baths 3 beds |
show details | |

|
#35
Cornish Ave
Lynwood, CA 90262
|
1,361 sq. feet
|
2 baths 3 beds |
show details | |

|
#36
Virginia St
Lynwood, CA 90262
|
1,548 sq. feet
|
2 baths 3 beds |
show details | |

|
#37
Lugo Ave
Lynwood, CA 90262
|
1,307 sq. feet
|
1 baths 2 beds |
show details | |

|
#38
Clark St
Lynwood, CA 90262
|
1,552 sq. feet
|
2 baths 4 beds |
show details | |

|
#39
Pleasant St
Lynwood, CA 90262
|
1,620 sq. feet
|
2 baths 3 beds |
show details | |

|
#40
Duncan Ave
Lynwood, CA 90262
|
2,017 sq. feet
|
3 baths 4 beds |
show details |
| Photo | Address | Area | Beds / Baths | Price | Details |
|---|---|---|---|---|---|

|
#41
Wilson Ave
Lynwood, CA 90262
|
730 sq. feet
|
1 baths 2 beds |
show details | |

|
#42
Walnut Ave
Lynwood, CA 90262
|
1,348 sq. feet
|
2 baths 3 beds |
show details | |

|
#43
Peach St
Lynwood, CA 90262
|
1,210 sq. feet
|
1 baths 2 beds |
show details | |

|
#44
Josephine St
Lynwood, CA 90262
|
1,188 sq. feet
|
1 baths 3 beds |
show details | |

|
#45
Cortland St
Lynwood, CA 90262
|
1,637 sq. feet
|
3 baths 3 beds |
show details | |

|
#46
Sanborn Ave # 8
Lynwood, CA 90262
|
- sq. feet
|
8 baths 10 beds |
show details | |

|
#47
Virginia Avenue
Lynwood, CA 90262
|
- sq. feet
|
- baths - beds |
show details | |

|
#48
Long Beach Blvd Apt A
Lynwood, CA 90262
|
- sq. feet
|
- baths - beds |
show details | |

|
#49
Copeland St Apt C
Lynwood, CA 90262
|
- sq. feet
|
- baths - beds |
show details | |

|
Check over 1 million property listings on Foreclosure.com!
|
browse all offers | |||


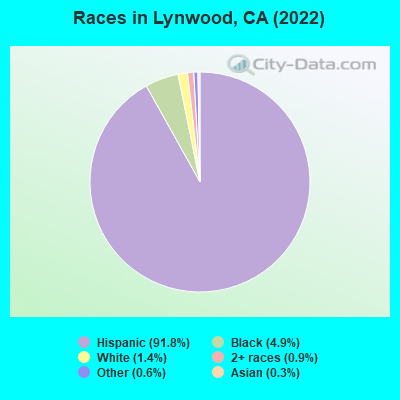
- 58,85791.8%Hispanic
- 3,1424.9%Black alone
- 8751.4%White alone
- 5970.9%Two or more races
- 4040.6%Other race alone
- 2060.3%Asian alone
According to our research of California and other state lists, there were 82 registered sex offenders living in Lynwood, California as of April 27, 2024.
The ratio of all residents to sex offenders in Lynwood is 876 to 1.
The ratio of registered sex offenders to all residents in this city is near the state average.
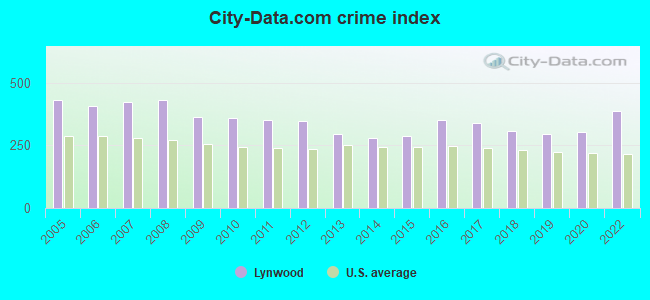
The City-Data.com crime index weighs serious crimes and violent crimes more heavily. Higher means more crime, U.S. average is 246.1. It adjusts for the number of visitors and daily workers commuting into cities.
- means the value is smaller than the state average.- means the value is about the same as the state average.
- means the value is bigger than the state average.
- means the value is much bigger than the state average.
Crime rate in Lynwood detailed stats: murders, rapes, robberies, assaults, burglaries, thefts, arson
Full-time law enforcement employees in 2015, including police officers: 1 (1 officers - 1 male; 0 female).
| Officers per 1,000 residents here: | 0.01 |
| California average: | 1.98 |
 Recent articles from our blog. Our writers, many of them Ph.D. graduates or candidates, create easy-to-read articles on a wide variety of topics.

 | Is South Gate safe? (70 replies) |
| Infiltration into LA sheriff department? (55 replies) |
| History of Compton (90 replies) |
| compton is really not that bad......its really not (93 replies) |
| Is Los Angeles still outrageously expensive for lower and middle class , (77 replies) |
| Buying a house for 300,000 in LA (40 replies) |
Latest news from Lynwood, CA collected exclusively by city-data.com from local newspapers, TV, and radio stations
Current Local Time: PST time zone
Elevation: 86 feet
Land area: 4.85 square miles.
Population density: 13,203 people per square mile (very high).
24,720 residents are foreign born (36.9% Latin America).
| This city: | 38.1% |
| California: | 26.5% |
Median real estate property taxes paid for housing units with mortgages in 2022: $4,454 (0.8%)
Median real estate property taxes paid for housing units with no mortgage in 2022: $3,130 (0.6%)
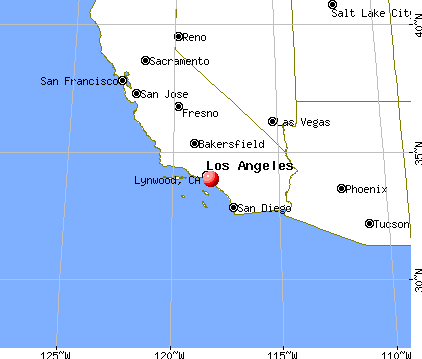
Nearest city with pop. 200,000+: Long Beach, CA  (8.7 miles , pop. 461,522).
Nearest city with pop. 1,000,000+: Los Angeles, CA (15.0 miles , pop. 3,694,820).
Nearest cities:
), ), ), ), )Latitude: 33.92 N, Longitude: 118.20 W
Daytime population change due to commuting: -14,308 (-22.3%)
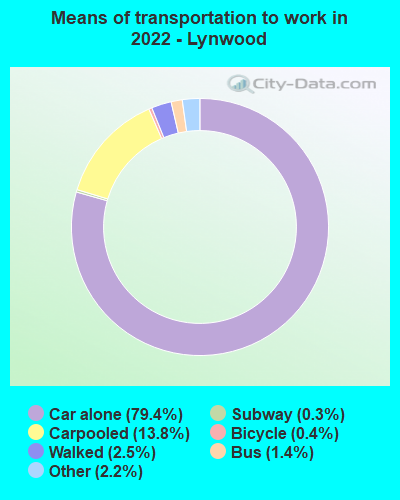
Workers who live and work in this city: 2,411 (8.6%)
Property values in Lynwood, CA

Lynwood, California accommodation & food services, waste management - Economy and Business Data
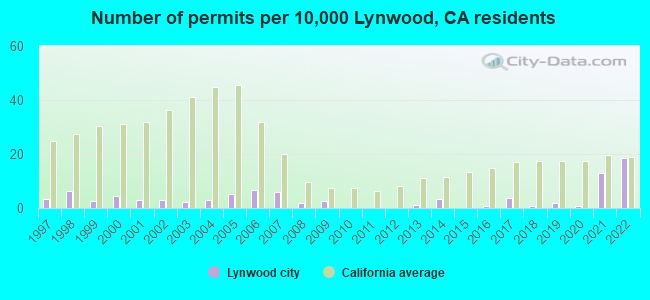
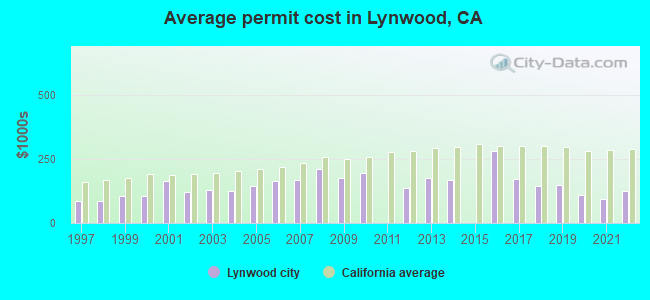
Single-family new house construction building permits:
- 2022: 130 buildings, average cost: $126,400
- 2021: 90 buildings, average cost: $95,400
- 2020: 5 buildings, average cost: $110,600
- 2019: 14 buildings, average cost: $149,000
- 2018: 6 buildings, average cost: $142,800
- 2017: 26 buildings, average cost: $172,700
- 2016: 6 buildings, average cost: $280,000
- 2014: 23 buildings, average cost: $169,100
- 2013: 8 buildings, average cost: $176,500
- 2012: 1 building, cost: $138,000
- 2010: 1 building, cost: $196,000
- 2009: 17 buildings, average cost: $175,000
- 2008: 13 buildings, average cost: $209,500
- 2007: 42 buildings, average cost: $167,900
- 2006: 46 buildings, average cost: $165,200
- 2005: 36 buildings, average cost: $145,000
- 2004: 21 buildings, average cost: $124,400
- 2003: 15 buildings, average cost: $131,200
- 2002: 20 buildings, average cost: $122,800
- 2001: 20 buildings, average cost: $164,300
- 2000: 30 buildings, average cost: $103,600
- 1999: 18 buildings, average cost: $106,300
- 1998: 43 buildings, average cost: $86,200
- 1997: 24 buildings, average cost: $85,900
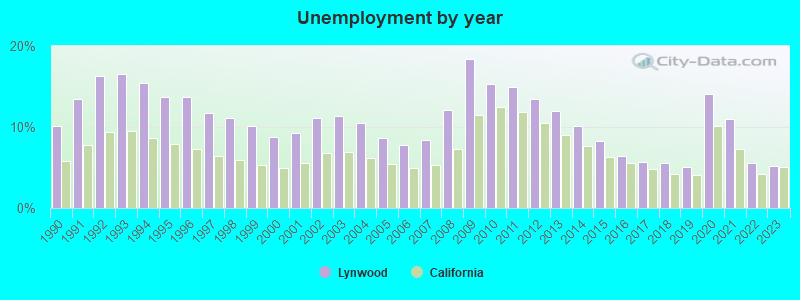
| Here: | 5.2% |
| California: | 5.1% |
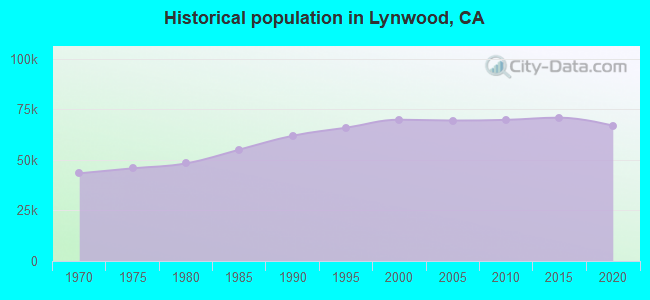
Population change in the 1990s: +7,788 (+12.5%).
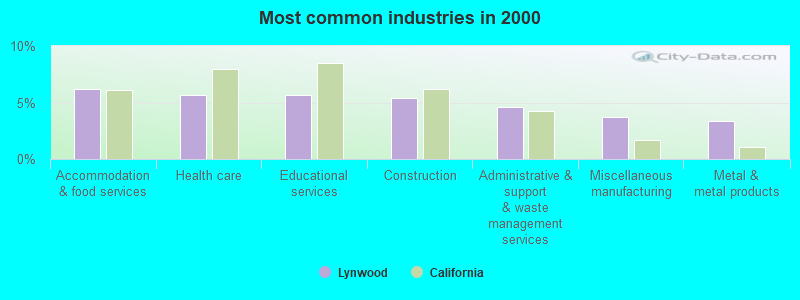
- Accommodation & food services (6.2%)
- Health care (5.7%)
- Educational services (5.7%)
- Construction (5.4%)
- Administrative & support & waste management services (4.6%)
- Miscellaneous manufacturing (3.7%)
- Metal & metal products (3.4%)

- Construction (9.0%)
- Administrative & support & waste management services (6.2%)
- Repair & maintenance (5.3%)
- Accommodation & food services (5.2%)
- Metal & metal products (5.0%)
- Miscellaneous manufacturing (3.9%)
- Transportation equipment (3.8%)
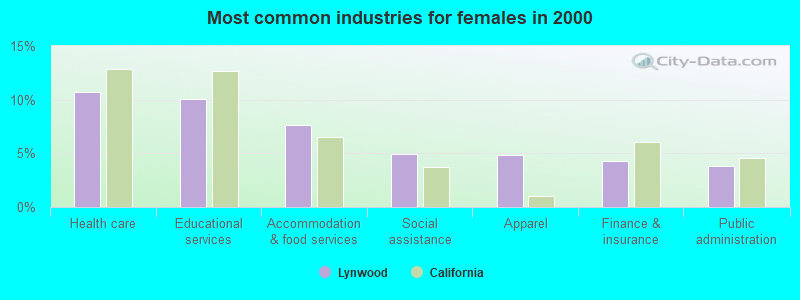
- Health care (10.7%)
- Educational services (10.1%)
- Accommodation & food services (7.6%)
- Social assistance (4.9%)
- Apparel (4.8%)
- Finance & insurance (4.3%)
- Public administration (3.8%)
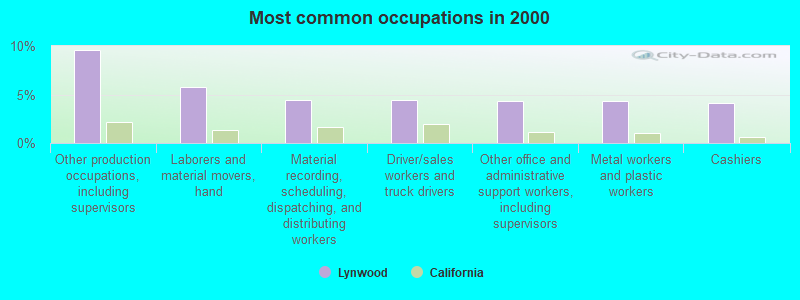
- Other production occupations, including supervisors (9.6%)
- Laborers and material movers, hand (5.8%)
- Material recording, scheduling, dispatching, and distributing workers (4.5%)
- Driver/sales workers and truck drivers (4.4%)
- Other office and administrative support workers, including supervisors (4.3%)
- Metal workers and plastic workers (4.3%)
- Cashiers (4.2%)
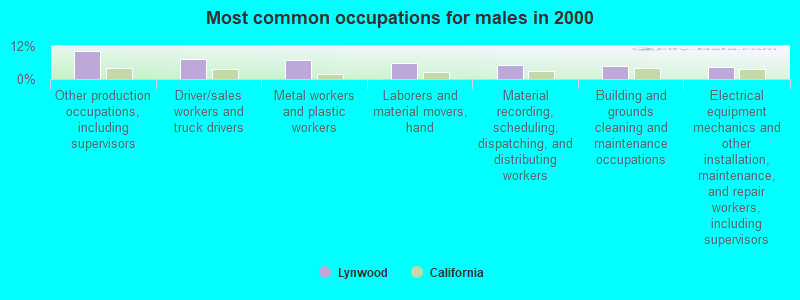
- Other production occupations, including supervisors (10.1%)
- Driver/sales workers and truck drivers (7.2%)
- Metal workers and plastic workers (6.8%)
- Laborers and material movers, hand (5.9%)
- Material recording, scheduling, dispatching, and distributing workers (5.0%)
- Building and grounds cleaning and maintenance occupations (4.8%)
- Electrical equipment mechanics and other installation, maintenance, and repair workers, including supervisors (4.4%)
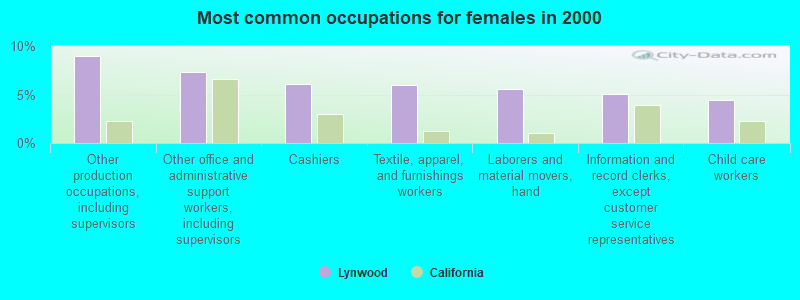
- Other production occupations, including supervisors (9.0%)
- Other office and administrative support workers, including supervisors (7.4%)
- Cashiers (6.0%)
- Textile, apparel, and furnishings workers (6.0%)
- Laborers and material movers, hand (5.6%)
- Information and record clerks, except customer service representatives (5.1%)
- Child care workers (4.5%)
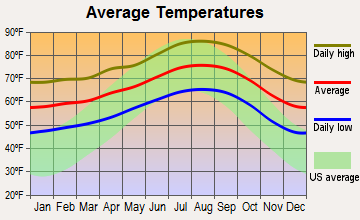
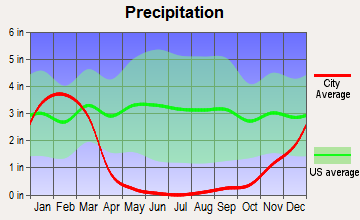
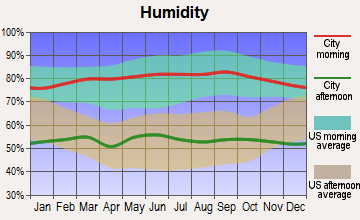
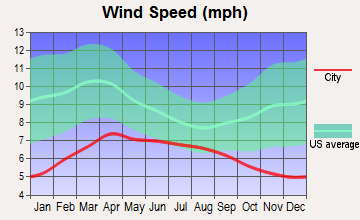
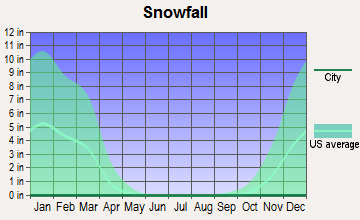
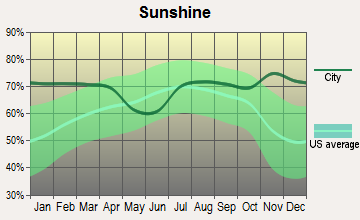
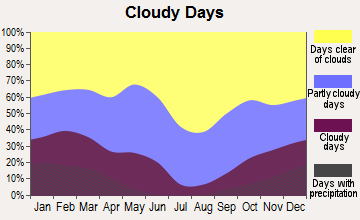
Average climate in Lynwood, California
Based on data reported by over 4,000 weather stations
|
|

(lower is better)
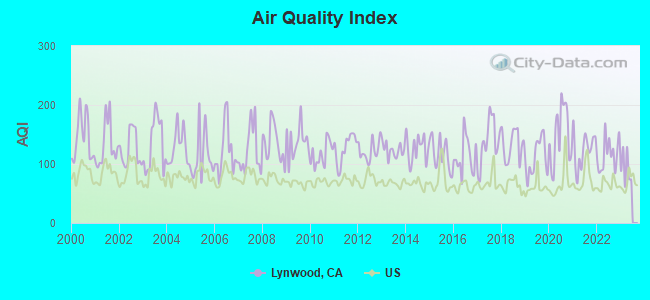
Air Quality Index (AQI) level in 2022 was 116. This is significantly worse than average.
| City: | 116 |
| U.S.: | 73 |
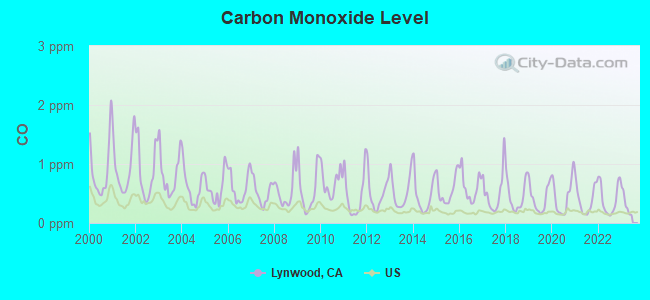
Carbon Monoxide (CO) [ppm] level in 2022 was 0.404. This is significantly worse than average. Closest monitor was 0.6 miles away from the city center.
| City: | 0.404 |
| U.S.: | 0.251 |
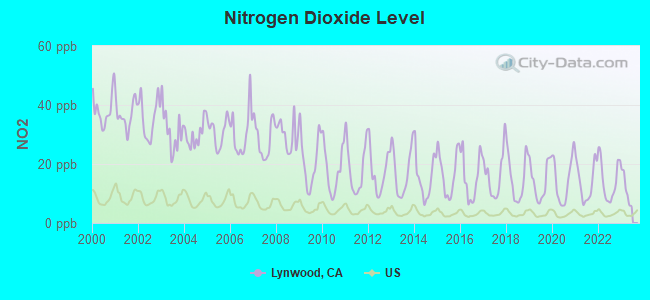
Nitrogen Dioxide (NO2) [ppb] level in 2022 was 14.4. This is significantly worse than average. Closest monitor was 0.6 miles away from the city center.
| City: | 14.4 |
| U.S.: | 5.1 |
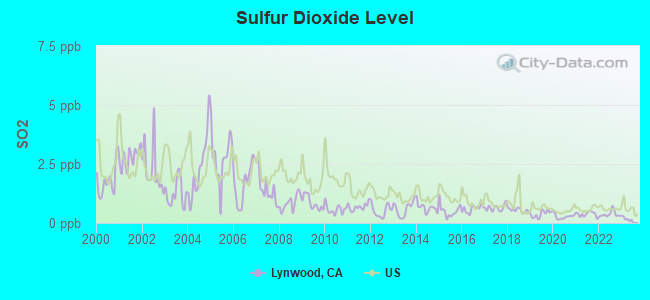
Sulfur Dioxide (SO2) [ppb] level in 2022 was 0.372. This is significantly better than average. Closest monitor was 0.6 miles away from the city center.
| City: | 0.372 |
| U.S.: | 1.515 |

Ozone [ppb] level in 2022 was 25.4. This is better than average. Closest monitor was 0.6 miles away from the city center.
| City: | 25.4 |
| U.S.: | 33.3 |
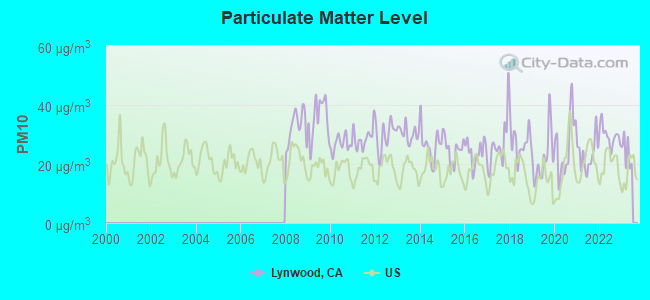
Particulate Matter (PM10) [µg/m3] level in 2022 was 29.6. This is significantly worse than average. Closest monitor was 7.0 miles away from the city center.
| City: | 29.6 |
| U.S.: | 19.2 |
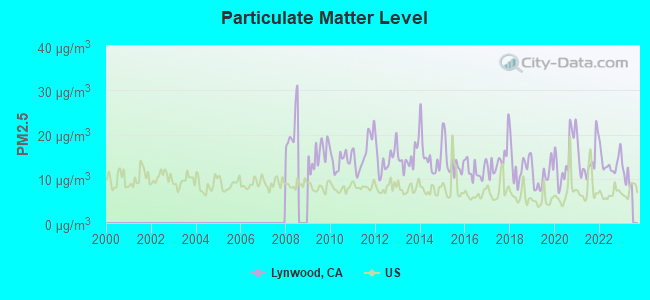
Particulate Matter (PM2.5) [µg/m3] level in 2022 was 13.7. This is significantly worse than average. Closest monitor was 0.6 miles away from the city center.
| City: | 13.7 |
| U.S.: | 8.1 |
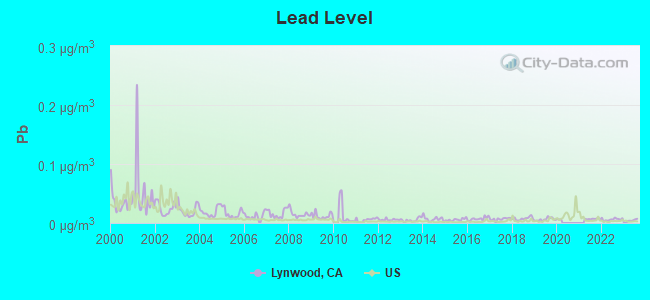
Lead (Pb) [µg/m3] level in 2022 was 0.00605. This is significantly better than average. Closest monitor was 0.6 miles away from the city center.
| City: | 0.00605 |
| U.S.: | 0.00931 |
Earthquake activity:
Lynwood-area historical earthquake activity is significantly above California state average. It is 6893% greater than the overall U.S. average.On 7/21/1952 at 11:52:14, a magnitude 7.7 (7.7 UK, Class: Major, Intensity: VIII - XII) earthquake occurred 87.2 miles away from Lynwood center, causing $50,000,000 total damage
On 6/28/1992 at 11:57:34, a magnitude 7.6 (6.2 MB, 7.6 MS, 7.3 MW, Depth: 0.7 mi) earthquake occurred 97.4 miles away from Lynwood center, causing 3 deaths (1 shaking deaths, 2 other deaths) and 400 injuries, causing $100,000,000 total damage and $40,000,000 insured losses
On 10/16/1999 at 09:46:44, a magnitude 7.4 (6.3 MB, 7.4 MS, 7.2 MW, 7.3 ML) earthquake occurred 109.0 miles away from Lynwood center
On 11/4/1927 at 13:51:53, a magnitude 7.5 (7.5 UK) earthquake occurred 175.3 miles away from the city center
On 1/17/1994 at 12:30:55, a magnitude 6.8 (6.4 MB, 6.8 MS, 6.7 MW, Depth: 11.4 mi, Class: Strong, Intensity: VII - IX) earthquake occurred 26.7 miles away from the city center, causing 60 deaths (60 shaking deaths) and 7000 injuries
On 4/21/1918 at 22:32:30, a magnitude 6.8 (6.8 UK) earthquake occurred 44.4 miles away from Lynwood center
Magnitude types: body-wave magnitude (MB), local magnitude (ML), surface-wave magnitude (MS), moment magnitude (MW)
Natural disasters:
The number of natural disasters in Los Angeles County (57) is a lot greater than the US average (15).Major Disasters (Presidential) Declared: 27
Emergencies Declared: 3
Causes of natural disasters: Fires: 37, Floods: 16, Storms: 9, Winter Storms: 6, Landslides: 5, Mudslides: 5, Earthquakes: 3, Freeze: 1, Heavy Rain: 1, Hurricane: 1, Snow: 1, Tornado: 1, Wind: 1, Other: 1 (Note: some incidents may be assigned to more than one category).
Main business address for: JORGENSEN EARLE M CO /DE/ (WHOLESALE-METALS SERVICE CENTERS & OFFICES).
Hospitals in Lynwood:
- ELM PARK (4300 LOS FLORES)
- SAINT FRANCIS MEDICAL CENTER (Voluntary non-profit - Church, 3630 EAST IMPERIAL HIGHWAY)
- WEST PARK (3323 E IMPERIAL HWY)
- WOODLAWN PARK (3898 WOODLAWN)
Nursing Homes in Lynwood:
- BLOOMFIELD EAST (3615 E. IMPERIAL HIWY)
- COUNTRY VILLA LYNWOOD HEALTHCARE CENTER (3611 EAST IMPERIAL HIGHWAY)
- HALLMARK NURSING CENTER (3565 E IMPERIAL HIGHWAY)
- ROYAL OAKS CARE CENTER (3565 E. IMPERIAL HWY.)
- SAINT FRANCIS MED CTR DP (3630 IMPERIAL HWY.)
Dialysis Facilities in Lynwood:
Heliports located in Lynwood:
Amtrak stations near Lynwood:
- 10 miles: LOS ANGELES (800 N. ALAMEDA ST.) . Services: ticket office, fully wheelchair accessible, enclosed waiting area, public restrooms, public payphones, snack bar, free short-term parking, paid long-term parking, car rental agency, taxi stand, public transit connection.
- 11 miles: LONG BEACH (601 N. LONG BEACH BLVD.) - Bus Station . Services: fully wheelchair accessible, public restrooms, public payphones, full-service food facilities, paid short-term parking, paid long-term parking, call for taxi service, public transit connection.
- 13 miles: SAN PEDRO (CATALINA TERMINAL, BERTH 95) - Bus Station . Services: partially wheelchair accessible, enclosed waiting area, public restrooms, public payphones, snack bar, paid short-term parking, paid long-term parking, call for taxi service.
College/University in Lynwood:
Colleges/universities with over 2000 students nearest to Lynwood:
- El Camino College-Compton Center (about 4 miles; Compton, CA; Full-time enrollment: 4,506)
- ICDC College (about 4 miles; Huntington Park, CA; FT enrollment: 2,621)
- United Education Institute-Huntington Park Campus (about 5 miles; Huntington Park, CA; FT enrollment: 5,151)
- California State University-Dominguez Hills (about 6 miles; Carson, CA; FT enrollment: 9,862)
- Los Angeles Southwest College (about 6 miles; Los Angeles, CA; FT enrollment: 3,247)
- Cerritos College (about 7 miles; Norwalk, CA; FT enrollment: 13,090)
- Marinello Schools of Beauty-Los Angeles (about 8 miles; Los Angeles, CA; FT enrollment: 3,923)
Public high schools in Lynwood:
- LYNWOOD HIGH (Students: 2,002, Location: 4050 E. IMPERIAL HWY., Grades: 9-12)
- MARCO ANTONIO FIREBAUGH HIGH (Students: 1,480, Location: 5246 MLK BLVD., Grades: 9-12)
- VISTA HIGH (CONTINUATION) (Students: 70, Location: 11300 WRIGHT RD., Grades: 9-12)
- PATHWAY INDEPENDENT STUDY (Students: 13, Location: 11300 WRIGHT RD., Grades: 9-12)
- LYNWOOD COMMUNITY DAY (Location: 11387 BULLIS RD., Grades: 7-12)
Biggest public elementary/middle schools in Lynwood:
- LYNWOOD MIDDLE (Students: 1,502, Location: 12124 BULLIS RD., Grades: 7-8)
- HOSLER MIDDLE (Students: 1,052, Location: 11300 SPRUCE ST., Grades: 7-8)
- CESAR CHAVEZ MIDDLE (Students: 926, Location: 3898 ABBOTT RD., Grades: 6-8)
- LINDBERGH ELEMENTARY (Students: 492, Location: 3300 CEDAR AVE., Grades: KG-6)
- WILL ROGERS ELEMENTARY (Students: 479, Location: 11220 DUNCAN AVE., Grades: KG-6)
- WASHINGTON ELEMENTARY (Students: 465, Location: 4225 SANBORN AVE., Grades: KG-6)
- THURGOOD MARSHALL ELEMENTARY (Students: 458, Location: 3593 MLK BLVD., Grades: KG-5)
- JANIE P. ABBOTT ELEMENTARY (Students: 428, Location: 5260 E. CLARK ST., Grades: KG-6)
- ROSA PARKS ELEMENTARY (Students: 420, Location: 3900 AGNES ST., Grades: KG-6)
- MARK TWAIN ELEMENTARY (Students: 380, Location: 12315 THORSON AVE., Grades: KG-6)
Private elementary/middle schools in Lynwood:
User-submitted facts and corrections:
- Agnes Elementary School has changed its name to Rosa Parks Elementary School.
- Tyriene Amey (born Lynwood, Ca. August 22, 1976) College Football Player and graduate United States Military Academy at West Point
Points of interest:
Notable locations in Lynwood: Lynwood Station (A), Lynwood City Hall (B), Lynwood Branch County of Los Angeles Public Library (C), Schaefer Ambulance Service (D), Century Sheriffs Station (E), Los Angeles County Fire Department Station 148 (F), Los Angeles County Fire Department Station 147 (G). Display/hide their locations on the map
Shopping Center: Century Plaza Shopping Center (1). Display/hide its location on the map
Main business address in Lynwood: JORGENSEN EARLE M CO /DE/ (A). Display/hide its location on the map
Churches in Lynwood include: Bethesda Temple (A), Christ Deliverance Baptist Church (B), El Salvador Church (C), Household of God Bibleway Church (D), Pico Gardens Foursquare Church (E), Lynton Missionary Church (F), Consolation Church of God (G), Gospel Light Fellowship Church (H), True Vine Missionary Baptist Church (I). Display/hide their locations on the map
Parks in Lynwood include: Lugo Park (1), Carnation Park (2), Lynwood Park (3), Rose Park (4). Display/hide their locations on the map
Tourist attraction: Arcade Video Games & Vending (Amusement & Theme Parks; 11610 Atlantic Avenue).
Court: Los Angeles County - Other Judicial District Courts (11701 Alameda Street).
Birthplace of: Big Van Vader - Professional wrestler, Harry Leary - Bicycle motocross rider, Loretta Sanchez - Politician, Dave Stevens - Illustrator, Kevin Costner - (born 1955), actor and film director, Rick Adelman - Basketball player-coach, DeWayne Buice - Baseball player, Jim Barr - Baseball player, Ed Fiori - Professional golfer, Carl H. Freeman - Recipient of the Purple Heart medal.
| This city: | 4.6 people |
| California: | 2.9 people |
| This city: | 89.5% |
| Whole state: | 68.7% |
| This city: | 9.4% |
| Whole state: | 7.2% |
Likely homosexual households (counted as self-reported same-sex unmarried-partner households)
- Lesbian couples: 0.4% of all households
- Gay men: 0.3% of all households
People in group quarters in Lynwood in 2010:
- 1,833 people in local jails and other municipal confinement facilities
- 370 people in nursing facilities/skilled-nursing facilities
- 202 people in residential treatment centers for adults
- 82 people in workers' group living quarters and job corps centers
- 74 people in group homes intended for adults
- 71 people in other noninstitutional facilities
- 20 people in emergency and transitional shelters (with sleeping facilities) for people experiencing homelessness
People in group quarters in Lynwood in 2000:
- 1,197 people in local jails and other confinement facilities (including police lockups)
- 391 people in nursing homes
- 275 people in other noninstitutional group quarters
- 158 people in homes for the mentally retarded
- 61 people in other nonhousehold living situations
- 39 people in religious group quarters
- 34 people in mental (psychiatric) hospitals or wards
- 32 people in homes for the mentally ill
- 13 people in other group homes
Banks with branches in Lynwood (2011 data):
- Bank of America, National Association: Lynwood Branch at 3505 East Imperial Highway, branch established on 1946/12/16. Info updated 2009/11/18: Bank assets: $1,451,969.3 mil, Deposits: $1,077,176.8 mil, headquarters in Charlotte, NC, positive income, 5782 total offices, Holding Company: Bank Of America Corporation
- U.S. Bank National Association: Lynwood Branch at 3645 Imperial Highway, branch established on 1969/06/09. Info updated 2012/01/30: Bank assets: $330,470.8 mil, Deposits: $236,091.5 mil, headquarters in Cincinnati, OH, positive income, 3121 total offices, Holding Company: U.S. Bancorp
- Compass Bank: Lynwood Branch at 10909 Atlantic Avenue, branch established on 2005/09/07. Info updated 2011/02/24: Bank assets: $63,107.0 mil, Deposits: $46,232.4 mil, headquarters in Birmingham, AL, negative income in the last year, Commercial Lending Specialization, 720 total offices, Holding Company: Banco Bilbao Vizcaya Argentaria, S.A.
- Banco Popular North America: Lynwood Branch at 3180 E. Imperial Hi-Way, branch established on 1982/08/09. Info updated 2012/01/27: Bank assets: $8,605.3 mil, Deposits: $6,167.7 mil, headquarters in New York, NY, positive income, Commercial Lending Specialization, 97 total offices, Holding Company: Popular, Inc.
- Union Bank, National Association: Lynwood Cash And Save Branch at 3831 Martin Luther King, Jr Boulevard, branch established on 1998/01/19. Info updated 2011/09/01: Bank assets: $88,967.5 mil, Deposits: $65,286.4 mil, headquarters in San Francisco, CA, positive income, Commercial Lending Specialization, 403 total offices, Holding Company: Mitsubishi Ufj Financial Group, Inc.
- Wells Fargo Bank, National Association: Imperial And Long Beach at 3326 Imperial Highway, branch established on 1912/01/01. Info updated 2011/04/05: Bank assets: $1,161,490.0 mil, Deposits: $905,653.0 mil, headquarters in Sioux Falls, SD, positive income, 6395 total offices, Holding Company: Wells Fargo & Company
- JPMorgan Chase Bank, National Association: Lynwood Branch at 3840 Martin Luther King Jr Blvd., branch established on 2005/08/29. Info updated 2011/11/10: Bank assets: $1,811,678.0 mil, Deposits: $1,190,738.0 mil, headquarters in Columbus, OH, positive income, International Specialization, 5577 total offices, Holding Company: Jpmorgan Chase & Co.
For population 15 years and over in Lynwood:
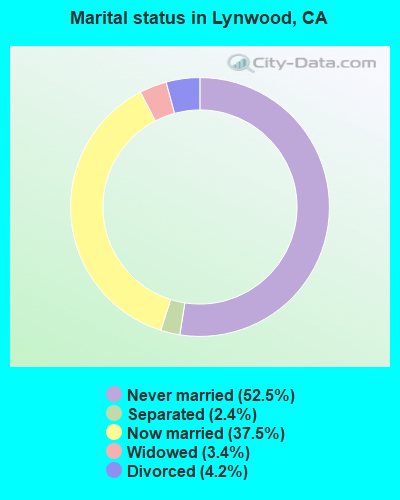
- Never married: 52.5%
- Now married: 37.5%
- Separated: 2.4%
- Widowed: 3.4%
- Divorced: 4.2%
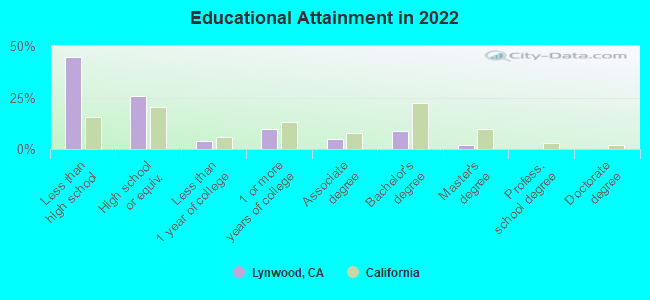
For population 25 years and over in Lynwood:
- High school or higher: 55.5%
- Bachelor's degree or higher: 11.2%
- Graduate or professional degree: 2.3%
- Unemployed: 12.9%
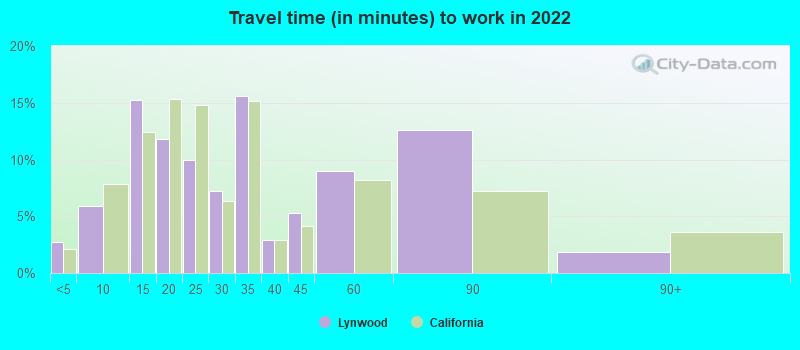
- Mean travel time to work (commute): 30.4 minutes
| Here: | 25.4 |
| California average: | 15.5 |


Graphs represent county-level data. Detailed 2008 Election Results
Neighborhoods in Lynwood:
(Lynwood, California Neighborhood Map)Religion statistics for Lynwood, CA (based on Los Angeles County data)


| Religion | Adherents | Congregations |
|---|---|---|
| Catholic | 3,542,994 | 275 |
| Evangelical Protestant | 814,611 | 3,249 |
| Other | 451,594 | 1,023 |
| Mainline Protestant | 229,056 | 860 |
| Black Protestant | 112,338 | 290 |
| Orthodox | 63,517 | 76 |
| None | 4,604,495 | - |
Food Environment Statistics:
| Los Angeles County: | 2.12 / 10,000 pop. |
| State: | 2.14 / 10,000 pop. |
| Los Angeles County: | 0.03 / 10,000 pop. |
| State: | 0.04 / 10,000 pop. |
| Here: | 0.58 / 10,000 pop. |
| State: | 0.62 / 10,000 pop. |
| Los Angeles County: | 1.23 / 10,000 pop. |
| State: | 1.49 / 10,000 pop. |
| Here: | 7.15 / 10,000 pop. |
| California: | 7.42 / 10,000 pop. |
| Los Angeles County: | 7.5% |
| California: | 7.3% |
| Los Angeles County: | 20.4% |
| California: | 21.3% |
| Los Angeles County: | 18.6% |
| State: | 17.9% |
Health and Nutrition:
| Lynwood: | 44.6% |
| State: | 49.4% |
| Lynwood: | 44.0% |
| California: | 48.0% |
| This city: | 28.4 |
| California: | 28.1 |
| Here: | 24.2% |
| California: | 20.2% |
| Lynwood: | 10.0% |
| California: | 11.2% |
| Lynwood: | 6.7 |
| California: | 6.8 |
| Lynwood: | 27.8% |
| California: | 31.5% |
| This city: | 52.7% |
| California: | 56.4% |
| Here: | 82.3% |
| California: | 80.9% |
More about Health and Nutrition of Lynwood, CA Residents
| Local government employment and payroll (March 2022) | |||||
| Function | Full-time employees | Monthly full-time payroll | Average yearly full-time wage | Part-time employees | Monthly part-time payroll |
|---|---|---|---|---|---|
| Streets and Highways | 39 | $280,549 | $86,323 | 1 | $2,677 |
| Financial Administration | 19 | $139,812 | $88,302 | 0 | $0 |
| Solid Waste Management | 14 | $49,078 | $42,067 | 0 | $0 |
| Parks and Recreation | 12 | $81,062 | $81,062 | 27 | $33,242 |
| Water Supply | 9 | $76,609 | $102,145 | 0 | $0 |
| Other Government Administration | 3 | $14,625 | $58,500 | 1 | $2,925 |
| Housing and Community Development (Local) | 1 | $7,912 | $94,944 | 0 | $0 |
| Totals for Government | 97 | $649,648 | $80,369 | 29 | $38,843 |
Lynwood government finances - Expenditure in 2021 (per resident):
- Construction - Regular Highways: $11,397,000 ($177.84)
Health - Other: $1,478,000 ($23.06)
Housing and Community Development: $1,055,000 ($16.46)
Parks and Recreation: $338,000 ($5.27)
- Current Operations - Water Utilities: $21,565,000 ($336.50)
Police Protection: $13,527,000 ($211.08)
Regular Highways: $8,044,000 ($125.52)
Local Fire Protection: $7,297,000 ($113.86)
Central Staff Services: $4,544,000 ($70.90)
Parks and Recreation: $4,434,000 ($69.19)
Housing and Community Development: $2,328,000 ($36.33)
Protective Inspection and Regulation - Other: $1,511,000 ($23.58)
Health - Other: $1,499,000 ($23.39)
General - Other: $145,000 ($2.26)
- General - Interest on Debt: $6,117,000 ($95.45)
- Water Utilities - Interest on Debt: $3,555,000 ($55.47)
Lynwood government finances - Revenue in 2021 (per resident):
- Charges - Other: $6,814,000 ($106.33)
Housing and Community Development: $3,818,000 ($59.58)
Regular Highways: $191,000 ($2.98)
Parks and Recreation: $69,000 ($1.08)
- Federal Intergovernmental - Housing and Community Development: $2,685,000 ($41.90)
Other: $1,018,000 ($15.88)
- Miscellaneous - Fines and Forfeits: $2,338,000 ($36.48)
General Revenue - Other: $2,084,000 ($32.52)
Interest Earnings: $604,000 ($9.42)
Special Assessments: $562,000 ($8.77)
Rents: $228,000 ($3.56)
- Revenue - Water Utilities: $29,957,000 ($467.45)
- State Intergovernmental - Other: $6,291,000 ($98.16)
Highways: $2,867,000 ($44.74)
General Local Government Support: $47,000 ($0.73)
- Tax - General Sales and Gross Receipts: $18,008,000 ($281.00)
Property: $15,546,000 ($242.58)
Public Utilities Sales: $7,659,000 ($119.51)
Other License: $621,000 ($9.69)
Occupation and Business License - Other: $492,000 ($7.68)
Documentary and Stock Transfer: $280,000 ($4.37)
Lynwood government finances - Debt in 2021 (per resident):
- Long Term Debt - Outstanding Unspecified Public Purpose: $222,039,000 ($3464.70)
Beginning Outstanding - Unspecified Public Purpose: $204,466,000 ($3190.49)
Issue, Unspecified Public Purpose: $27,000,000 ($421.31)
Retired Unspecified Public Purpose: $9,427,000 ($147.10)
Lynwood government finances - Cash and Securities in 2021 (per resident):
- Bond Funds - Cash and Securities: $40,514,000 ($632.18)
- Other Funds - Cash and Securities: $94,405,000 ($1473.10)
- Sinking Funds - Cash and Securities: $30,064,000 ($469.12)
2.98% of this county's 2021 resident taxpayers lived in other counties in 2020 ($81,235 average adjusted gross income)
| Here: | 2.98% |
| California average: | 5.19% |
0.01% of residents moved from foreign countries ($155 average AGI)
Los Angeles County: 0.01% California average: 0.03%
Top counties from which taxpayers relocated into this county between 2020 and 2021:
| from Orange County, CA | |
| from San Bernardino County, CA | |
| from Riverside County, CA |
4.68% of this county's 2020 resident taxpayers moved to other counties in 2021 ($97,324 average adjusted gross income)
| Here: | 4.68% |
| California average: | 6.14% |
0.01% of residents moved to foreign countries ($196 average AGI)
Los Angeles County: 0.01% California average: 0.02%
Top counties to which taxpayers relocated from this county between 2020 and 2021:
| to Orange County, CA | |
| to San Bernardino County, CA | |
| to Riverside County, CA |
| Businesses in Lynwood, CA | ||||
| Name | Count | Name | Count | |
|---|---|---|---|---|
| 7-Eleven | 2 | Kroger | 1 | |
| 99 Cents Only Stores | 1 | Little Caesars Pizza | 1 | |
| AutoZone | 3 | McDonald's | 2 | |
| Baskin-Robbins | 1 | Nike | 2 | |
| CVS | 1 | Panda Express | 1 | |
| Carl\s Jr. | 1 | Payless | 1 | |
| Chuck E. Cheese's | 1 | Pizza Hut | 1 | |
| Church's Chicken | 1 | Quiznos | 1 | |
| Circle K | 1 | RadioShack | 2 | |
| Dennys | 1 | Rite Aid | 1 | |
| Domino's Pizza | 1 | Skechers USA | 1 | |
| El Pollo Loco | 1 | Starbucks | 1 | |
| FedEx | 1 | Subway | 3 | |
| GNC | 1 | T-Mobile | 3 | |
| GameStop | 2 | Taco Bell | 2 | |
| H&R Block | 2 | Travelodge | 1 | |
| HomeTown Buffet | 1 | U-Haul | 1 | |
| Jack In The Box | 2 | UPS | 1 | |
| Jones New York | 1 | Verizon Wireless | 2 | |
| KFC | 1 | Walgreens | 1 | |
Strongest AM radio stations in Lynwood:
- KFI (640 AM; 50 kW; LOS ANGELES, CA; Owner: CAPSTAR TX LIMITED PARTNERSHIP)
- KLTX (1390 AM; 5 kW; LONG BEACH, CA; Owner: HI-FAVOR BROADCASTING, LLC)
- KNX (1070 AM; 50 kW; LOS ANGELES, CA; Owner: INFINITY BROADCASTING OPERATIONS, INC.)
- KFWB (980 AM; 50 kW; LOS ANGELES, CA; Owner: INFINITY BROADCASTING OPERATIONS, INC.)
- KMPC (1540 AM; 50 kW; LOS ANGELES, CA; Owner: ROSE CITY RADIO CORPORATION)
- KLAC (570 AM; 50 kW; LOS ANGELES, CA; Owner: AMFM RADIO LICENSES, L.L.C.)
- KBLA (1580 AM; 50 kW; SANTA MONICA, CA)
- KTNQ (1020 AM; 50 kW; LOS ANGELES, CA; Owner: KTNQ-AM LICENSE CORP.)
- KXTA (1150 AM; 50 kW; LOS ANGELES, CA; Owner: CITICASTERS LICENSES, L.P.)
- KXMX (1190 AM; 25 kW; ANAHEIM, CA; Owner: NEW INSPIRATION BROADCASTING COMPANY)
- KSPN (710 AM; 50 kW; LOS ANGELES, CA; Owner: KABC-AM RADIO, INC.)
- KDIS (1110 AM; 50 kW; PASADENA, CA; Owner: ABC,INC.)
- KRLA (870 AM; 20 kW; GLENDALE, CA; Owner: NEW INSPIRATION BROADCASTING COMPANY)
Strongest FM radio stations in Lynwood:
- KZLA-FM (93.9 FM; LOS ANGELES, CA; Owner: EMMIS RADIO LICENSE CORPORATION)
- KPWR (105.9 FM; LOS ANGELES, CA; Owner: EMMIS RADIO LICENSE CORPORATION)
- KLSX (97.1 FM; LOS ANGELES, CA; Owner: INFINITY BROADCASTING OPERATIONS, INC.)
- KUSC (91.5 FM; LOS ANGELES, CA; Owner: UNIVERSITY OF SOUTHERN CALIFORNIA)
- KKLA-FM (99.5 FM; LOS ANGELES, CA; Owner: NEW INSPIRATION BROADCASTING CO., INC.)
- KKBT (100.3 FM; LOS ANGELES, CA; Owner: RADIO ONE LICENSES, LLC)
- KRTH-FM (101.1 FM; LOS ANGELES, CA; Owner: INFINITY BROADCASTING OPERATIONS, INC.)
- KBUE (105.5 FM; LONG BEACH, CA; Owner: LBI RADIO LICENSE CORP.)
- KCBS-FM (93.1 FM; LOS ANGELES, CA; Owner: INFINITY BROADCASTING OPERATIONS, INC.)
- KSCA (101.9 FM; GLENDALE, CA; Owner: HBC LICENSE CORPORATION)
- KLOS (95.5 FM; LOS ANGELES, CA; Owner: KLOS-FM RADIO, INC.)
- K212FA (90.3 FM; TEMPLE CITY, CA; Owner: EDUCATIONAL MEDIA FOUNDATION)
- KOST (103.5 FM; LOS ANGELES, CA; Owner: CAPSTAR TX LIMITED PARTNERSHIP)
- KIIS-FM (102.7 FM; LOS ANGELES, CA; Owner: CITICASTERS LICENSES, L.P.)
- KLVE (107.5 FM; LOS ANGELES, CA; Owner: KLVE-FM LICENSE CORP.)
- KPCC (89.3 FM; PASADENA, CA; Owner: PASADENA AREA COMMUNITY COLLEGE DISTRICT)
- KHHT (92.3 FM; LOS ANGELES, CA; Owner: AMFM RADIO LICENSES, L.L.C.)
- KBIG-FM (104.3 FM; LOS ANGELES, CA; Owner: AMFM RADIO LICENSES, L.L.C.)
- KMZT-FM (105.1 FM; LOS ANGELES, CA; Owner: MOUNT WILSON FM BROADCASTERS, INC.)
- KPFK (90.7 FM; LOS ANGELES, CA; Owner: PACIFICA FOUNDATION, INC)
TV broadcast stations around Lynwood:
- KTRO-LP (Channel 50; LANCASTER, CA; Owner: ROBERT D. ADELMAN)
- KCBS-TV (Channel 2; LOS ANGELES, CA; Owner: CBS BROADCASTING INC.)
- KTLA-TV (Channel 5; LOS ANGELES, CA; Owner: KTLA INC.)
- KABC-TV (Channel 7; LOS ANGELES, CA; Owner: ABC HOLDING COMPANY, INC.)
- KCAL-TV (Channel 9; LOS ANGELES, CA; Owner: VIACOM TELEVISION STATIONS GROUP OF LOS ANGELES LLC)
- KNBC (Channel 4; LOS ANGELES, CA; Owner: NBC SUBSIDIARY (KNBC-TV), INC.)
- KMEX-TV (Channel 34; LOS ANGELES, CA; Owner: KMEX LICENSE PARTNERSHIP, G.P.)
- KAZA-TV (Channel 54; AVALON, CA; Owner: PAPPAS SOUTHERN CALIFORNIA LICENSE LLC)
- KDOC-TV (Channel 56; ANAHEIM, CA; Owner: GOLDEN ORANGE BROADCASTING CO., INC.)
- KOCE-TV (Channel 50; HUNTINGTON BEACH, CA; Owner: BD. OF TRUSTEES, COAST COMMUNITY COLLEGE DIST.)
- KSCI (Channel 18; LONG BEACH, CA; Owner: KSLS, INC.)
- KXLA (Channel 44; RANCHO PALOS VERDES, CA; Owner: RANCHO PALOS VERDES BROADCASTERS, INC.)
- KCET (Channel 28; LOS ANGELES, CA; Owner: COMMUNITY TELEVISION OF SOUTHERN CALIFORNIA)
- KFTR (Channel 46; ONTARIO, CA; Owner: TELEFUTURA LOS ANGELES LLC)
- KWHY-TV (Channel 22; LOS ANGELES, CA; Owner: TELEMUNDO OF LOS ANGELES LICENSE CORPORATION)
- National Bridge Inventory (NBI) Statistics
- 61Number of bridges
- 1,542ft / 470mTotal length
- 4,319,200Total average daily traffic
- 359,559Total average daily truck traffic
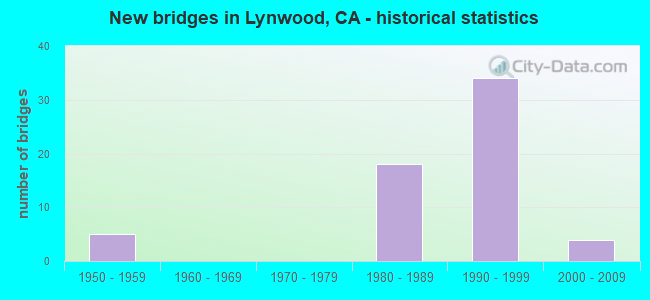
- New bridges - historical statistics
- 51950-1959
- 181980-1989
- 341990-1999
- 42000-2009
FCC Registered Antenna Towers:
17 (See the full list of FCC Registered Antenna Towers in Lynwood)FCC Registered Private Land Mobile Towers:
1 (See the full list of FCC Registered Private Land Mobile Towers in Lynwood, CA)FCC Registered Broadcast Land Mobile Towers:
16 (See the full list of FCC Registered Broadcast Land Mobile Towers)FCC Registered Microwave Towers:
15 (See the full list of FCC Registered Microwave Towers in this town)FCC Registered Paging Towers:
1 (See the full list of FCC Registered Paging Towers)FCC Registered Amateur Radio Licenses:
69 (See the full list of FCC Registered Amateur Radio Licenses in Lynwood)FAA Registered Aircraft:
5- Aircraft: CESSNA 500 (Category: Land, Engines: 2, Seats: 8, Weight: Up to 12,499 Pounds, Speed: 301 mph), Engine: P&W CANADA JT15D-4 (2500 Pounds of Thrust) (Turbo-fan)
N-Number: 431LC, N431LC, N-431LC, Serial Number: 500-0177, Year manufactured: 1974, Airworthiness Date: 10/15/1997, Certificate Issue Date: 06/23/2020
Registrant (Individual): Alan Araujo, 11076 Linden St, Lynwood, CA 90262 - Aircraft: PIPER PA-28-235 (Category: Land, Seats: 4, Weight: Up to 12,499 Pounds, Speed: 107 mph), Engine: LYCOMING 0-540 SERIES (250 HP) (Reciprocating)
N-Number: 9341W, N9341W, N-9341W, Serial Number: 28-11027, Year manufactured: 1968, Airworthiness Date: 03/08/1968, Certificate Issue Date: 08/01/2018
Registrant (Individual): Jonathan B Sleigh, Po Box 975, Lynwood, CA 90262 - Aircraft: CESSNA 150F (Category: Land, Seats: 2, Weight: Up to 12,499 Pounds, Speed: 90 mph), Engine: CONT MOTOR 0-200 SERIES (100 HP) (Reciprocating)
N-Number: 8280F, N8280F, N-8280F, Serial Number: 15064380, Year manufactured: 1966, Certificate Issue Date: 02/09/1967
Registrant (Individual): Robert R Brunel, 3175 Redwood Ave, Lynwood, CA 90262
Deregistered: Cancel Date: 04/03/2020 - Aircraft: PIPER J5A (Category: Land, Seats: 3, Weight: Up to 12,499 Pounds, Speed: 77 mph), Engine: CONT MOTOR A&C75 SERIES (75 HP) (Reciprocating)
N-Number: 38255, N38255, N-38255, Serial Number: 5934, Year manufactured: 1941
Registrant (Individual): A K Meacham, 3350 E Imperial Hwy, Lynwood, CA 90262
Deregistered: Cancel Date: 12/15/2018 - Aircraft: AERONCA 7AC (Category: Land, Seats: 2, Weight: Up to 12,499 Pounds, Speed: 90 mph), Engine: CONT MOTOR A&C65 SERIES (65 HP) (Reciprocating)
N-Number: 85471, N85471, N-85471, Serial Number: 7AC4211, Year manufactured: 1946
Registrant (Partnership): Flying Club Inc Best, 4245 Brewster Ave, Lynwood, CA 90262
Deregistered: Cancel Date: 02/04/2017
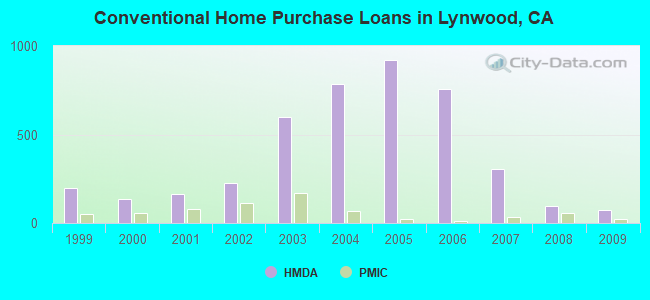
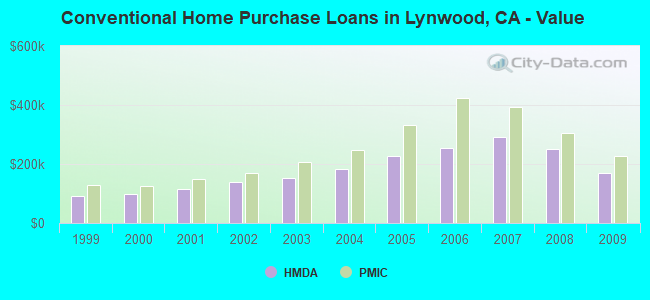
| Home Mortgage Disclosure Act Aggregated Statistics For Year 2009 (Based on 9 full and 3 partial tracts) | ||||||||||||||
| A) FHA, FSA/RHS & VA Home Purchase Loans | B) Conventional Home Purchase Loans | C) Refinancings | D) Home Improvement Loans | E) Loans on Dwellings For 5+ Families | F) Non-occupant Loans on < 5 Family Dwellings (A B C & D) | G) Loans On Manufactured Home Dwelling (A B C & D) | ||||||||
|---|---|---|---|---|---|---|---|---|---|---|---|---|---|---|
| Number | Average Value | Number | Average Value | Number | Average Value | Number | Average Value | Number | Average Value | Number | Average Value | Number | Average Value | |
| LOANS ORIGINATED | 216 | $231,086 | 75 | $169,895 | 208 | $194,870 | 10 | $130,057 | 4 | $507,410 | 31 | $177,946 | 1 | $41,580 |
| APPLICATIONS APPROVED, NOT ACCEPTED | 22 | $247,933 | 16 | $166,974 | 47 | $192,549 | 9 | $90,746 | 0 | $0 | 8 | $169,539 | 0 | $0 |
| APPLICATIONS DENIED | 69 | $235,249 | 30 | $170,387 | 217 | $235,399 | 25 | $75,474 | 1 | $760,000 | 28 | $212,738 | 2 | $25,950 |
| APPLICATIONS WITHDRAWN | 31 | $225,950 | 17 | $130,078 | 80 | $227,951 | 3 | $296,000 | 1 | $618,000 | 16 | $186,312 | 0 | $0 |
| FILES CLOSED FOR INCOMPLETENESS | 15 | $246,908 | 6 | $181,325 | 43 | $235,324 | 3 | $117,667 | 0 | $0 | 2 | $105,000 | 0 | $0 |
Detailed mortgage data for all 12 tracts in Lynwood, CA
| Private Mortgage Insurance Companies Aggregated Statistics For Year 2009 (Based on 9 full and 3 partial tracts) | ||||
| A) Conventional Home Purchase Loans | B) Refinancings | |||
|---|---|---|---|---|
| Number | Average Value | Number | Average Value | |
| LOANS ORIGINATED | 20 | $226,998 | 2 | $226,000 |
| APPLICATIONS APPROVED, NOT ACCEPTED | 19 | $245,367 | 2 | $256,000 |
| APPLICATIONS DENIED | 7 | $205,579 | 1 | $257,000 |
| APPLICATIONS WITHDRAWN | 0 | $0 | 2 | $256,000 |
| FILES CLOSED FOR INCOMPLETENESS | 2 | $274,435 | 0 | $0 |
2005 - 2018 National Fire Incident Reporting System (NFIRS) incidents
- Fire incident types reported to NFIRS in Lynwood, CA
- 62943.2%Outside Fires
- 42829.4%Mobile Property/Vehicle Fires
- 28019.2%Structure Fires
- 1208.2%Other
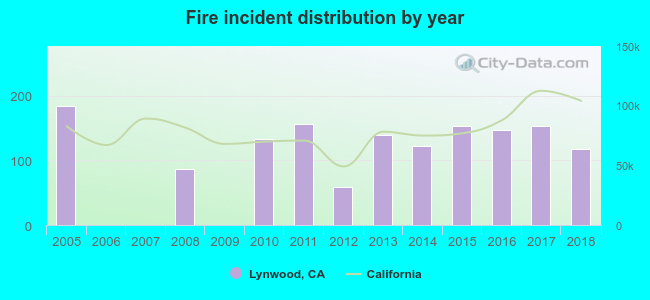 Based on the data from the years 2005 - 2018 the average number of fires per year is 104. The highest number of fires - 185 took place in 2005, and the least - 0 in 2006. The data has a decreasing trend.
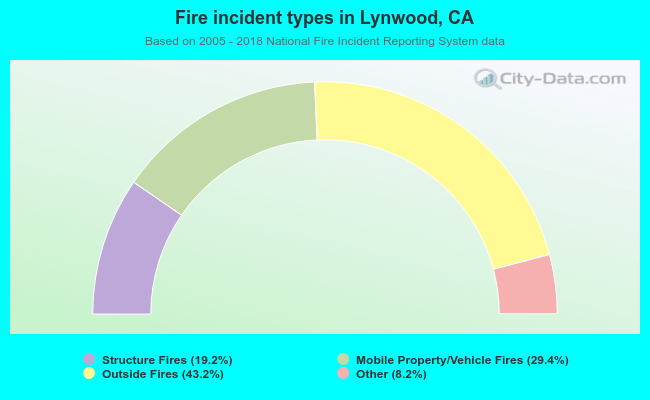 When looking into fire subcategories, the most reports belonged to: Outside Fires (43.2%), and Mobile Property/Vehicle Fires (29.4%).
Fire-safe hotels and motels in Lynwood, California:
- Travelodge Century Freeway, 11401 Long BCH Blvd, Lynwood, California 90262 , Phone: (310) 763-4029
- Curve Motel, 12711 Atlantic Ave, Lynwood, California 90262 , Phone: (310) 632-1075
| Most common first names in Lynwood, CA among deceased individuals | ||
| Name | Count | Lived (average) |
|---|---|---|
| Mary | 199 | 77.8 years |
| John | 198 | 71.9 years |
| James | 164 | 72.6 years |
| William | 163 | 72.5 years |
| Robert | 116 | 68.6 years |
| George | 108 | 74.8 years |
| Charles | 107 | 70.9 years |
| Maria | 100 | 70.9 years |
| Frank | 88 | 71.8 years |
| Joseph | 84 | 73.2 years |
| Most common last names in Lynwood, CA among deceased individuals | ||
| Last name | Count | Lived (average) |
|---|---|---|
| Smith | 95 | 72.3 years |
| Williams | 91 | 72.3 years |
| Johnson | 75 | 73.5 years |
| Jones | 64 | 73.9 years |
| Brown | 48 | 71.0 years |
| Rodriguez | 46 | 72.5 years |
| Miller | 46 | 73.2 years |
| Jackson | 41 | 73.4 years |
| Hernandez | 38 | 68.8 years |
| Davis | 38 | 73.5 years |
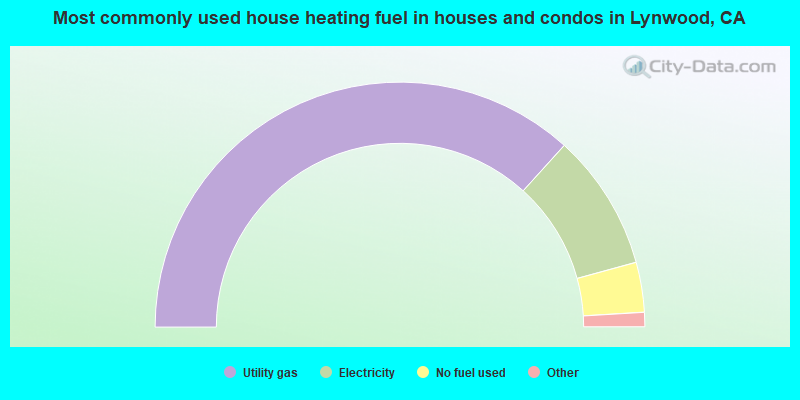
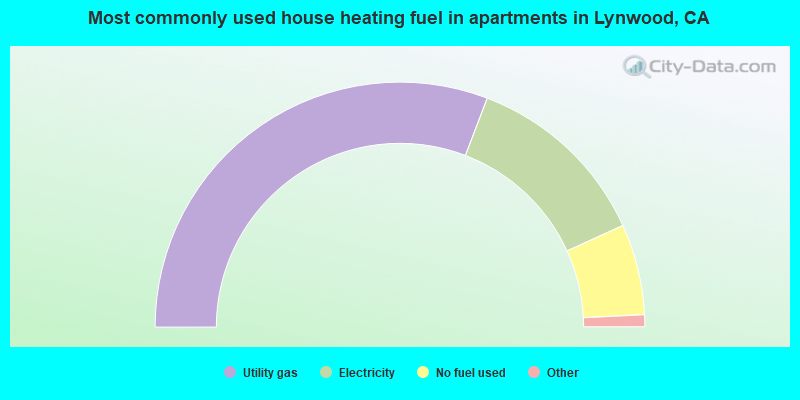
- 73.5%Utility gas
- 18.1%Electricity
- 6.6%No fuel used
- 0.7%Solar energy
- 0.7%Other fuel
- 0.3%Wood
- 0.2%Bottled, tank, or LP gas
- 61.6%Utility gas
- 24.8%Electricity
- 12.0%No fuel used
- 1.1%Bottled, tank, or LP gas
- 0.4%Other fuel
- 0.1%Solar energy
Lynwood compared to California state average:
- Hispanic race population percentage above state average.
- Median age below state average.
- Length of stay since moving in above state average.
- House age above state average.
- Institutionalized population percentage above state average.
- Percentage of population with a bachelor's degree or higher significantly below state average.
Lynwood on our top lists:
- #3 on the list of "Top 101 cities with the least people having professional degrees (population 50,000+)"
- #3 on the list of "Top 101 cities with the most cars per house, population 50,000+"
- #4 on the list of "Top 100 least-educated cities (pop. 50,000+)"
- #7 on the list of "Top 101 cities with largest percentage of females in industries: manufacturing (population 50,000+)"
- #7 on the list of "Top 101 cities with largest percentage of females in industries: wholesale trade (population 50,000+)"
- #8 on the list of "Top 101 cities with the lowest number of thefts per 100,000 residents (population 50,000+)"
- #9 on the list of "Top 101 cities with largest percentage of females in occupations: material moving occupations (population 50,000+)"
- #10 on the list of "Top 101 cities with largest percentage of females in occupations: production occupations (population 50,000+)"
- #12 on the list of "Top 101 cities with fewest building permits per 10,000 residents (population 50,000+)"
- #14 on the list of "Top 101 cities with the smallest house values disparities (population 50,000+)"
- #16 on the list of "Top 101 cities with the lowest percentage of English-only speaking households, population 50,000+"
- #17 on the list of "Top 101 cities with largest percentage of males in occupations: transportation occupations (population 50,000+)"
- #23 on the list of "Top 101 cities with the least people having Master's or Doctorate degrees (population 50,000+)"
- #24 on the list of "Top 101 cities with largest percentage of males in occupations: material moving occupations (population 50,000+)"
- #24 on the list of "Top 101 cities with largest percentage of males in industries: wholesale trade (population 50,000+)"
- #29 on the list of "Top 101 cities with the highest ratio of murders to rapes between 2002 and 2012 (population 50,000+)"
- #30 on the list of "Top 101 cities with largest percentage of males in industries: transportation and warehousing (population 50,000+)"
- #37 on the list of "Top 100 cities with youngest residents (pop. 50,000+)"
- #39 on the list of "Top 101 cities with the lowest percentage of workers working at home, population 50,000+"
- #39 on the list of "Top 100 cities with old houses but young residents (pop. 50,000+)"
- #31 (90280) on the list of "Top 101 zip codes with the largest percentage of taxpayers using paid preparers for 2012 taxes (pop 5,000+)"
- #1 on the list of "Top 101 counties with the most Evangelical Protestant congregations"
- #1 on the list of "Top 101 counties with the most Mainline Protestant congregations"
- #1 on the list of "Top 101 counties with the most Orthodox adherents"
- #1 on the list of "Top 101 counties with the highest ground withdrawal of fresh water for public supply (pop. 50,000+)"
- #1 on the list of "Top 101 counties with the most Catholic adherents (pop. 50,000+)"

|
|
Total of 8 patent applications in 2008-2024.