Riverside County, California (CA)
County owner-occupied free and clear houses and condos in 2010: 98,752
County owner-occupied houses and condos in 2000: 348,479
Renter-occupied apartments: 224,048 (it was 157,739 in 2000)
| % of renters here: | 31% |
| State: | 44% |
Land area: 7207 sq. mi.
Water area: 95.8 sq. mi.
Population density: 343 people per square mile (high).
Industries providing employment: Educational, health and social services (20.2%), Arts, entertainment, recreation, accommodation and food services (12.0%), Retail trade (11.9%), Professional, scientific, management, administrative, and waste management services (10.5%).
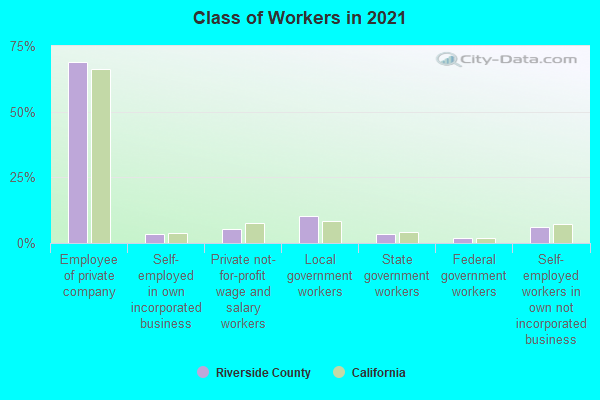
Type of workers:
- Private wage or salary: 78%
- Government: 15%
- Self-employed, not incorporated: 6%
- Unpaid family work: 0%
- OSM Map
- General Map
- Google Map
- MSN Map

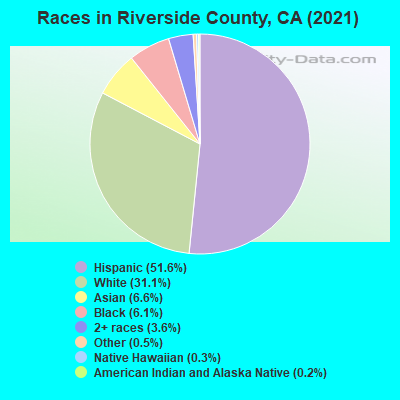
- 1,287,20852.0%Hispanic or Latino
- 747,67330.2%White Non-Hispanic Alone
- 173,8147.0%Asian alone
- 151,5106.1%Black Non-Hispanic Alone
- 82,0373.3%Two or more races
- 16,9940.7%Some other race alone
- 7,5510.3%Native Hawaiian and Other
Pacific Islander alone - 7,1150.3%American Indian and Alaska Native alone
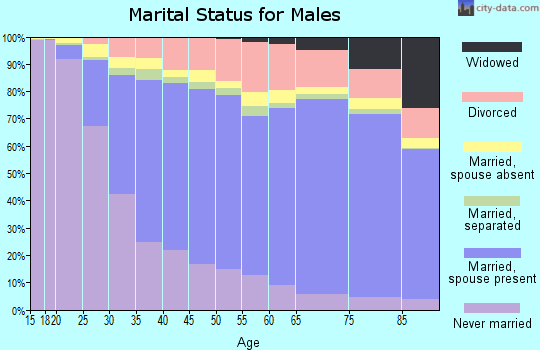
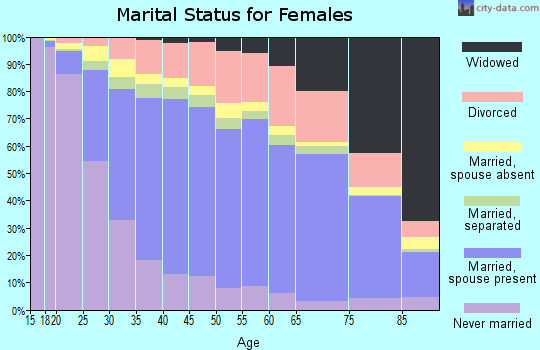
| Median resident age: | 36.8 years |
| California median age: | 37.9 years |
| Males: 1,243,465 | |
| Females: 1,230,437 |

 | Riverside County CA (4 replies) |
| Riverside County good place for young families to buy homes? (4 replies) |
| Coronavirus (12544 replies) |
| April 2021: CA Median Home Price Soars to $813,980; Sales Climb 65.1% Year-Over-Year (81 replies) |
| California's Linguistic Diversity (73 replies) |
| San Bernardino, CA city gentifrication, 2020+ and beyond... (59 replies) |
| Riverside County: | 3.0 people |
| California: | 3 people |
Estimated median household income in 2022: $86,748 ($42,887 in 1999)
| This county: | $86,748 |
| California: | $91,551 |
Median contract rent in 2022 for apartments: $1,555 (lower quartile is $1,062, upper quartile is $2,061)
| This county: | $1555 |
| State: | $1719 |
Estimated median house or condo value in 2022: $555,400 (it was $135,000 in 2000)
| Riverside: | $555,400 |
| California: | $715,900 |
Mean price in 2022:
Median monthly housing costs for homes and condos with a mortgage: $2,320Detached houses: $631,165
Here: $631,165 State: $988,808 Townhouses or other attached units: $625,082
Here: $625,082 State: $838,546 In 2-unit structures: $464,831
Here: $464,831 State: $1,138,100 In 3-to-4-unit structures: $482,529
Here: $482,529 State: $824,253 In 5-or-more-unit structures: $526,423
Here: $526,423 State: $730,996 Mobile homes: $178,284
Here: $178,284 State: $184,506 Occupied boats, RVs, vans, etc.: $86,227
Here: $86,227 State: $204,957
Median monthly housing costs for units without a mortgage: $688
Institutionalized population: 20,862
Crime in 2020 (reported by the sheriff's office or county police, not the county total):
- Murders: 43
- Rapes: 32
- Robberies: 149
- Assaults: 740
- Burglaries: 1242
- Thefts: 3969
- Auto thefts: 1690
Crime in 2019 (reported by the sheriff's office or county police, not the county total):
- Murders: 24
- Rapes: 37
- Robberies: 179
- Assaults: 692
- Burglaries: 1454
- Thefts: 4320
- Auto thefts: 1446
Health of residents in Riverside County based on CDC Behavioral Risk Factor Surveillance System Survey Questionnaires from 2013 to 2021:
General health status score of residents in this county from 1 (poor) to 5 (excellent) is 3.4. This is worse than average.70.4% of residents exercised in the past month. This is about average.
38.7% of residents smoked 100+ cigarettes in their lives. This is less than average.
50.0% of adult residents drank alcohol in the past 30 days. This is less than average.
63.8% of residents visited a dentist within the past year. This is less than average.
Average weight of males is 193 pounds. This is about average.
Average weight of females is 162 pounds. This is about average.
Health of residents in Riverside County based on CDC Behavioral Risk Factor Surveillance System Survey Questionnaires from 2003 to 2012:
General health status score of residents in this county from 1 (poor) to 5 (excellent) is 3.4. This is about average.73.7% of residents exercised in the past month. This is about average.
44.1% of residents smoked 100+ cigarettes in their lives. This is about average.
77.0% of adult residents drank alcohol in the past 30 days. This is about average.
67.7% of residents visited a dentist within the past year. This is about average.
Average weight of males is 194 pounds. This is about average.
Average weight of females is 158 pounds. This is about average.
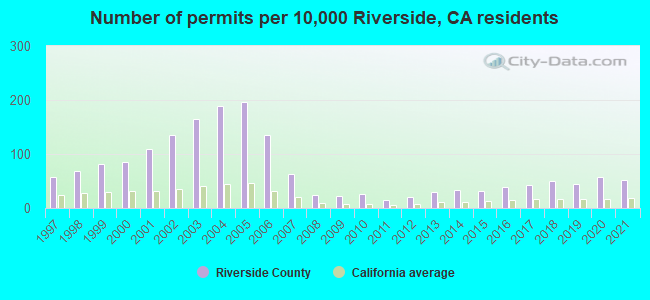
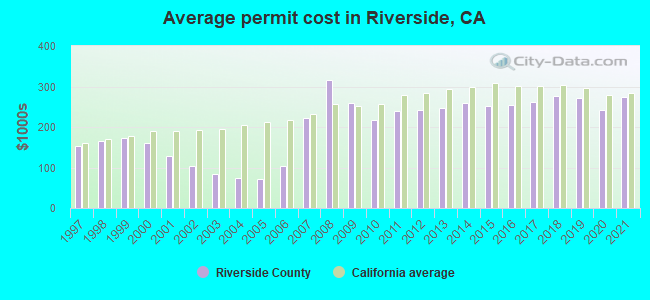
Single-family new house construction building permits:
- 2022: 8461 buildings, average cost: $253,800
- 2021: 7835 buildings, average cost: $274,100
- 2020: 8895 buildings, average cost: $241,400
- 2019: 7002 buildings, average cost: $270,600
- 2018: 7676 buildings, average cost: $277,200
- 2017: 6703 buildings, average cost: $262,200
- 2016: 5987 buildings, average cost: $254,100
- 2015: 4934 buildings, average cost: $251,700
- 2014: 5074 buildings, average cost: $259,500
- 2013: 4432 buildings, average cost: $245,600
- 2012: 3107 buildings, average cost: $241,400
- 2011: 2275 buildings, average cost: $238,600
- 2010: 4027 buildings, average cost: $217,900
- 2009: 3406 buildings, average cost: $259,800
- 2008: 3820 buildings, average cost: $317,100
- 2007: 9717 buildings, average cost: $221,000
- 2006: 20882 buildings, average cost: $102,800
- 2005: 30350 buildings, average cost: $70,800
- 2004: 29182 buildings, average cost: $73,600
- 2003: 25424 buildings, average cost: $84,500
- 2002: 20912 buildings, average cost: $102,700
- 2001: 16778 buildings, average cost: $128,000
- 2000: 13323 buildings, average cost: $161,200
- 1999: 12490 buildings, average cost: $171,900
- 1998: 10643 buildings, average cost: $165,900
- 1997: 8770 buildings, average cost: $151,800
Median real estate property taxes paid for housing units with mortgages in 2022: $4,479 (0.8%)
Median real estate property taxes paid for housing units with no mortgage in 2022: $3,177 (0.7%)
| Riverside County: | 10.7% |
| California: | 12.2% |
Median age of residents in 2022: 36.8 years old
(Males: 36.0 years old, Females: 37.7 years old)
(Median age for: White residents: 50.6 years old, Black residents: 37.1 years old, American Indian residents: 33.6 years old, Asian residents: 41.3 years old, Hispanic or Latino residents: 30.6 years old, Other race residents: 31.2 years old)
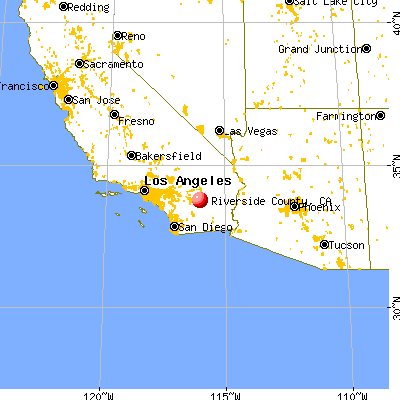
Area name: Riverside-San Bernardino-Ontario, CA MSA
Fair market rent in 2006 for a 1-bedroom apartment in Riverside County is $781 a month.
Fair market rent for a 2-bedroom apartment is $911 a month.
Fair market rent for a 3-bedroom apartment is $1294 a month.
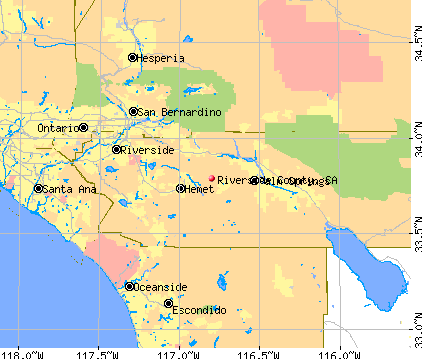
Cities in this county include: Riverside, Perris Valley, Moreno Valley, Corona, Coachella Valley, Jurupa, Menifee, Elsinore Valley, Hemet, Temecula.
| Zip code | City | Number of tests | Number of tests >= 4 pCi/L |
|---|---|---|---|
| 91718 | Corona | 6 | 0 |
| 91719 | Corona | 11 | 0 |
| 91720 | Corona | 21 | 0 |
| 91752 | Mira Loma | 3 | 0 |
| 91760 | Norco | 3 | 0 |
| 92201 | Indio | 10 | 0 |
| 92202 | Indio | 1 | 0 |
| 92203 | Indio | 5 | 0 |
| 92210 | Indian Wells | 3 | 0 |
| 92211 | Palm Desert | 9 | 0 |
| 92220 | Banning | 6 | 0 |
| 92223 | Beaumont | 13 | 0 |
| 92225 | Blythe | 1 | 0 |
| 92230 | Cabazon | 2 | 0 |
| 92234 | Cathedral City | 11 | 0 |
| 92235 | Cathedral City | 1 | 0 |
| 92239 | Desert Center | 1 | 0 |
| 92240 | Desert Hot Springs | 4 | 0 |
| 92241 | Desert Hot Springs | 2 | 0 |
| 92253 | La Quinta | 15 | 0 |
| 92254 | Mecca | 1 | 0 |
| 92258 | North Palm Springs | 5 | 0 |
| 92260 | Palm Desert | 21 | 1 |
| 92261 | Palm Desert | 1 | 1 |
| 92262 | Palm Springs | 37 | 1 |
| 92263 | Palm Springs | 2 | 0 |
| 92264 | Palm Springs | 16 | 0 |
| 92270 | Rancho Mirage | 20 | 2 |
| 92274 | Thermal | 1 | 0 |
| 92320 | Calimesa | 3 | 0 |
| 92501 | Riverside | 6 | 1 |
| 92503 | Riverside | 16 | 0 |
| 92504 | Riverside | 20 | 1 |
| 92505 | Riverside | 11 | 0 |
| 92506 | Riverside | 22 | 1 |
| 92507 | Riverside | 33 | 0 |
| 92508 | Riverside | 7 | 0 |
| 92509 | Riverside | 11 | 0 |
| 92519 | Riverside | 1 | 0 |
| 92530 | Lake Elsinore | 3 | 0 |
| 92532 | Lake Elsinore | 1 | 0 |
| 92536 | Aguanga | 1 | 0 |
| 92543 | Hemet | 8 | 0 |
| 92544 | Hemet | 22 | 0 |
| 92545 | Hemet | 6 | 0 |
| 92546 | Hemet | 1 | 0 |
| 92548 | Homeland | 1 | 0 |
| 92549 | Idyllwild | 9 | 2 |
| 92551 | Moreno Valley | 4 | 0 |
| 92553 | Moreno Valley | 13 | 0 |
| 92555 | Moreno Valley | 4 | 0 |
| 92557 | Moreno Valley | 8 | 0 |
| 92561 | Mountain Center | 2 | 0 |
| 92562 | Murrieta | 29 | 1 |
| 92563 | Murrieta | 20 | 2 |
| 92567 | Nuevo | 2 | 0 |
| 92570 | Perris | 2 | 0 |
| 92571 | Perris | 1 | 0 |
| 92582 | San Jacinto | 9 | 2 |
| 92583 | San Jacinto | 12 | 0 |
| 92584 | Menifee | 3 | 0 |
| 92585 | Sun City | 6 | 0 |
| 92586 | Sun City | 7 | 0 |
| 92587 | Sun City | 22 | 7 |
| 92590 | Temecula | 2 | 0 |
| 92591 | Temecula | 8 | 0 |
| 92592 | Temecula | 14 | 0 |
| 92595 | Wildomar | 5 | 0 |
| 92860 | Norco | 1 | 0 |
| 92879 | Corona | 5 | 0 |
| 92880 | Corona | 14 | 1 |
| 92881 | Corona | 5 | 0 |
| 92882 | Corona | 30 | 0 |
| 92883 | Corona | 8 | 1 |
2023 air pollution in Riverside County:
Carbon Monoxide: 0.243 ppm (standard limit: 9 ppm). Near U.S. average.
Nitrogen Dioxide: 0.01 ppm (standard limit: 0.053 ppm). Above U.S. average.
Ozone (1-hour): 0.043 ppm (standard limit: 0.12 ppm). Above U.S. average.
Particulate Matter (PM10) Annual: 27.4 µg/m3. Above U.S. average.
Particulate Matter (PM2.5) Annual: 8.3 µg/m3(standard limit: 15.0 µg/m3). Near U.S. average.
Sulfur Oxides Annual: 0.000 ppm (standard limit: 0.03 ppm). Near U.S. average.
Notable locations in this county outside city limits:
Notable locations in Riverside County: Lookout Cabin (A), Stanton Ranch (B), Christi Ranch (C). Display/hide their locations on the map
Beach: Christi Beach (A). Display/hide its location on the map
| Here: | 5.2% |
| California: | 5.1% |
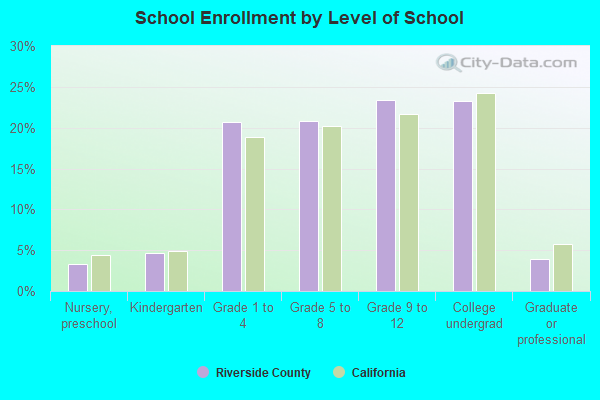
Current college students: 88,703
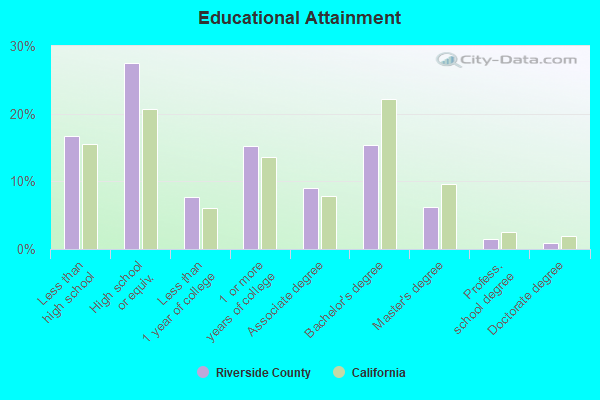
People 25 years of age or older with a high school degree or higher: 83.0%
People 25 years of age or older with a bachelor's degree or higher: 25.0%
Number of foreign born residents: 543,792 (55.9% naturalized citizens)
| Riverside County: | 22.0% |
| Whole state: | 26.7% |
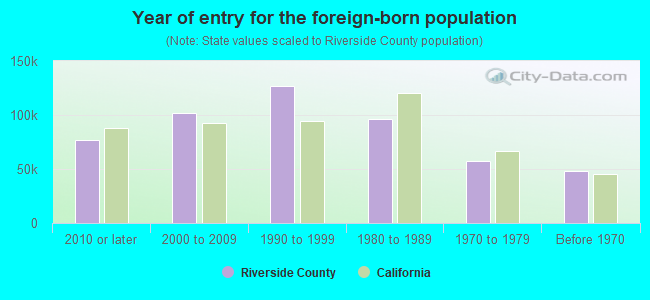
- Year of entry for the foreign-born population
- 84,9872010 or later
- 118,2902000 to 2009
- 114,9791990 to 1999
- 95,8631980 to 1989
- 57,8231970 to 1979
- 48,163Before 1970
Mean travel time to work (commute): ! minutes
Percentage of county residents living and working in this county: 99.5%
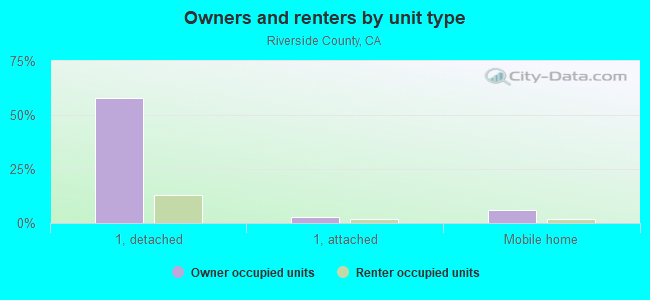
Housing units in structures:
- One, detached: 587,231
- One, attached: 56,065
- Two: 10,615
- 3 or 4: 32,830
- 5 to 9: 30,872
- 10 to 19: 21,664
- 20 to 49: 17,006
- 50 or more: 32,634
- Mobile homes: 77,191
- Boats, RVs, vans, etc.: 1,853
Housing units in Riverside County with a mortgage: 361,831 (23,071 second mortgage, 1,030 home equity loan, 17,796 both second mortgage and home equity loan)
Houses without a mortgage: 3,997
| Here: | 99.2% with mortgage |
| State: | 98.6% with mortgage |
Religion statistics for Riverside County


| Religion | Adherents | Congregations |
|---|---|---|
| Catholic | 602,765 | 51 |
| Evangelical Protestant | 240,306 | 741 |
| Other | 77,581 | 194 |
| Mainline Protestant | 29,535 | 103 |
| Black Protestant | 19,170 | 40 |
| Orthodox | 3,647 | 11 |
| None | 1,216,637 | - |
Source: Clifford Grammich, Kirk Hadaway, Richard Houseal, Dale E.Jones, Alexei Krindatch, Richie Stanley and Richard H.Taylor. 2012. 2010 U.S.Religion Census: Religious Congregations & Membership Study. Association of Statisticians of American Religious Bodies. Jones, Dale E., et al. 2002. Congregations and Membership in the United States 2000. Nashville, TN: Glenmary Research Center.
Food Environment Statistics:
| Riverside County: | 1.60 / 10,000 pop. |
| State: | 2.14 / 10,000 pop. |
| Here: | 0.05 / 10,000 pop. |
| California: | 0.04 / 10,000 pop. |
| This county: | 0.44 / 10,000 pop. |
| California: | 0.62 / 10,000 pop. |
| Riverside County: | 1.51 / 10,000 pop. |
| California: | 1.49 / 10,000 pop. |
| This county: | 5.45 / 10,000 pop. |
| State: | 7.42 / 10,000 pop. |
| Riverside County: | 7.7% |
| California: | 7.3% |
| Riverside County: | 24.5% |
| State: | 21.3% |
| Here: | 15.2% |
| State: | 17.9% |
Agriculture in Riverside County:
Average size of farms: 180 acresAverage value of agricultural products sold per farm: $316,470
Average value of crops sold per acre for harvested cropland: $3415.92
The value of nursery, greenhouse, floriculture, and sod as a percentage of the total market value of agricultural products sold: 12.10%
The value of livestock, poultry, and their products as a percentage of the total market value of agricultural products sold: 33.81%
Average total farm production expenses per farm: $253,339
Harvested cropland as a percentage of land in farms: 34.15%
Irrigated harvested cropland as a percentage of land in farms: 95.56%
Average market value of all machinery and equipment per farm: $63,339
The percentage of farms operated by a family or individual: 83.05%
Average age of principal farm operators: 58 years
Average number of cattle and calves per 100 acres of all land in farms: 31.65
Milk cows as a percentage of all cattle and calves: 49.90%
Corn for grain: 349 harvested acres
All wheat for grain: 4936 harvested acres
Upland cotton: 10307 harvested acres
Vegetables: 41,110 harvested acres
Land in orchards: 61,910 acres
Earthquake activity:
Riverside County-area historical earthquake activity is significantly above California state average. It is 7069% greater than the overall U.S. average.On 6/28/1992 at 11:57:34, a magnitude 7.6 (6.2 MB, 7.6 MS, 7.3 MW, Depth: 0.7 mi, Class: Major, Intensity: VIII - XII) earthquake occurred 31.8 miles away from Riverside County center, causing 3 deaths (1 shaking deaths, 2 other deaths) and 400 injuries, causing $100,000,000 total damage and $40,000,000 insured losses
On 10/16/1999 at 09:46:44, a magnitude 7.4 (6.3 MB, 7.4 MS, 7.2 MW, 7.3 ML) earthquake occurred 54.8 miles away from the county center
On 7/21/1952 at 11:52:14, a magnitude 7.7 (7.7 UK) earthquake occurred 151.0 miles away from the county center, causing $50,000,000 total damage
On 5/19/1940 at 04:36:40, a magnitude 7.2 (7.2 UK) earthquake occurred 74.7 miles away from the county center, causing $33,000,000 total damage
On 6/28/1992 at 15:05:30, a magnitude 6.9 (6.3 MB, 6.7 MS, 6.5 MW, 6.9 ME, Depth: 3.1 mi, Class: Strong, Intensity: VII - IX) earthquake occurred 35.0 miles away from Riverside County center
On 12/31/1934 at 18:45:56, a magnitude 7.1 (7.1 UK) earthquake occurred 97.0 miles away from the county center
Magnitude types: body-wave magnitude (MB), energy magnitude (ME), local magnitude (ML), surface-wave magnitude (MS), moment magnitude (MW)
Most recent natural disasters:
- California Covid-19 Pandemic, Incident Period: January 20, 2020, FEMA Id: 4482, Natural disaster type: Other
- California Severe Winter Storms, Flooding, Landslides, And Mudslides, Incident Period: February 13, 2019 - February 15, 2019, FEMA Id: 4431, Natural disaster type: Winter Storm, Mudslide, Landslide, Flood
- California Severe Winter Storms, Flooding, And Mudslides, Incident Period: January 18, 2017 - January 23, 2017, FEMA Id: 4305, Natural disaster type: Winter Storm, Mudslide, Flood
- California Winter Storms, Flooding, and Debris and Mud Flows, Incident Period: December 17, 2010 to January 04, 2011, Major Disaster (Presidential) Declared DR-1952: January 26, 2011, FEMA Id: 1952, Natural disaster type: Winter Storm, Flood
- California Severe Winter Storms, Flooding, and Debris and Mud Flows, Incident Period: January 17, 2010 to February 06, 2010, Major Disaster (Presidential) Declared DR-1884: March 08, 2010, FEMA Id: 1884, Natural disaster type: Winter Storm, Flood
- California Freeway Complex Fire, Incident Period: November 15, 2008 to November 20, 2008, Fire Management Assistance Declared: November 15, 2008, FEMA Id: 2792, Natural disaster type: Fire
- California Wildfires, Incident Period: November 13, 2008 to November 28, 2008, Major Disaster (Presidential) Declared DR-1810: November 18, 2008, FEMA Id: 1810, Natural disaster type: Fire
- California Wildfires, Incident Period: October 21, 2007 to March 31, 2008, Major Disaster (Presidential) Declared EM-3279: October 23, 2007, FEMA Id: 3279, Natural disaster type: Fire
- California Wildfires, Incident Period: October 21, 2007 to March 31, 2008, Major Disaster (Presidential) Declared DR-1731: October 24, 2007, FEMA Id: 1731, Natural disaster type: Fire
- California Esperanza Fire, Incident Period: October 26, 2006 to October 31, 2006, Fire Management Assistance Declared: October 26, 2006, FEMA Id: 2678, Natural disaster type: Fire
- 36 other natural disasters have been reported since 1953.
The number of natural disasters in Riverside County (46) is a lot greater than the US average (15).
Major Disasters (Presidential) Declared: 27
Emergencies Declared: 1
Causes of natural disasters: Fires: 22, Floods: 20, Storms: 8, Winter Storms: 8, Landslides: 6, Mudslides: 5, Heavy Rains: 2, Earthquake: 1, Flash Flood: 1, Freeze: 1, Hurricane: 1, Tornado: 1, Tropical Storm: 1, Other: 1 (Note: some incidents may be assigned to more than one category).
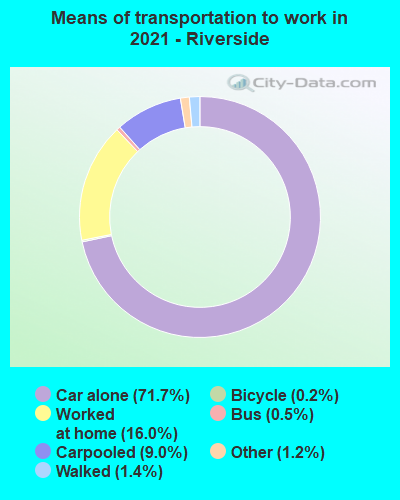
Means of transportation to work:
- Drove a car alone: 681,640 (71.8%)
- Carpooled: 104,872 (11.0%)
- Bus: 4,385 (0.5%)
- Subway or elevated rail: 41 (0.0%)
- Long-distance train or commuter rail: 88 (0.0%)
- Ferryboat: 44 (0.0%)
- Taxicab, motorcycle, or other means: 12,441 (1.3%)
- Bicycle: 3,163 (0.3%)
- Walked: 11,818 (1.2%)
- Worked at home: 130,812 (13.8%)
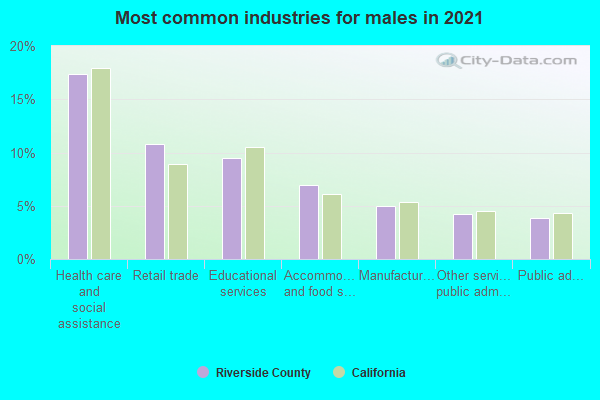
- Health care and social assistance (17%)
- Retail trade (10%)
- Educational services (10%)
- Accommodation and food services (8%)
- Professional, scientific, and technical services (5%)
- Other services, except public administration (4%)
- Manufacturing (4%)
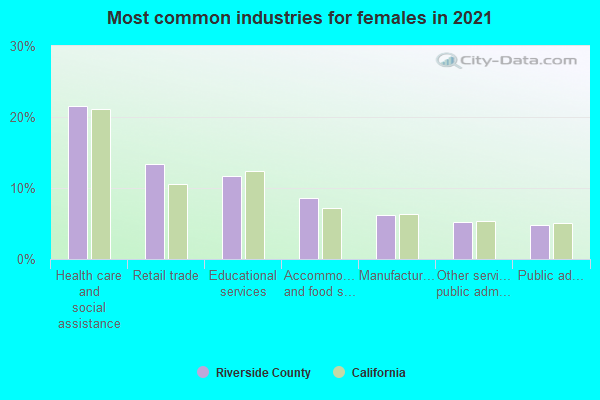
- Health care and social assistance (21%)
- Retail trade (13%)
- Educational services (12%)
- Accommodation and food services (10%)
- Professional, scientific, and technical services (6%)
- Other services, except public administration (5%)
- Manufacturing (5%)
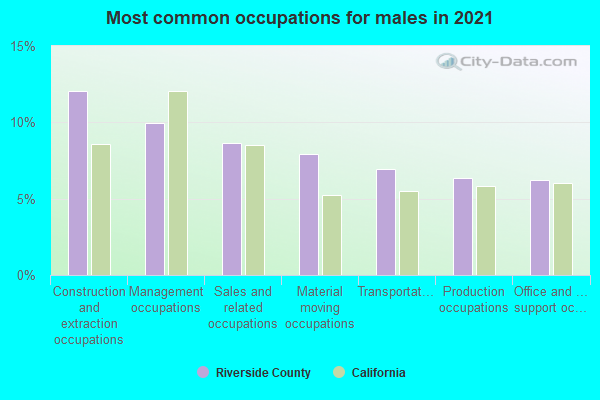
- Construction and extraction occupations (12%)
- Management occupations (10%)
- Sales and related occupations (9%)
- Transportation occupations (7%)
- Material moving occupations (7%)
- Production occupations (6%)
- Installation, maintenance, and repair occupations (6%)
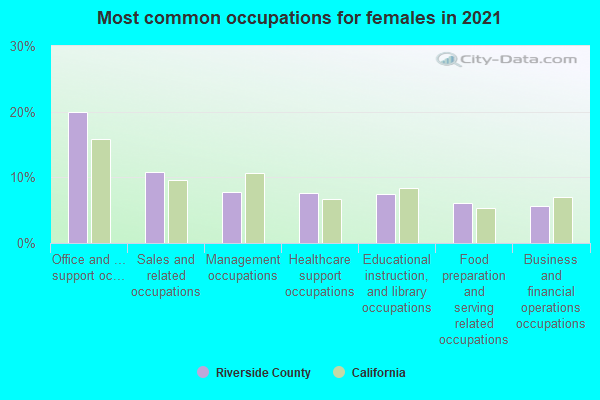
- Office and administrative support occupations (19%)
- Sales and related occupations (11%)
- Management occupations (8%)
- Healthcare support occupations (8%)
- Educational instruction, and library occupations (8%)
- Food preparation and serving related occupations (7%)
- Health diagnosing and treating practitioners and other technical occupations (5%)
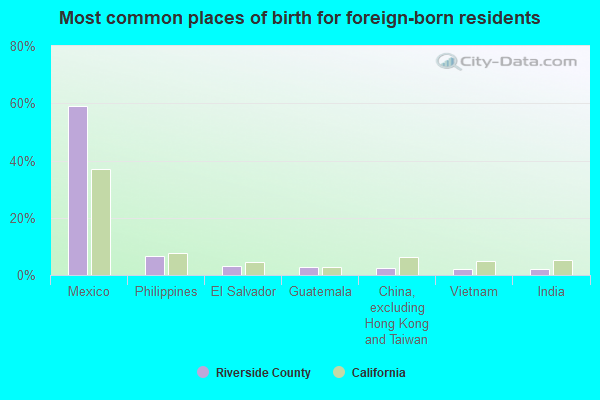
- Mexico (56%)
- Philippines (6%)
- Guatemala (3%)
- El Salvador (3%)
- China, excluding Hong Kong and Taiwan (3%)
- India (2%)
- Vietnam (2%)
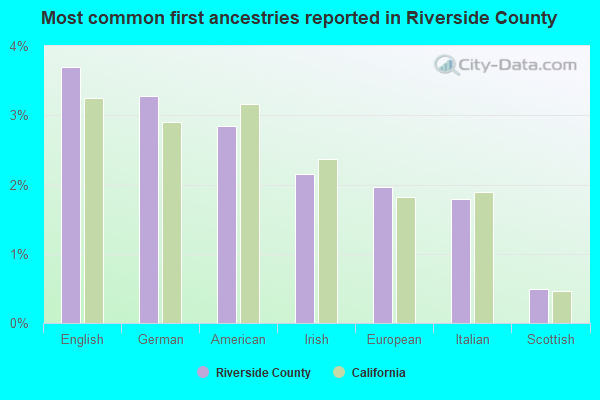
- English (4%)
- American (3%)
- German (3%)
- Irish (2%)
- Italian (2%)
- European (1%)
- Scottish (1%)
People in group quarters in Riverside County, California in 2010:
- 12,403 people in state prisons
- 7,610 people in college/university student housing
- 3,770 people in nursing facilities/skilled-nursing facilities
- 3,442 people in local jails and other municipal confinement facilities
- 2,193 people in group homes intended for adults
- 2,189 people in other noninstitutional facilities
- 1,401 people in workers' group living quarters and job corps centers
- 987 people in residential treatment centers for adults
- 587 people in emergency and transitional shelters (with sleeping facilities) for people experiencing homelessness
- 368 people in correctional facilities intended for juveniles
- 280 people in group homes for juveniles (non-correctional)
- 247 people in residential treatment centers for juveniles (non-correctional)
- 197 people in residential schools for people with disabilities
- 85 people in correctional residential facilities
- 40 people in hospitals with patients who have no usual home elsewhere
- 30 people in in-patient hospice facilities
People in group quarters in Riverside County, California in 2000:
- 13,771 people in state prisons
- 4,502 people in nursing homes
- 3,306 people in college dormitories (includes college quarters off campus)
- 2,955 people in other group homes
- 2,845 people in other noninstitutional group quarters
- 2,230 people in local jails and other confinement facilities (including police lockups)
- 958 people in homes for the mentally retarded
- 757 people in agriculture workers' dormitories on farms
- 673 people in homes or halfway houses for drug/alcohol abuse
- 426 people in homes for the mentally ill
- 379 people in unknown juvenile institutions
- 285 people in religious group quarters
- 248 people in other types of correctional institutions
- 175 people in institutions for the deaf
- 157 people in other nonhousehold living situations
- 139 people in training schools for juvenile delinquents
- 132 people in mental (psychiatric) hospitals or wards
- 82 people in residential treatment centers for emotionally disturbed children
- 79 people in schools, hospitals, or wards for the intellectually disabled
- 68 people in homes for abused, dependent, and neglected children
- 65 people in hospitals or wards for drug/alcohol abuse
- 51 people in hospitals/wards and hospices for chronically ill
- 51 people in other hospitals or wards for chronically ill
- 18 people in other workers' dormitories
- 15 people in orthopedic wards and institutions for the physically handicapped
- 13 people in job corps and vocational training facilities
- 12 people in homes for the physically handicapped
- 11 people in short-term care, detention or diagnostic centers for delinquent children
7.19% of this county's 2021 resident taxpayers lived in other counties in 2020 ($71,521 average adjusted gross income)
| Here: | 7.19% |
| California average: | 5.19% |
0.03% of residents moved from foreign countries ($210 average AGI)
Riverside County: 0.03% California average: 0.03%
5.72% relocated from other counties in California ($57,081 average AGI)
1.44% relocated from other states ($14,230 average AGI)
Riverside County: 1.44% California average: 1.56%
Top counties from which taxpayers relocated into this county between 2020 and 2021:
| from Los Angeles County, CA | |
| from San Bernardino County, CA | |
| from Orange County, CA | |
| from San Diego County, CA | |
| from Clark County, NV | |
| from Maricopa County, AZ | |
| from Ventura County, CA |
6.28% of this county's 2020 resident taxpayers moved to other counties in 2021 ($64,593 average adjusted gross income)
| Here: | 6.28% |
| California average: | 6.14% |
0.02% of residents moved to foreign countries ($200 average AGI)
Riverside County: 0.02% California average: 0.02%
3.57% relocated to other counties in California ($32,915 average AGI)
2.68% relocated to other states ($31,478 average AGI)
Riverside County: 2.68% California average: 2.55%
Top counties to which taxpayers relocated from this county between 2020 and 2021:
| to San Bernardino County, CA | |
| to Los Angeles County, CA | |
| to Orange County, CA | |
| to San Diego County, CA | |
| to Maricopa County, AZ | |
| to Clark County, NV | |
| to Mohave County, AZ |
Births per 1000 population from 1990 to 1999: 18.2
Births per 1000 population from 2000 to 2009: 15.9
Births per 1000 population from 2010 to 2022: 10.7
Deaths per 1000 population from 1990 to 1999: 8.0
Deaths per 1000 population from 2000 to 2009: 7.2
Deaths per 1000 population from 2010 to 2020: 6.9
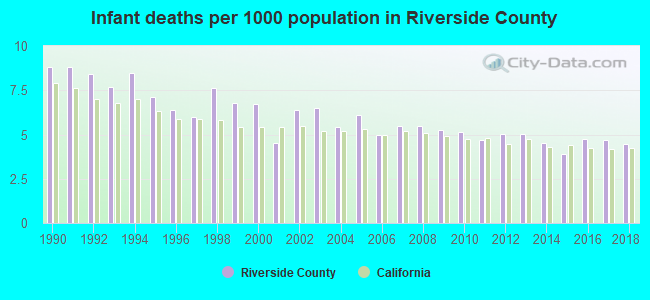
Infant deaths per 1000 live births from 1990 to 1999: 7.6
Infant deaths per 1000 live births from 2000 to 2009: 5.7
Infant deaths per 1000 live births from 2010 to 2021: 4.6
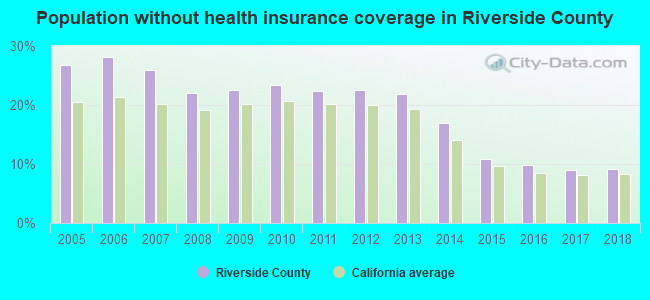
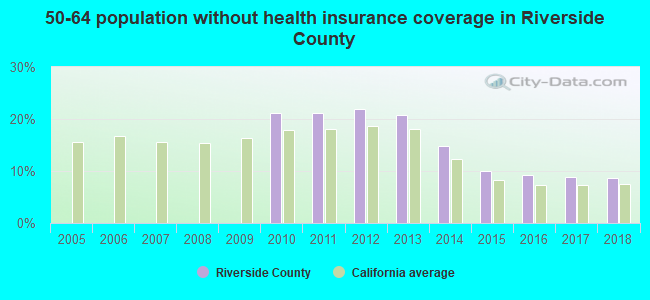
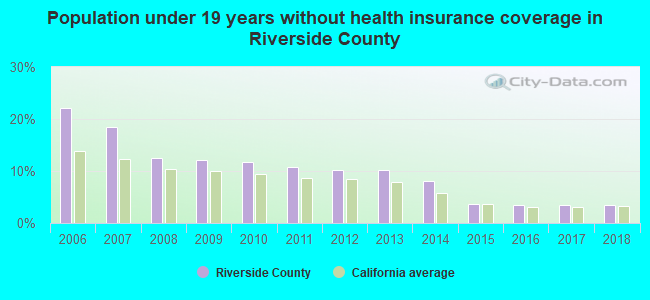
Persons under 19 years old without health insurance coverage in 2018: 3.4%
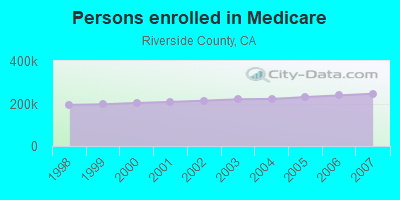
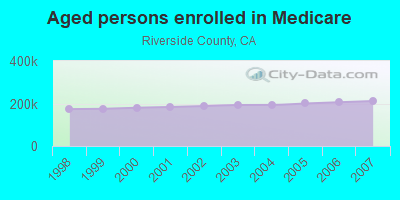
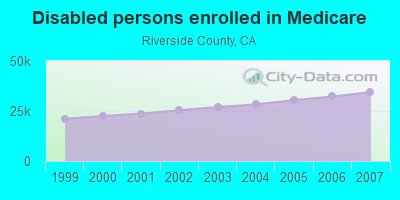
Persons enrolled in hospital insurance and/or supplemental medical insurance (Medicare) in July 1, 2007: 246,077 (211,632 aged, 34,445 disabled)
Children under 18 without health insurance coverage in 2007: 105,422 (18%)
Most common underlying causes of death in Riverside County, California in 1999 - 2019:
- Atherosclerotic heart disease (29,958)
- Bronchus or lung, unspecified - Malignant neoplasms (16,367)
- Chronic obstructive pulmonary disease, unspecified (16,356)
- Acute myocardial infarction, unspecified (14,411)
- Alzheimer disease, unspecified (13,276)
- Atherosclerotic cardiovascular disease, so described (13,265)
- Stroke, not specified as haemorrhage or infarction (8,263)
- Congestive heart failure (6,638)
- Hypertensive heart disease without (congestive) heart failure (5,800)
- Pneumonia, unspecified (5,397)
Population without health insurance coverage in 2000: 20%
Children under 18 without health insurance coverage in 2000: 17%
Homicides per 1,000,000 population from 2000 to 2006: 59.0. This is less than state average.
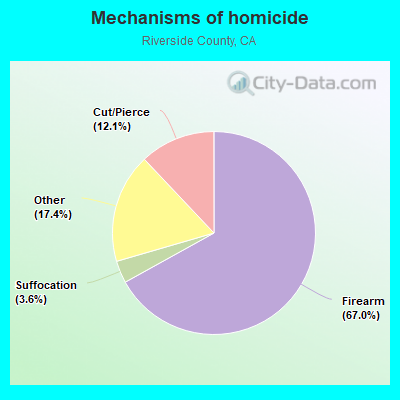
- Firearm - 39.5
- Cut/Pierce - 7.1
- Suffocation - 2.1
- Other - 10.3
Suicides per 1,000,000 population from 2000 to 2006: 96.6. This is less than state average.
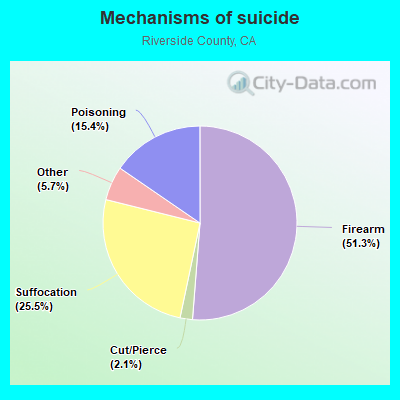
- Firearm - 49.5
- Suffocation - 24.7
- Poisoning - 14.9
- Cut/Pierce - 2.0
- Other - 5.5
Household type by relationship:
Households: 2,473,902- Male householders: 386,900 (68,514 living alone), Female householders: 382,575 (79,591 living alone)
419,304 spouses (409,234 opposite-sex spouses), 55,395 unmarried partners, (51,733 opposite-sex unmarried partners), 827,407 children (776,949 natural, 19,542 adopted, 30,916 stepchildren), 86,039 grandchildren, 47,384 brothers or sisters, 75,062 parents, 2,066 foster children, 77,190 other relatives, 79,938 non-relatives
- In group quarters: 34,642
Size of family households: 188,774 2-persons, 122,442 3-persons, 116,141 4-persons, 80,269 5-persons, 36,409 6-persons, 32,777 7-or-more-persons.
Size of nonfamily households: 148,105 1-person, 36,334 2-persons, 4,936 3-persons, 1,898 4-persons, 618 5-persons, 692 6-persons, 80 7-or-more-persons.
359,772 married couples with children.
134,411 single-parent households (37,786 men, 96,625 women).
57.8% of residents of Riverside speak English at home.
34.6% of residents speak Spanish at home (69% speak English very well, 15% speak English well, 11% speak English not well, 6% don't speak English at all).
2.0% of residents speak other Indo-European language at home (72% speak English very well, 20% speak English well, 6% speak English not well, 2% don't speak English at all).
4.3% of residents speak Asian or Pacific Island language at home (54% speak English very well, 30% speak English well, 13% speak English not well, 3% don't speak English at all).
1.2% of residents speak other language at home (69% speak English very well, 18% speak English well, 9% speak English not well, 5% don't speak English at all).
In fiscal year 2004:
Federal Government expenditure: $7,515,035,000 ($4,015 per capita)
Department of Defense expenditure: $740,431,000
Federal direct payments to individuals for retirement and disability: $3,552,118,000
Federal other direct payments to individuals: $1,893,397,000
Federal direct payments not to individuals: $18,213,000
Federal grants: $1,266,250,000
Federal procurement contracts: $351,317,000 ($257,927,000 Department of Defense)
Federal salaries and wages: $433,740,000 ($181,917,000 Department of Defense)
Federal Government direct loans: $133,708,000
Federal guaranteed/insured loans: $1,407,320,000
Federal Government insurance: $1,071,198,000
Population change from April 1, 2000 to July 1, 2005:
Births: 140,495| Here: | 72 per 1000 residents |
| State: | 77 per 1000 residents |
Deaths: 68,018
| Here: | 35 per 1000 residents |
| State: | 34 per 1000 residents |
Net international migration: +39,801
| Here: | +20 per 1000 residents |
| State: | +39 per 1000 residents |
Net internal migration: +292,038
| Here: | |
| State: |
Total withdrawal of fresh water for public supply: 410.07 millions of gallons per day (74% from ground, 26% from surface)
| Here: | 6.1 |
| State: | 6.0 |
| Here: | 4.3 |
| State: | 3.9 |
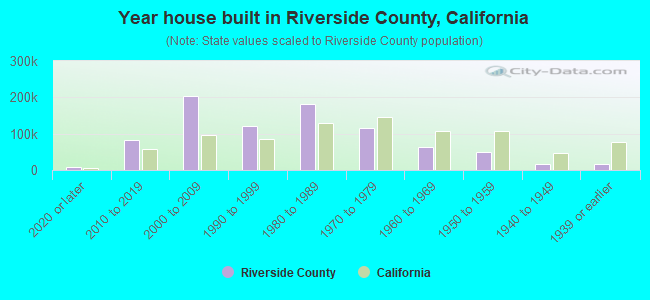
- Year house built in Riverside County, California
- 15,2752020 or later
- 93,6882010 to 2019
- 213,0132000 to 2009
- 108,5171990 to 1999
- 173,8811980 to 1989
- 123,0591970 to 1979
- 59,0541960 to 1969
- 49,2401950 to 1959
- 12,9171940 to 1949
- 19,3171939 or earlier
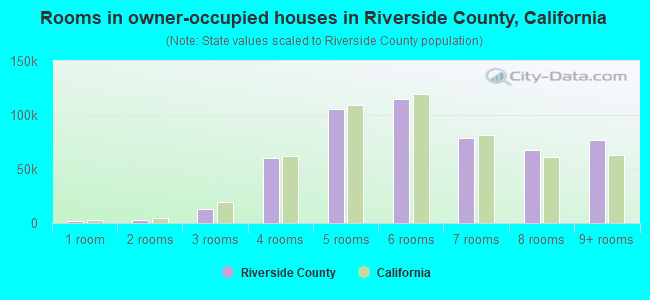
- Rooms in owner-occupied houses in Riverside County, California
- 2,2991 room
- 3,0842 rooms
- 17,6723 rooms
- 58,8374 rooms
- 104,4755 rooms
- 119,4986 rooms
- 82,9037 rooms
- 67,0118 rooms
- 71,7499+ rooms
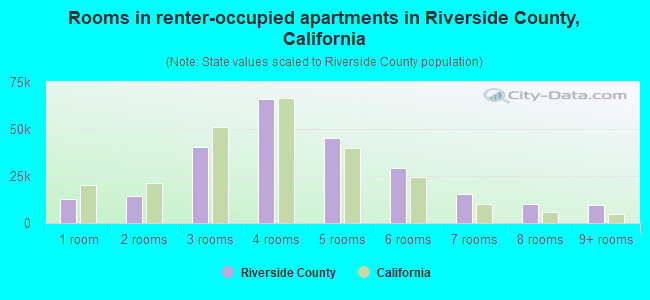
- Rooms in renter-occupied apartments in Riverside County, California
- 11,8441 room
- 15,4292 rooms
- 40,3973 rooms
- 67,4514 rooms
- 41,1505 rooms
- 31,3256 rooms
- 17,7857 rooms
- 8,6948 rooms
- 7,8729+ rooms
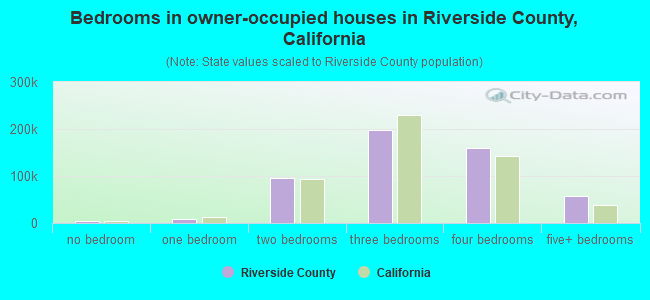
- Bedrooms in owner-occupied houses in Riverside County, California
- 3,694no bedroom
- 10,0931 bedroom
- 88,2312 bedrooms
- 207,8513 bedrooms
- 160,4654 bedrooms
- 57,1945+ bedrooms

- Bedrooms in renter-occupied apartments in Riverside County, California
- 12,837no bedroom
- 44,0371 bedroom
- 88,5722 bedrooms
- 61,0263 bedrooms
- 27,8334 bedrooms
- 7,6425+ bedrooms
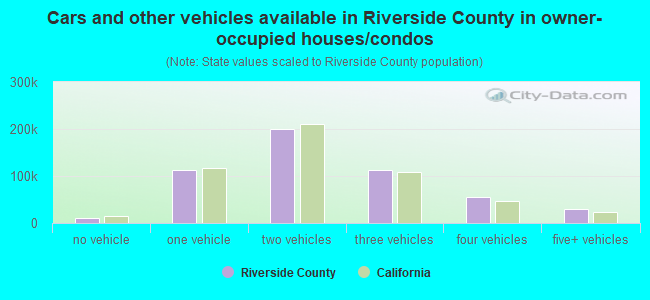
- Cars and other vehicles available in Riverside County in owner-occupied houses/condos
- 15,856no vehicle
- 112,3891 vehicle
- 194,9242 vehicles
- 114,4433 vehicles
- 57,4344 vehicles
- 32,4825+ vehicles
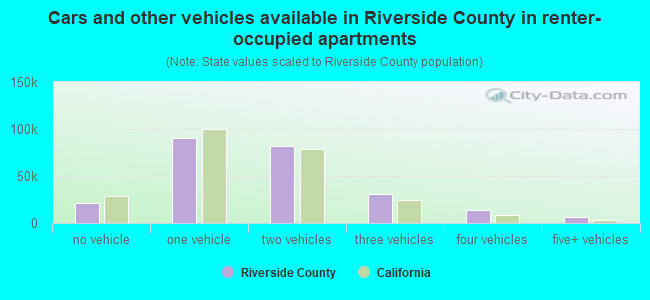
- Cars and other vehicles available in Riverside County in renter-occupied apartments
- 17,498no vehicle
- 88,1101 vehicle
- 79,8382 vehicles
- 35,0733 vehicles
- 16,1204 vehicles
- 5,3085+ vehicles
90.4% of Riverside County residents lived in the same house 1 years ago.
Out of people who lived in different houses, 34% lived in this county.
Out of people who lived in different counties, 82% lived in California.
| Riverside County: | 90.4% |
| State average: | 88.9% |
Place of birth for U.S.-born residents:
- This state: 1,537,087
- Other state: 353,494
- Northeast: 70,708
- Midwest: 114,653
- South: 91,156
- West: 76,977
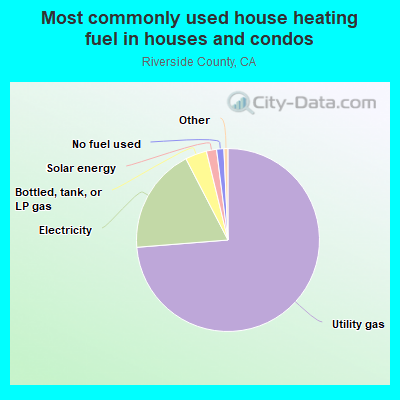
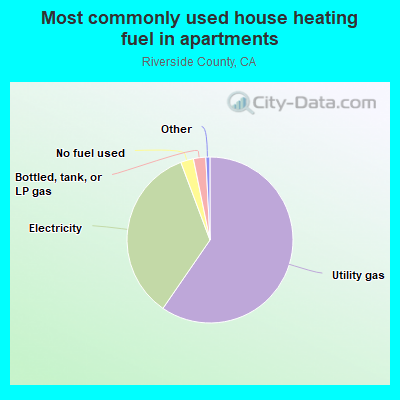
- 74.1%Utility gas
- 18.1%Electricity
- 3.7%Bottled, tank, or LP gas
- 2.1%Solar energy
- 1.0%No fuel used
- 0.6%Wood
- 0.4%Other fuel
- 59.2%Utility gas
- 34.4%Electricity
- 3.0%Bottled, tank, or LP gas
- 2.4%No fuel used
- 0.4%Other fuel
- 0.4%Solar energy
- 0.1%Wood
Private vs. public school enrollment:
| Here: | 7.2% |
| California: | 10.5% |
| Here: | 6.2% |
| California: | 8.5% |
| Here: | 15.3% |
| California: | 15.9% |

Riverside County government finances - Expenditure in 2020:
- Assistance and Subsidies - Public Welfare, Cash Assistance Programs - Other: $433,683,000
Public Welfare, Cash Assistance Programs - Other: $386,695,000
- Bond Funds - Cash and Securities: $261,481,000
Cash and Securities: $3,261,000
- Charges - Other: $693,600,000
Other: $657,635,000
Hospital Public: $617,978,000
Hospital Public: $544,546,000
Solid Waste Management: $108,822,000
Solid Waste Management: $98,874,000
Regular Highways: $46,850,000
Parks and Recreation: $13,862,000
Parks and Recreation: $11,493,000
Regular Highways: $9,240,000
Natural Resources - Other: $8,950,000
Natural Resources - Other: $7,946,000
Housing and Community Development: $4,322,000
Elementary and Secondary Education - Other: $914,000
Elementary and Secondary Education - Other: $886,000
Elementary and Secondary Education School Lunch: $83,000
Sewerage: $65,000
- Construction - General - Other: $63,060,000
Natural Resources - Other: $14,747,000
Regular Highways: $13,090,000
Elementary and Secondary Education: $10,692,000
Natural Resources - Other: $8,662,000
Elementary and Secondary Education: $6,061,000
Parks and Recreation: $3,081,000
Parks and Recreation: $2,391,000
Judicial and Legal Services: $1,176,000
- Current Operations - Health - Other: $727,640,000
Public Welfare - Other: $636,899,000
Health - Other: $608,371,000
Public Welfare - Other: $590,747,000
Hospitals: $544,070,000
Hospitals: $520,660,000
Police Protection: $500,410,000
Police Protection: $445,137,000
Elementary and Secondary Education: $305,068,000
Correctional Institutions: $283,850,000
Elementary and Secondary Education: $281,430,000
Correctional Institutions: $260,195,000
Regular Highways: $259,249,000
Local Fire Protection: $251,134,000
Judicial and Legal Services: $242,694,000
Judicial and Legal Services: $239,176,000
Local Fire Protection: $229,396,000
Regular Highways: $137,305,000
General - Other: $102,954,000
Housing and Community Development: $97,672,000
Solid Waste Management: $95,504,000
Natural Resources - Other: $87,612,000
Solid Waste Management: $81,723,000
Corrections - Other: $80,301,000
Corrections - Other: $78,251,000
Central Staff Services: $62,776,000
General - Other: $57,862,000
Natural Resources - Other: $56,505,000
Financial Administration: $50,635,000
Financial Administration: $50,052,000
Central Staff Services: $39,002,000
Parks and Recreation: $32,868,000
General Public Buildings: $32,193,000
General Public Buildings: $28,820,000
Libraries: $23,766,000
Libraries: $20,822,000
Parks and Recreation: $15,352,000
Protective Inspection and Regulation - Other: $13,011,000
Protective Inspection and Regulation - Other: $7,848,000
Parking Facilities: $2,253,000
Parking Facilities: $1,732,000
Water Utilities: $316,000
Water Utilities: $165,000
Sewerage: $31,000
- Federal Intergovernmental - Other: $203,272,000
Housing and Community Development: $97,128,000
Other: $43,657,000
Highways: $14,359,000
Highways: $13,824,000
Housing and Community Development: $11,992,000
Natural Resources: $5,582,000
General Local Government Support: $3,642,000
General Local Government Support: $3,477,000
Education: $250,000
Natural Resources: $204,000
Education: $28,000
- General - Interest on Debt: $142,248,000
Interest on Debt: $115,435,000
- Intergovernmental to Local - Other - Elementary and Secondary Education: $13,977,000
Other - Natural Resources - Other: $7,019,000
Other - Natural Resources - Other: $5,078,000
Other - Elementary and Secondary Education: $4,529,000
Other - General - Other: $179,000
Other - General - Other: $179,000
Other - Health - Other: $145,000
- Intergovernmental to State - Judicial and Legal Services: $26,364,000
Judicial and Legal Services: $24,966,000
- Local Intergovernmental - Education: $70,671,000
Education: $67,929,000
Other: $46,828,000
Other: $21,259,000
Health and Hospitals: $11,493,000
- Long Term Debt - Outstanding Unspecified Public Purpose: $3,961,539,000
Beginning Outstanding - Unspecified Public Purpose: $3,773,072,000
Outstanding Unspecified Public Purpose: $3,348,072,000
Beginning Outstanding - Unspecified Public Purpose: $2,487,536,000
Issue, Unspecified Public Purpose: $985,053,000
Issue, Unspecified Public Purpose: $537,213,000
Retired Unspecified Public Purpose: $292,787,000
Retired Unspecified Public Purpose: $181,145,000
Outstanding Nonguaranteed - Industrial Revenue: $17,900,000
Retired Nonguaranteed - Public Debt for Private Purpose: $800,000
- Miscellaneous - General Revenue - Other: $60,746,000
Interest Earnings: $51,108,000
Interest Earnings: $37,371,000
Fines and Forfeits: $37,013,000
General Revenue - Other: $31,419,000
Special Assessments: $30,553,000
Fines and Forfeits: $28,593,000
Rents: $28,332,000
Rents: $18,391,000
Special Assessments: $15,924,000
Sale of Property: $6,904,000
Donations From Private Sources: $355,000
Sale of Property: $275,000
- Other Capital Outlay - General - Other: $90,278,000
Hospitals: $49,113,000
Police Protection: $43,109,000
Health - Other: $35,414,000
Correctional Institutions: $25,893,000
Judicial and Legal Services: $18,617,000
Regular Highways: $17,646,000
Public Welfare - Other: $7,111,000
Health - Other: $6,537,000
Central Staff Services: $6,077,000
Regular Highways: $5,636,000
Police Protection: $4,039,000
Parks and Recreation: $3,827,000
Financial Administration: $3,253,000
Local Fire Protection: $2,302,000
Libraries: $2,295,000
Elementary and Secondary Education: $1,939,000
Elementary and Secondary Education: $1,407,000
Air Transportation: $707,000
Public Welfare - Other: $538,000
Parking Facilities: $450,000
Central Staff Services: $375,000
Parks and Recreation: $339,000
General Public Building: $216,000
Corrections - Other: $47,000
Protective Inspection and Regulation - Other: $17,000
- Other Funds - Cash and Securities: $2,077,443,000
Cash and Securities: $1,052,066,000
- Revenue - Water Utilities: $396,000
Water Utilities: $200,000
- Short Term Debt Outstanding - Beginning: $83,462,000
End of Fiscal Year: $80,403,000
- Sinking Funds - Cash and Securities: $154,577,000
Cash and Securities: $14,465,000
- State Intergovernmental - Public Welfare: $1,187,898,000
Public Welfare: $1,081,858,000
Other: $518,512,000
Other: $508,083,000
Health and Hospitals: $368,280,000
Health and Hospitals: $312,277,000
Education: $165,279,000
Education: $144,953,000
Highways: $88,639,000
Highways: $65,206,000
General Local Government Support: $3,816,000
General Local Government Support: $3,214,000
Housing and Community Development: $2,179,000
- Tax - Property: $1,027,410,000
Property: $853,922,000
General Sales and Gross Receipts: $30,745,000
General Sales and Gross Receipts: $27,557,000
Occupation and Business License - Other: $18,618,000
Documentary and Stock Transfer: $16,742,000
Documentary and Stock Transfer: $16,445,000
Occupation and Business License - Other: $13,234,000
Other License: $10,242,000
Other License: $9,827,000
Public Utilities Sales: $7,793,000
Public Utilities Sales: $7,544,000
Other Selective Sales: $3,977,000
Other Selective Sales: $3,320,000
- Total Salaries and Wages: $134,947,000
: $106,894,000
Riverside County government finances - Revenue in 2020:
- Assistance and Subsidies - Public Welfare, Cash Assistance Programs - Other: $433,683,000
Public Welfare, Cash Assistance Programs - Other: $386,695,000
- Bond Funds - Cash and Securities: $261,481,000
Cash and Securities: $3,261,000
- Charges - Other: $693,600,000
Other: $657,635,000
Hospital Public: $617,978,000
Hospital Public: $544,546,000
Solid Waste Management: $108,822,000
Solid Waste Management: $98,874,000
Regular Highways: $46,850,000
Parks and Recreation: $13,862,000
Parks and Recreation: $11,493,000
Regular Highways: $9,240,000
Natural Resources - Other: $8,950,000
Natural Resources - Other: $7,946,000
Housing and Community Development: $4,322,000
Elementary and Secondary Education - Other: $914,000
Elementary and Secondary Education - Other: $886,000
Elementary and Secondary Education School Lunch: $83,000
Sewerage: $65,000
- Construction - General - Other: $63,060,000
Natural Resources - Other: $14,747,000
Regular Highways: $13,090,000
Elementary and Secondary Education: $10,692,000
Natural Resources - Other: $8,662,000
Elementary and Secondary Education: $6,061,000
Parks and Recreation: $3,081,000
Parks and Recreation: $2,391,000
Judicial and Legal Services: $1,176,000
- Current Operations - Health - Other: $727,640,000
Public Welfare - Other: $636,899,000
Health - Other: $608,371,000
Public Welfare - Other: $590,747,000
Hospitals: $544,070,000
Hospitals: $520,660,000
Police Protection: $500,410,000
Police Protection: $445,137,000
Elementary and Secondary Education: $305,068,000
Correctional Institutions: $283,850,000
Elementary and Secondary Education: $281,430,000
Correctional Institutions: $260,195,000
Regular Highways: $259,249,000
Local Fire Protection: $251,134,000
Judicial and Legal Services: $242,694,000
Judicial and Legal Services: $239,176,000
Local Fire Protection: $229,396,000
Regular Highways: $137,305,000
General - Other: $102,954,000
Housing and Community Development: $97,672,000
Solid Waste Management: $95,504,000
Natural Resources - Other: $87,612,000
Solid Waste Management: $81,723,000
Corrections - Other: $80,301,000
Corrections - Other: $78,251,000
Central Staff Services: $62,776,000
General - Other: $57,862,000
Natural Resources - Other: $56,505,000
Financial Administration: $50,635,000
Financial Administration: $50,052,000
Central Staff Services: $39,002,000
Parks and Recreation: $32,868,000
General Public Buildings: $32,193,000
General Public Buildings: $28,820,000
Libraries: $23,766,000
Libraries: $20,822,000
Parks and Recreation: $15,352,000
Protective Inspection and Regulation - Other: $13,011,000
Protective Inspection and Regulation - Other: $7,848,000
Parking Facilities: $2,253,000
Parking Facilities: $1,732,000
Water Utilities: $316,000
Water Utilities: $165,000
Sewerage: $31,000
- Federal Intergovernmental - Other: $203,272,000
Housing and Community Development: $97,128,000
Other: $43,657,000
Highways: $14,359,000
Highways: $13,824,000
Housing and Community Development: $11,992,000
Natural Resources: $5,582,000
General Local Government Support: $3,642,000
General Local Government Support: $3,477,000
Education: $250,000
Natural Resources: $204,000
Education: $28,000
- General - Interest on Debt: $142,248,000
Interest on Debt: $115,435,000
- Intergovernmental to Local - Other - Elementary and Secondary Education: $13,977,000
Other - Natural Resources - Other: $7,019,000
Other - Natural Resources - Other: $5,078,000
Other - Elementary and Secondary Education: $4,529,000
Other - General - Other: $179,000
Other - General - Other: $179,000
Other - Health - Other: $145,000
- Intergovernmental to State - Judicial and Legal Services: $26,364,000
Judicial and Legal Services: $24,966,000
- Local Intergovernmental - Education: $70,671,000
Education: $67,929,000
Other: $46,828,000
Other: $21,259,000
Health and Hospitals: $11,493,000
- Long Term Debt - Outstanding Unspecified Public Purpose: $3,961,539,000
Beginning Outstanding - Unspecified Public Purpose: $3,773,072,000
Outstanding Unspecified Public Purpose: $3,348,072,000
Beginning Outstanding - Unspecified Public Purpose: $2,487,536,000
Issue, Unspecified Public Purpose: $985,053,000
Issue, Unspecified Public Purpose: $537,213,000
Retired Unspecified Public Purpose: $292,787,000
Retired Unspecified Public Purpose: $181,145,000
Outstanding Nonguaranteed - Industrial Revenue: $17,900,000
Retired Nonguaranteed - Public Debt for Private Purpose: $800,000
- Miscellaneous - General Revenue - Other: $60,746,000
Interest Earnings: $51,108,000
Interest Earnings: $37,371,000
Fines and Forfeits: $37,013,000
General Revenue - Other: $31,419,000
Special Assessments: $30,553,000
Fines and Forfeits: $28,593,000
Rents: $28,332,000
Rents: $18,391,000
Special Assessments: $15,924,000
Sale of Property: $6,904,000
Donations From Private Sources: $355,000
Sale of Property: $275,000
- Other Capital Outlay - General - Other: $90,278,000
Hospitals: $49,113,000
Police Protection: $43,109,000
Health - Other: $35,414,000
Correctional Institutions: $25,893,000
Judicial and Legal Services: $18,617,000
Regular Highways: $17,646,000
Public Welfare - Other: $7,111,000
Health - Other: $6,537,000
Central Staff Services: $6,077,000
Regular Highways: $5,636,000
Police Protection: $4,039,000
Parks and Recreation: $3,827,000
Financial Administration: $3,253,000
Local Fire Protection: $2,302,000
Libraries: $2,295,000
Elementary and Secondary Education: $1,939,000
Elementary and Secondary Education: $1,407,000
Air Transportation: $707,000
Public Welfare - Other: $538,000
Parking Facilities: $450,000
Central Staff Services: $375,000
Parks and Recreation: $339,000
General Public Building: $216,000
Corrections - Other: $47,000
Protective Inspection and Regulation - Other: $17,000
- Other Funds - Cash and Securities: $2,077,443,000
Cash and Securities: $1,052,066,000
- Revenue - Water Utilities: $396,000
Water Utilities: $200,000
- Short Term Debt Outstanding - Beginning: $83,462,000
End of Fiscal Year: $80,403,000
- Sinking Funds - Cash and Securities: $154,577,000
Cash and Securities: $14,465,000
- State Intergovernmental - Public Welfare: $1,187,898,000
Public Welfare: $1,081,858,000
Other: $518,512,000
Other: $508,083,000
Health and Hospitals: $368,280,000
Health and Hospitals: $312,277,000
Education: $165,279,000
Education: $144,953,000
Highways: $88,639,000
Highways: $65,206,000
General Local Government Support: $3,816,000
General Local Government Support: $3,214,000
Housing and Community Development: $2,179,000
- Tax - Property: $1,027,410,000
Property: $853,922,000
General Sales and Gross Receipts: $30,745,000
General Sales and Gross Receipts: $27,557,000
Occupation and Business License - Other: $18,618,000
Documentary and Stock Transfer: $16,742,000
Documentary and Stock Transfer: $16,445,000
Occupation and Business License - Other: $13,234,000
Other License: $10,242,000
Other License: $9,827,000
Public Utilities Sales: $7,793,000
Public Utilities Sales: $7,544,000
Other Selective Sales: $3,977,000
Other Selective Sales: $3,320,000
- Total Salaries and Wages: $134,947,000
: $106,894,000
Riverside County government finances - Debt in 2020:
- Assistance and Subsidies - Public Welfare, Cash Assistance Programs - Other: $433,683,000
Public Welfare, Cash Assistance Programs - Other: $386,695,000
- Bond Funds - Cash and Securities: $261,481,000
Cash and Securities: $3,261,000
- Charges - Other: $693,600,000
Other: $657,635,000
Hospital Public: $617,978,000
Hospital Public: $544,546,000
Solid Waste Management: $108,822,000
Solid Waste Management: $98,874,000
Regular Highways: $46,850,000
Parks and Recreation: $13,862,000
Parks and Recreation: $11,493,000
Regular Highways: $9,240,000
Natural Resources - Other: $8,950,000
Natural Resources - Other: $7,946,000
Housing and Community Development: $4,322,000
Elementary and Secondary Education - Other: $914,000
Elementary and Secondary Education - Other: $886,000
Elementary and Secondary Education School Lunch: $83,000
Sewerage: $65,000
- Construction - General - Other: $63,060,000
Natural Resources - Other: $14,747,000
Regular Highways: $13,090,000
Elementary and Secondary Education: $10,692,000
Natural Resources - Other: $8,662,000
Elementary and Secondary Education: $6,061,000
Parks and Recreation: $3,081,000
Parks and Recreation: $2,391,000
Judicial and Legal Services: $1,176,000
- Current Operations - Health - Other: $727,640,000
Public Welfare - Other: $636,899,000
Health - Other: $608,371,000
Public Welfare - Other: $590,747,000
Hospitals: $544,070,000
Hospitals: $520,660,000
Police Protection: $500,410,000
Police Protection: $445,137,000
Elementary and Secondary Education: $305,068,000
Correctional Institutions: $283,850,000
Elementary and Secondary Education: $281,430,000
Correctional Institutions: $260,195,000
Regular Highways: $259,249,000
Local Fire Protection: $251,134,000
Judicial and Legal Services: $242,694,000
Judicial and Legal Services: $239,176,000
Local Fire Protection: $229,396,000
Regular Highways: $137,305,000
General - Other: $102,954,000
Housing and Community Development: $97,672,000
Solid Waste Management: $95,504,000
Natural Resources - Other: $87,612,000
Solid Waste Management: $81,723,000
Corrections - Other: $80,301,000
Corrections - Other: $78,251,000
Central Staff Services: $62,776,000
General - Other: $57,862,000
Natural Resources - Other: $56,505,000
Financial Administration: $50,635,000
Financial Administration: $50,052,000
Central Staff Services: $39,002,000
Parks and Recreation: $32,868,000
General Public Buildings: $32,193,000
General Public Buildings: $28,820,000
Libraries: $23,766,000
Libraries: $20,822,000
Parks and Recreation: $15,352,000
Protective Inspection and Regulation - Other: $13,011,000
Protective Inspection and Regulation - Other: $7,848,000
Parking Facilities: $2,253,000
Parking Facilities: $1,732,000
Water Utilities: $316,000
Water Utilities: $165,000
Sewerage: $31,000
- Federal Intergovernmental - Other: $203,272,000
Housing and Community Development: $97,128,000
Other: $43,657,000
Highways: $14,359,000
Highways: $13,824,000
Housing and Community Development: $11,992,000
Natural Resources: $5,582,000
General Local Government Support: $3,642,000
General Local Government Support: $3,477,000
Education: $250,000
Natural Resources: $204,000
Education: $28,000
- General - Interest on Debt: $142,248,000
Interest on Debt: $115,435,000
- Intergovernmental to Local - Other - Elementary and Secondary Education: $13,977,000
Other - Natural Resources - Other: $7,019,000
Other - Natural Resources - Other: $5,078,000
Other - Elementary and Secondary Education: $4,529,000
Other - General - Other: $179,000
Other - General - Other: $179,000
Other - Health - Other: $145,000
- Intergovernmental to State - Judicial and Legal Services: $26,364,000
Judicial and Legal Services: $24,966,000
- Local Intergovernmental - Education: $70,671,000
Education: $67,929,000
Other: $46,828,000
Other: $21,259,000
Health and Hospitals: $11,493,000
- Long Term Debt - Outstanding Unspecified Public Purpose: $3,961,539,000
Beginning Outstanding - Unspecified Public Purpose: $3,773,072,000
Outstanding Unspecified Public Purpose: $3,348,072,000
Beginning Outstanding - Unspecified Public Purpose: $2,487,536,000
Issue, Unspecified Public Purpose: $985,053,000
Issue, Unspecified Public Purpose: $537,213,000
Retired Unspecified Public Purpose: $292,787,000
Retired Unspecified Public Purpose: $181,145,000
Outstanding Nonguaranteed - Industrial Revenue: $17,900,000
Retired Nonguaranteed - Public Debt for Private Purpose: $800,000
- Miscellaneous - General Revenue - Other: $60,746,000
Interest Earnings: $51,108,000
Interest Earnings: $37,371,000
Fines and Forfeits: $37,013,000
General Revenue - Other: $31,419,000
Special Assessments: $30,553,000
Fines and Forfeits: $28,593,000
Rents: $28,332,000
Rents: $18,391,000
Special Assessments: $15,924,000
Sale of Property: $6,904,000
Donations From Private Sources: $355,000
Sale of Property: $275,000
- Other Capital Outlay - General - Other: $90,278,000
Hospitals: $49,113,000
Police Protection: $43,109,000
Health - Other: $35,414,000
Correctional Institutions: $25,893,000
Judicial and Legal Services: $18,617,000
Regular Highways: $17,646,000
Public Welfare - Other: $7,111,000
Health - Other: $6,537,000
Central Staff Services: $6,077,000
Regular Highways: $5,636,000
Police Protection: $4,039,000
Parks and Recreation: $3,827,000
Financial Administration: $3,253,000
Local Fire Protection: $2,302,000
Libraries: $2,295,000
Elementary and Secondary Education: $1,939,000
Elementary and Secondary Education: $1,407,000
Air Transportation: $707,000
Public Welfare - Other: $538,000
Parking Facilities: $450,000
Central Staff Services: $375,000
Parks and Recreation: $339,000
General Public Building: $216,000
Corrections - Other: $47,000
Protective Inspection and Regulation - Other: $17,000
- Other Funds - Cash and Securities: $2,077,443,000
Cash and Securities: $1,052,066,000
- Revenue - Water Utilities: $396,000
Water Utilities: $200,000
- Short Term Debt Outstanding - Beginning: $83,462,000
End of Fiscal Year: $80,403,000
- Sinking Funds - Cash and Securities: $154,577,000
Cash and Securities: $14,465,000
- State Intergovernmental - Public Welfare: $1,187,898,000
Public Welfare: $1,081,858,000
Other: $518,512,000
Other: $508,083,000
Health and Hospitals: $368,280,000
Health and Hospitals: $312,277,000
Education: $165,279,000
Education: $144,953,000
Highways: $88,639,000
Highways: $65,206,000
General Local Government Support: $3,816,000
General Local Government Support: $3,214,000
Housing and Community Development: $2,179,000
- Tax - Property: $1,027,410,000
Property: $853,922,000
General Sales and Gross Receipts: $30,745,000
General Sales and Gross Receipts: $27,557,000
Occupation and Business License - Other: $18,618,000
Documentary and Stock Transfer: $16,742,000
Documentary and Stock Transfer: $16,445,000
Occupation and Business License - Other: $13,234,000
Other License: $10,242,000
Other License: $9,827,000
Public Utilities Sales: $7,793,000
Public Utilities Sales: $7,544,000
Other Selective Sales: $3,977,000
Other Selective Sales: $3,320,000
- Total Salaries and Wages: $134,947,000
: $106,894,000
Riverside County government finances - Cash and Securities in 2020:
- Assistance and Subsidies - Public Welfare, Cash Assistance Programs - Other: $433,683,000
Public Welfare, Cash Assistance Programs - Other: $386,695,000
- Bond Funds - Cash and Securities: $261,481,000
Cash and Securities: $3,261,000
- Charges - Other: $693,600,000
Other: $657,635,000
Hospital Public: $617,978,000
Hospital Public: $544,546,000
Solid Waste Management: $108,822,000
Solid Waste Management: $98,874,000
Regular Highways: $46,850,000
Parks and Recreation: $13,862,000
Parks and Recreation: $11,493,000
Regular Highways: $9,240,000
Natural Resources - Other: $8,950,000
Natural Resources - Other: $7,946,000
Housing and Community Development: $4,322,000
Elementary and Secondary Education - Other: $914,000
Elementary and Secondary Education - Other: $886,000
Elementary and Secondary Education School Lunch: $83,000
Sewerage: $65,000
- Construction - General - Other: $63,060,000
Natural Resources - Other: $14,747,000
Regular Highways: $13,090,000
Elementary and Secondary Education: $10,692,000
Natural Resources - Other: $8,662,000
Elementary and Secondary Education: $6,061,000
Parks and Recreation: $3,081,000
Parks and Recreation: $2,391,000
Judicial and Legal Services: $1,176,000
- Current Operations - Health - Other: $727,640,000
Public Welfare - Other: $636,899,000
Health - Other: $608,371,000
Public Welfare - Other: $590,747,000
Hospitals: $544,070,000
Hospitals: $520,660,000
Police Protection: $500,410,000
Police Protection: $445,137,000
Elementary and Secondary Education: $305,068,000
Correctional Institutions: $283,850,000
Elementary and Secondary Education: $281,430,000
Correctional Institutions: $260,195,000
Regular Highways: $259,249,000
Local Fire Protection: $251,134,000
Judicial and Legal Services: $242,694,000
Judicial and Legal Services: $239,176,000
Local Fire Protection: $229,396,000
Regular Highways: $137,305,000
General - Other: $102,954,000
Housing and Community Development: $97,672,000
Solid Waste Management: $95,504,000
Natural Resources - Other: $87,612,000
Solid Waste Management: $81,723,000
Corrections - Other: $80,301,000
Corrections - Other: $78,251,000
Central Staff Services: $62,776,000
General - Other: $57,862,000
Natural Resources - Other: $56,505,000
Financial Administration: $50,635,000
Financial Administration: $50,052,000
Central Staff Services: $39,002,000
Parks and Recreation: $32,868,000
General Public Buildings: $32,193,000
General Public Buildings: $28,820,000
Libraries: $23,766,000
Libraries: $20,822,000
Parks and Recreation: $15,352,000
Protective Inspection and Regulation - Other: $13,011,000
Protective Inspection and Regulation - Other: $7,848,000
Parking Facilities: $2,253,000
Parking Facilities: $1,732,000
Water Utilities: $316,000
Water Utilities: $165,000
Sewerage: $31,000
- Federal Intergovernmental - Other: $203,272,000
Housing and Community Development: $97,128,000
Other: $43,657,000
Highways: $14,359,000
Highways: $13,824,000
Housing and Community Development: $11,992,000
Natural Resources: $5,582,000
General Local Government Support: $3,642,000
General Local Government Support: $3,477,000
Education: $250,000
Natural Resources: $204,000
Education: $28,000
- General - Interest on Debt: $142,248,000
Interest on Debt: $115,435,000
- Intergovernmental to Local - Other - Elementary and Secondary Education: $13,977,000
Other - Natural Resources - Other: $7,019,000
Other - Natural Resources - Other: $5,078,000
Other - Elementary and Secondary Education: $4,529,000
Other - General - Other: $179,000
Other - General - Other: $179,000
Other - Health - Other: $145,000
- Intergovernmental to State - Judicial and Legal Services: $26,364,000
Judicial and Legal Services: $24,966,000
- Local Intergovernmental - Education: $70,671,000
Education: $67,929,000
Other: $46,828,000
Other: $21,259,000
Health and Hospitals: $11,493,000
- Long Term Debt - Outstanding Unspecified Public Purpose: $3,961,539,000
Beginning Outstanding - Unspecified Public Purpose: $3,773,072,000
Outstanding Unspecified Public Purpose: $3,348,072,000
Beginning Outstanding - Unspecified Public Purpose: $2,487,536,000
Issue, Unspecified Public Purpose: $985,053,000
Issue, Unspecified Public Purpose: $537,213,000
Retired Unspecified Public Purpose: $292,787,000
Retired Unspecified Public Purpose: $181,145,000
Outstanding Nonguaranteed - Industrial Revenue: $17,900,000
Retired Nonguaranteed - Public Debt for Private Purpose: $800,000
- Miscellaneous - General Revenue - Other: $60,746,000
Interest Earnings: $51,108,000
Interest Earnings: $37,371,000
Fines and Forfeits: $37,013,000
General Revenue - Other: $31,419,000
Special Assessments: $30,553,000
Fines and Forfeits: $28,593,000
Rents: $28,332,000
Rents: $18,391,000
Special Assessments: $15,924,000
Sale of Property: $6,904,000
Donations From Private Sources: $355,000
Sale of Property: $275,000
- Other Capital Outlay - General - Other: $90,278,000
Hospitals: $49,113,000
Police Protection: $43,109,000
Health - Other: $35,414,000
Correctional Institutions: $25,893,000
Judicial and Legal Services: $18,617,000
Regular Highways: $17,646,000
Public Welfare - Other: $7,111,000
Health - Other: $6,537,000
Central Staff Services: $6,077,000
Regular Highways: $5,636,000
Police Protection: $4,039,000
Parks and Recreation: $3,827,000
Financial Administration: $3,253,000
Local Fire Protection: $2,302,000
Libraries: $2,295,000
Elementary and Secondary Education: $1,939,000
Elementary and Secondary Education: $1,407,000
Air Transportation: $707,000
Public Welfare - Other: $538,000
Parking Facilities: $450,000
Central Staff Services: $375,000
Parks and Recreation: $339,000
General Public Building: $216,000
Corrections - Other: $47,000
Protective Inspection and Regulation - Other: $17,000
- Other Funds - Cash and Securities: $2,077,443,000
Cash and Securities: $1,052,066,000
- Revenue - Water Utilities: $396,000
Water Utilities: $200,000
- Short Term Debt Outstanding - Beginning: $83,462,000
End of Fiscal Year: $80,403,000
- Sinking Funds - Cash and Securities: $154,577,000
Cash and Securities: $14,465,000
- State Intergovernmental - Public Welfare: $1,187,898,000
Public Welfare: $1,081,858,000
Other: $518,512,000
Other: $508,083,000
Health and Hospitals: $368,280,000
Health and Hospitals: $312,277,000
Education: $165,279,000
Education: $144,953,000
Highways: $88,639,000
Highways: $65,206,000
General Local Government Support: $3,816,000
General Local Government Support: $3,214,000
Housing and Community Development: $2,179,000
- Tax - Property: $1,027,410,000
Property: $853,922,000
General Sales and Gross Receipts: $30,745,000
General Sales and Gross Receipts: $27,557,000
Occupation and Business License - Other: $18,618,000
Documentary and Stock Transfer: $16,742,000
Documentary and Stock Transfer: $16,445,000
Occupation and Business License - Other: $13,234,000
Other License: $10,242,000
Other License: $9,827,000
Public Utilities Sales: $7,793,000
Public Utilities Sales: $7,544,000
Other Selective Sales: $3,977,000
Other Selective Sales: $3,320,000
- Total Salaries and Wages: $134,947,000
: $106,894,000
Supplemental Security Income (SSI) in 2006:
- Total number of recipients: 51,305
- Number of aged recipients: 12,814
- Number of blind and disabled recipients: 38,491
- Number of recipients under 18: 5,392
- Number of recipients between 18 and 64: 26,837
- Number of recipients older than 64: 19,076
- Number of recipients also receiving OASDI: 23,873
- Amount of payments (thousands of dollars): 28,352
| Home Mortgage Disclosure Act Aggregated Statistics For Year 2009 (Based on 341 full tracts) | ||||||||||||||
| A) FHA, FSA/RHS & VA Home Purchase Loans | B) Conventional Home Purchase Loans | C) Refinancings | D) Home Improvement Loans | E) Loans on Dwellings For 5+ Families | F) Non-occupant Loans on < 5 Family Dwellings (A B C & D) | G) Loans On Manufactured Home Dwelling (A B C & D) | ||||||||
|---|---|---|---|---|---|---|---|---|---|---|---|---|---|---|
| Number | Average Value | Number | Average Value | Number | Average Value | Number | Average Value | Number | Average Value | Number | Average Value | Number | Average Value | |
| LOANS ORIGINATED | 20,116 | $201,828 | 13,153 | $197,249 | 21,603 | $241,887 | 918 | $126,838 | 27 | $4,463,889 | 7,424 | $207,753 | 670 | $149,415 |
| APPLICATIONS APPROVED, NOT ACCEPTED | 1,732 | $202,629 | 1,866 | $208,459 | 3,064 | $241,970 | 213 | $78,174 | 4 | $16,786,750 | 999 | $203,032 | 178 | $114,028 |
| APPLICATIONS DENIED | 4,197 | $204,074 | 3,606 | $207,594 | 11,618 | $256,077 | 1,050 | $82,231 | 17 | $733,706 | 2,868 | $220,667 | 589 | $110,428 |
| APPLICATIONS WITHDRAWN | 2,887 | $208,814 | 2,467 | $202,570 | 6,504 | $251,884 | 387 | $124,202 | 9 | $3,404,333 | 1,513 | $213,469 | 194 | $153,727 |
| FILES CLOSED FOR INCOMPLETENESS | 712 | $205,029 | 589 | $213,136 | 1,835 | $245,650 | 122 | $139,721 | 1 | $497,000 | 389 | $192,342 | 51 | $131,275 |
| Private Mortgage Insurance Companies Aggregated Statistics For Year 2009 (Based on 311 full tracts) | ||||||||
| A) Conventional Home Purchase Loans | B) Refinancings | C) Non-occupant Loans on < 5 Family Dwellings (A & B) | D) Loans On Manufactured Home Dwelling (A & B) | |||||
|---|---|---|---|---|---|---|---|---|
| Number | Average Value | Number | Average Value | Number | Average Value | Number | Average Value | |
| LOANS ORIGINATED | 1,325 | $217,635 | 183 | $273,137 | 69 | $200,232 | 0 | $0 |
| APPLICATIONS APPROVED, NOT ACCEPTED | 827 | $231,770 | 152 | $305,691 | 46 | $222,522 | 2 | $118,000 |
| APPLICATIONS DENIED | 321 | $222,075 | 87 | $266,713 | 19 | $240,000 | 0 | $0 |
| APPLICATIONS WITHDRAWN | 117 | $220,103 | 29 | $279,448 | 9 | $173,444 | 0 | $0 |
| FILES CLOSED FOR INCOMPLETENESS | 138 | $267,065 | 24 | $307,542 | 13 | $239,385 | 0 | $0 |
| Most common first names in Riverside County, CA among deceased individuals | ||
| Name | Count | Lived (average) |
|---|---|---|
| John | 5,941 | 75.2 years |
| Robert | 5,325 | 73.0 years |
| William | 5,228 | 75.6 years |
| Mary | 4,736 | 79.8 years |
| James | 4,386 | 72.7 years |
| Charles | 3,114 | 75.6 years |
| George | 2,947 | 76.7 years |
| Dorothy | 2,494 | 79.9 years |
| Helen | 2,492 | 81.7 years |
| Richard | 2,487 | 70.4 years |
| Most common last names in Riverside County, CA among deceased individuals | ||
| Last name | Count | Lived (average) |
|---|---|---|
| Smith | 2,197 | 76.1 years |
| Johnson | 1,772 | 75.9 years |
| Brown | 1,226 | 75.5 years |
| Miller | 1,186 | 76.9 years |
| Williams | 1,171 | 74.5 years |
| Jones | 1,139 | 75.6 years |
| Davis | 966 | 75.8 years |
| Anderson | 872 | 77.9 years |
| Wilson | 807 | 77.6 years |
| Moore | 707 | 76.3 years |
| Businesses in Riverside County, CA | ||||
| Name | Count | Name | Count | |
|---|---|---|---|---|
| 24 Hour Fitness | 9 | JoS. A. Bank | 2 | |
| 7-Eleven | 41 | Johnny Rockets | 1 | |
| 99 Cents Only Stores | 17 | Jones New York | 45 | |
| ALDO | 3 | Journeys | 4 | |
| AMF Bowling | 2 | Just Tires | 5 | |
| AT&T | 25 | Justice | 5 | |
| Abercrombie & Fitch | 2 | KFC | 29 | |
| Ace Hardware | 11 | Kincaid | 2 | |
| Aeropostale | 4 | Kmart | 10 | |
| Albertsons | 20 | Knights Inn | 2 | |
| American Eagle Outfitters | 4 | Kohl's | 11 | |
| Ann Taylor | 5 | Kroger | 30 | |
| Apple Store | 2 | LA Fitness | 9 | |
| Applebee's | 13 | La Quinta | 2 | |
| Arby's | 11 | La-Z-Boy | 4 | |
| Ashley Furniture | 2 | Lane Bryant | 6 | |
| Audi | 2 | Lane Furniture | 11 | |
| AutoZone | 38 | LensCrafters | 6 | |
| Avenue | 3 | Levi Strauss & Co. | 2 | |
| BMW | 3 | Little Caesars Pizza | 22 | |
| Baja Fresh Mexican Grill | 4 | Long John Silver's | 5 | |
| Bakers | 1 | Lowe's | 13 | |
| Bally Total Fitness | 1 | Macy's | 5 | |
| Banana Republic | 3 | Marriott | 15 | |
| Barnes & Noble | 4 | Marshalls | 8 | |
| Baskin-Robbins | 17 | MasterBrand Cabinets | 41 | |
| Bath & Body Works | 8 | Mazda | 4 | |
| Bebe | 1 | McDonald's | 67 | |
| Bed Bath & Beyond | 11 | Men's Wearhouse | 4 | |
| Ben & Jerry's | 2 | Motel 6 | 14 | |
| Bentleymotors.Com | 1 | Motherhood Maternity | 9 | |
| Best Western | 11 | New Balance | 19 | |
| Big O Tires | 9 | New York & Co | 5 | |
| Blockbuster | 14 | Nike | 70 | |
| Brooks Brothers | 2 | Nissan | 7 | |
| Brookstone | 1 | Nordstrom | 1 | |
| Brunswick Bowling & Billiards | 3 | Office Depot | 8 | |
| Budget Car Rental | 2 | OfficeMax | 7 | |
| Buffalo Wild Wings | 6 | Old Navy | 6 | |
| Burger King | 25 | Olive Garden | 3 | |
| Buybuy BABY | 1 | On The Border | 2 | |
| CVS | 48 | Outback | 4 | |
| Cache | 2 | Outback Steakhouse | 4 | |
| Carl\s Jr. | 61 | Pac Sun | 7 | |
| Casual Male XL | 4 | Panda Express | 31 | |
| Catherines | 1 | Panera Bread | 6 | |
| Charlotte Russe | 5 | Papa John's Pizza | 8 | |
| Chevrolet | 9 | Payless | 33 | |
| Chick-Fil-A | 5 | Penske | 17 | |
| Chico's | 6 | PetSmart | 10 | |
| Chipotle | 9 | Pier 1 Imports | 6 | |
| Chuck E. Cheese's | 5 | Pizza Hut | 35 | |
| Church's Chicken | 4 | Popeyes | 7 | |
| Cinnabon | 3 | Pottery Barn | 2 | |
| Circle K | 40 | Qdoba Mexican Grill | 1 | |
| Clarion | 1 | Quality | 5 | |
| Clarks | 2 | Quiznos | 21 | |
| Cold Stone Creamery | 19 | RadioShack | 31 | |
| Coldwater Creek | 4 | Ramada | 2 | |
| ColorTyme | 2 | Red Lobster | 2 | |
| Comfort Inn | 4 | Red Robin | 6 | |
| Comfort Suites | 1 | Red Roof Inn | 1 | |
| Costco | 6 | Rite Aid | 41 | |
| Curves | 20 | Rodeway Inn | 1 | |
| DHL | 20 | Rue21 | 2 | |
| Dairy Queen | 16 | Ryder Rental & Truck Leasing | 1 | |
| Days Inn | 3 | SAS Shoes | 4 | |
| Decora Cabinetry | 13 | SONIC Drive-In | 3 | |
| Dennys | 30 | Safeway | 10 | |
| Discount Tire | 11 | Saks Fifth Avenue | 1 | |
| Domino's Pizza | 25 | Sam's Club | 4 | |
| DressBarn | 5 | Sears | 23 | |
| Dressbarn | 4 | Sephora | 3 | |
| Econo Lodge | 2 | Skechers USA | 6 | |
| Eddie Bauer | 1 | Soma Intimates | 2 | |
| El Pollo Loco | 22 | Spencer Gifts | 4 | |
| Ethan Allen | 2 | Sprint Nextel | 19 | |
| Express | 5 | Staples | 16 | |
| Extended Stay America | 2 | Starbucks | 112 | |
| Famous Footwear | 12 | Subaru | 3 | |
| Fashion Bug | 3 | Subway | 75 | |
| FedEx | 212 | Super 8 | 5 | |
| Finish Line | 1 | T-Mobile | 84 | |
| Firestone Complete Auto Care | 9 | T.G.I. Driday's | 2 | |
| Foot Locker | 5 | T.J.Maxx | 5 | |
| Forever 21 | 5 | Taco Bell | 34 | |
| Fredericks Of Hollywood | 2 | Talbots | 1 | |
| GNC | 34 | Target | 17 | |
| GameStop | 25 | The Cheesecake Factory | 2 | |
| Gap | 4 | The Room Place | 6 | |
| Goodwill | 13 | Torrid | 3 | |
| Gymboree | 6 | Toyota | 6 | |
| H&M | 1 | Toys"R"Us | 11 | |
| H&R Block | 51 | Trader Joe's | 6 | |
| Haagen-Dazs | 3 | Travelodge | 5 | |
| Haworth | 1 | True Value | 10 | |
| Hilton | 10 | U-Haul | 79 | |
| Hobby Lobby | 1 | UPS | 190 | |
| Holiday Inn | 12 | Vans | 25 | |
| Hollister Co. | 4 | Verizon Wireless | 30 | |
| Home Depot | 16 | Victoria's Secret | 5 | |
| HomeTown Buffet | 5 | Volkswagen | 6 | |
| Honda | 7 | Vons | 16 | |
| Hot Topic | 4 | Walgreens | 44 | |
| Howard Johnson | 1 | Walmart | 16 | |
| Hyatt | 3 | Wendy's | 21 | |
| IHOP | 15 | Westin | 3 | |
| IZOD | 1 | Wet Seal | 4 | |
| J.Crew | 2 | World Gym | 5 | |
| JCPenney | 5 | YMCA | 5 | |
| Jack In The Box | 49 | Z Gallerie | 1 | |
| Jamba Juice | 6 | |||
Riverside County on our top lists:
- #3 on the list of "Top 101 counties with the highest lead air pollution readings in 2012 (µg/m3)"
- #4 on the list of "Top 101 counties with the highest ground withdrawal of fresh water for public supply (pop. 50,000+)"
- #4 on the list of "Top 101 counties with the highest ground withdrawal of fresh water for public supply"
- #10 on the list of "Top 101 counties with the highest total withdrawal of fresh water for public supply (pop. 50,000+)"
- #11 on the list of "Top 101 counties with the most Catholic adherents"
- #11 on the list of "Top 101 counties with the highest total withdrawal of fresh water for public supply"
- #11 on the list of "Top 101 counties with the most Catholic adherents (pop. 50,000+)"
- #12 on the list of "Top 101 counties with the highest carbon monoxide air pollution readings in 2012 (ppm)"
- #12 on the list of "Top 101 counties with the most Evangelical Protestant congregations (pop. 50,000+)"
- #12 on the list of "Top 101 counties with the most Evangelical Protestant congregations"
- #16 on the list of "Top 101 counties with the most Evangelical Protestant adherents (pop. 50,000+)"
- #16 on the list of "Top 101 counties with the most Evangelical Protestant adherents"
- #19 on the list of "Top 101 counties with the highest Particulate Matter (PM10) Annual air pollution readings in 2012 (µg/m3)"
- #19 on the list of "Top 101 counties with the largest decrease in the number of deaths per 1000 residents 2000-2006 to 2007-2013 (pop. 50,000+)"
- #24 on the list of "Top 101 counties with the most Other congregations (pop. 50,000+)"
- #24 on the list of "Top 101 counties with the most Other congregations"
- #25 on the list of "Top 101 counties with the lowest lead air pollution readings in 2012 (µg/m3)"
- #29 on the list of "Top 101 counties with the most Other adherents"
- #29 on the list of "Top 101 counties with the most Other adherents (pop. 50,000+)"
- #29 on the list of "Top 101 counties with the highest percentage of residents that drank alcohol in the past 30 days"