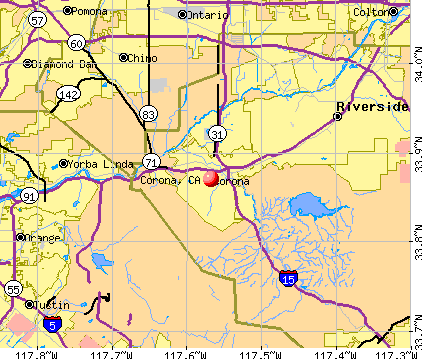
Corona, California
Corona: Cleveland National Forest on southern city limits of Corona
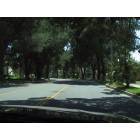
Corona: border ave going south
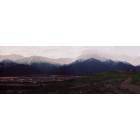
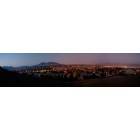
Corona: City down below - Corona, CA - July 2006
Corona: Dos Lagos Bridge, Corona, CA
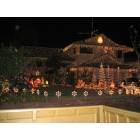
Corona: House at Christmas
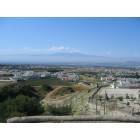
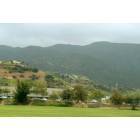
Corona: Corona Hills Looking East
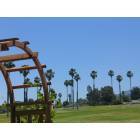
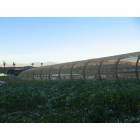
Corona: Local golf course
Corona: Corona in march
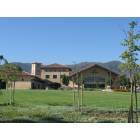
Corona: Calvary Chapel Corona
Corona: Corona, CA (Nice view)
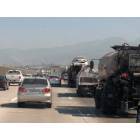
Corona: Friday rush hour - I-15 southbound near Highway 91
- see
21
more - add
your
Submit your own pictures of this city and show them to the world
- OSM Map
- General Map
- Google Map
- MSN Map
Population change since 2000: +27.7%
| Males: 81,271 | |
| Females: 78,296 |
| Median resident age: | 35.3 years |
| California median age: | 37.9 years |
Zip codes: 92503, 92860, 92879, 92881, 92882, 92883.
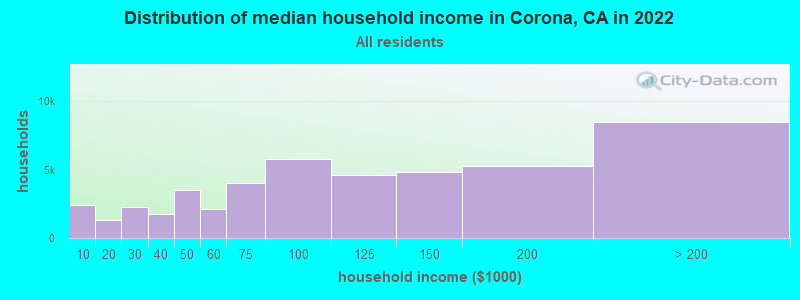
Corona Zip Code Map| Corona: | $99,953 |
| CA: | $91,551 |
Estimated per capita income in 2022: $36,725 (it was $21,001 in 2000)
Corona city income, earnings, and wages data
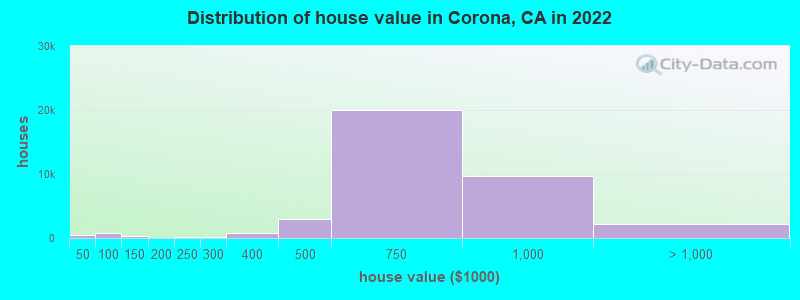
Estimated median house or condo value in 2022: $668,600 (it was $190,900 in 2000)
| Corona: | $668,600 |
| CA: | $715,900 |
Mean prices in 2022: all housing units: $734,154; detached houses: $786,979; townhouses or other attached units: $524,696; in 2-unit structures: $352,216; in 3-to-4-unit structures: $340,435; in 5-or-more-unit structures: $323,352; mobile homes: $175,783
Median gross rent in 2022: $2,195.
(6.8% for White Non-Hispanic residents, 4.3% for Black residents, 8.2% for Hispanic or Latino residents, 21.6% for American Indian residents, 7.4% for Native Hawaiian and other Pacific Islander residents, 11.8% for other race residents, 8.4% for two or more races residents)
Detailed information about poverty and poor residents in Corona, CA


Compare current foreclosures in Corona, CA:
| Photo | Address | Area | Beds / Baths | Price | Details |
|---|---|---|---|---|---|

|
#1
View Ln
Corona, CA 92881
|
2,420 sq. feet
|
3 baths 3 beds |
$30,425
|
show details |

|
#2
Cirrus Cir
Corona, CA 92883
|
3,543 sq. feet
|
2 baths 5 beds |
show details | |

|
#3
S Buena Vista Ave
Corona, CA 92882
|
3,099 sq. feet
|
2 baths 4 beds |
show details | |

|
#4
Mount Elena Cir
Corona, CA 92882
|
2,715 sq. feet
|
2 baths 5 beds |
show details | |

|
#5
Lumerina St
Corona, CA 92883
|
3,675 sq. feet
|
3 baths 3 beds |
show details | |

|
#6
Quartz Cir
Corona, CA 92882
|
3,181 sq. feet
|
4 baths 5 beds |
show details | |

|
#7
Paseo Grande
Corona, CA 92882
|
2,849 sq. feet
|
2 baths 3 beds |
show details | |

|
#8
Belvedere Way
Corona, CA 92882
|
2,113 sq. feet
|
3 baths 4 beds |
show details | |

|
#9
Sanctuary Dr
Corona, CA 92883
|
4,767 sq. feet
|
3 baths 4 beds |
show details | |

|
#10
Independence Way
Corona, CA 92882
|
2,040 sq. feet
|
2 baths 4 beds |
show details |
| Photo | Address | Area | Beds / Baths | Price | Details |
|---|---|---|---|---|---|

|
#11
Prescott Cir
Corona, CA 92881
|
1,853 sq. feet
|
2 baths 4 beds |
show details | |

|
#12
Vista Del Cerro Dr Unit 208
Corona, CA 92879
|
1,063 sq. feet
|
2 baths 2 beds |
show details | |

|
#13
Chateaux Way
Corona, CA 92882
|
3,509 sq. feet
|
3 baths 5 beds |
show details | |

|
#14
Fabiola Ln
Corona, CA 92880
|
2,193 sq. feet
|
2 baths 3 beds |
show details | |

|
#15
Kellogg Ave
Corona, CA 92879
|
1,946 sq. feet
|
2 baths 4 beds |
show details | |

|
#16
Wolfson Cir
Corona, CA 92879
|
3,525 sq. feet
|
3 baths 4 beds |
show details | |

|
#17
Concord Ave
Corona, CA 92879
|
1,526 sq. feet
|
2 baths 5 beds |
show details | |

|
#18
Everton Dr
Corona, CA 92880
|
1,712 sq. feet
|
2 baths 3 beds |
show details | |

|
#19
S Sundance Cir
Corona, CA 92879
|
2,204 sq. feet
|
2 baths 3 beds |
show details | |

|
#20
Magnolia Ave Spc 143
Corona, CA 92879
|
1,792 sq. feet
|
2 baths 3 beds |
show details |
| Photo | Address | Area | Beds / Baths | Price | Details |
|---|---|---|---|---|---|

|
#21
Riverbend Cir
Corona, CA 92881
|
3,137 sq. feet
|
3 baths 4 beds |
show details | |

|
#22
San Gabriel Way Unit 103
Corona, CA 92882
|
650 sq. feet
|
1 baths 1 beds |
show details | |

|
#23
Beaver Creek Dr
Corona, CA 92880
|
3,137 sq. feet
|
3 baths 3 beds |
show details | |

|
#24
Duncan Way
Corona, CA 92881
|
2,023 sq. feet
|
3 baths 4 beds |
show details | |

|
#25
Camellia Ct
Corona, CA 92882
|
2,566 sq. feet
|
2 baths 5 beds |
show details | |

|
#26
Roosevelt Cir
Corona, CA 92879
|
1,203 sq. feet
|
2 baths 3 beds |
show details | |

|
#27
Kiger Mustang Cir
Corona, CA 92880
|
3,433 sq. feet
|
5 baths 5 beds |
show details | |

|
#28
Pine St
Corona, CA 92879
|
1,103 sq. feet
|
1 baths 3 beds |
show details | |

|
#29
Mark Twain Ct
Corona, CA 92880
|
3,757 sq. feet
|
4 baths 4 beds |
show details | |

|
#30
Sequoia St
Corona, CA 92879
|
1,653 sq. feet
|
2 baths 4 beds |
show details |
| Photo | Address | Area | Beds / Baths | Price | Details |
|---|---|---|---|---|---|

|
#31
Mount Elena Cir
Corona, CA 92882
|
2,715 sq. feet
|
3 baths 5 beds |
show details | |

|
#32
Havenridge Dr
Corona, CA 92883
|
3,446 sq. feet
|
4 baths 5 beds |
show details | |

|
#33
Athlone Cir
Corona, CA 92882
|
3,572 sq. feet
|
3 baths 5 beds |
show details | |

|
#34
Foxhall Dr
Corona, CA 92883
|
4,743 sq. feet
|
5 baths 5 beds |
show details | |

|
#35
Feather Peak Dr
Corona, CA 92882
|
3,329 sq. feet
|
2 baths 3 beds |
show details | |

|
#36
Dolly Ct
Corona, CA 92880
|
2,435 sq. feet
|
2 baths 4 beds |
show details | |

|
#37
Nightcrest Cir
Corona, CA 92881
|
1,587 sq. feet
|
2 baths 3 beds |
show details | |

|
#38
Del Norte Dr
Corona, CA 92879
|
1,180 sq. feet
|
4 baths 4 beds |
show details | |

|
#39
Walnut Grove Ave
Corona, CA 92880
|
2,029 sq. feet
|
2 baths 3 beds |
show details | |

|
#40
Camellia Ct
Corona, CA 92882
|
2,566 sq. feet
|
2 baths 5 beds |
show details |
| Photo | Address | Area | Beds / Baths | Price | Details |
|---|---|---|---|---|---|

|
#41
Windsong St
Corona, CA 92879
|
2,241 sq. feet
|
3 baths 5 beds |
show details | |

|
#42
Coyote Mesa Dr
Corona, CA 92883
|
2,170 sq. feet
|
3 baths 4 beds |
show details | |

|
#43
Birchtree Ct
Corona, CA 92883
|
2,421 sq. feet
|
2 baths 3 beds |
show details | |

|
#44
Larkspur Dr
Corona, CA 92883
|
1,966 sq. feet
|
2 baths 2 beds |
show details | |

|
#45
Perkins Ct
Corona, CA 92880
|
2,949 sq. feet
|
2 baths 3 beds |
show details | |

|
#46
Deer Creek Ct
Corona, CA 92883
|
1,798 sq. feet
|
2 baths 3 beds |
show details | |

|
#47
Boyd Ave
Corona, CA 92881
|
1,248 sq. feet
|
2 baths 3 beds |
show details | |

|
#48
Owens St Unit 102
Corona, CA 92883
|
1,638 sq. feet
|
2 baths 2 beds |
show details | |

|
#49
Shenandoah Rd
Corona, CA 92879
|
1,702 sq. feet
|
2 baths 4 beds |
show details | |

|
Check over 1 million property listings on Foreclosure.com!
|
browse all offers | |||


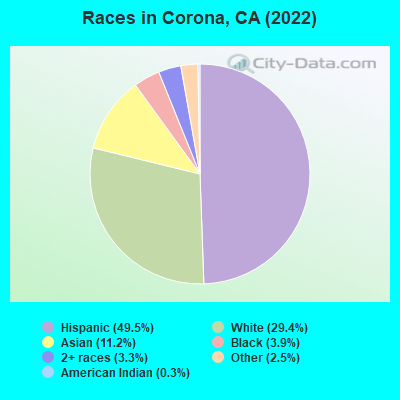
- 78,89649.5%Hispanic
- 46,85229.4%White alone
- 17,81111.2%Asian alone
- 6,1443.9%Black alone
- 5,2693.3%Two or more races
- 4,0042.5%Other race alone
- 4370.3%American Indian alone
- 1210.08%Native Hawaiian and Other
Pacific Islander alone
According to our research of California and other state lists, there were 144 registered sex offenders living in Corona, California as of April 27, 2024.
The ratio of all residents to sex offenders in Corona is 1,158 to 1.
The ratio of registered sex offenders to all residents in this city is lower than the state average.
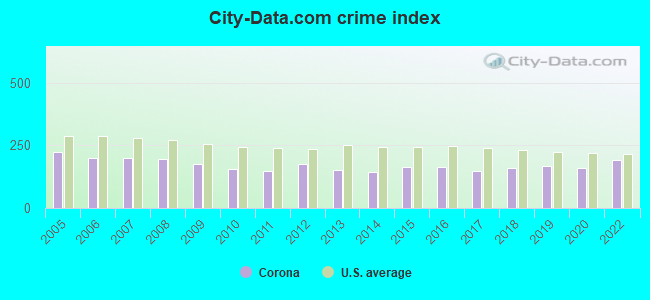
The City-Data.com crime index weighs serious crimes and violent crimes more heavily. Higher means more crime, U.S. average is 246.1. It adjusts for the number of visitors and daily workers commuting into cities.
- means the value is smaller than the state average.- means the value is about the same as the state average.
- means the value is bigger than the state average.
- means the value is much bigger than the state average.
Crime rate in Corona detailed stats: murders, rapes, robberies, assaults, burglaries, thefts, arson
Full-time law enforcement employees in 2021, including police officers: 222 (151 officers - 131 male; 20 female).
| Officers per 1,000 residents here: | 0.87 |
| California average: | 2.30 |
 Recent articles from our blog. Our writers, many of them Ph.D. graduates or candidates, create easy-to-read articles on a wide variety of topics.

 | Corona versus Riverside (2 replies) |
| Corona Questions (10 replies) |
| Best areas of Corona? (13 replies) |
| Help me pick between 3 Corona/Riverside areas (6 replies) |
| Big Corona Fire (1 reply) |
| Move to Corona? (1 reply) |
Latest news from Corona, CA collected exclusively by city-data.com from local newspapers, TV, and radio stations
Ancestries: European (5.1%), German (2.5%), English (2.3%), American (2.0%), Irish (1.4%), Italian (1.3%).
Current Local Time: PST time zone
Elevation: 678 feet
Land area: 35.1 square miles.
Population density: 4,540 people per square mile (average).
38,952 residents are foreign born (13.6% Latin America, 8.3% Asia).
| This city: | 24.2% |
| California: | 26.5% |
Median real estate property taxes paid for housing units with mortgages in 2022: $4,767 (0.7%)
Median real estate property taxes paid for housing units with no mortgage in 2022: $3,627 (0.6%)
Nearest city with pop. 200,000+: Riverside, CA  (11.2 miles , pop. 255,166).
Nearest city with pop. 1,000,000+: Los Angeles, CA (48.7 miles , pop. 3,694,820).
Nearest cities:
), ), ), ), ), )Latitude: 33.87 N, Longitude: 117.57 W
Daytime population change due to commuting: +4,702 (+2.9%)
Workers who live and work in this city: 28,273 (35.6%)
Area code: 909
Corona, California accommodation & food services, waste management - Economy and Business Data
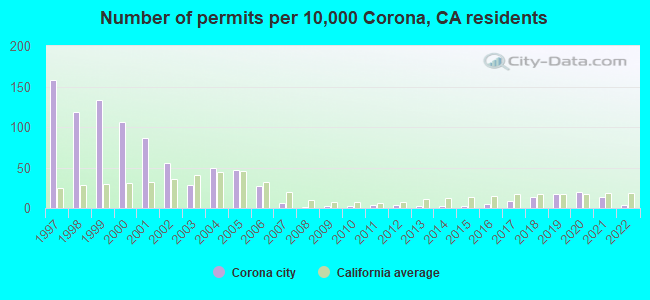
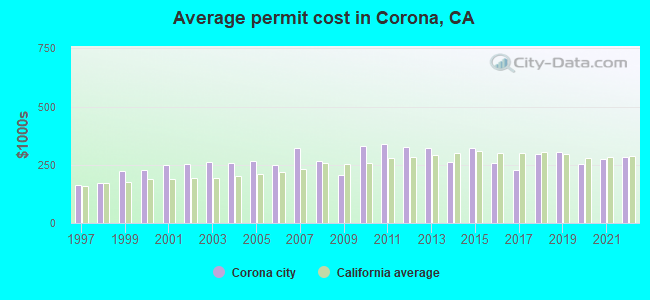
Single-family new house construction building permits:
- 2022: 46 buildings, average cost: $281,900
- 2021: 177 buildings, average cost: $275,400
- 2020: 253 buildings, average cost: $254,600
- 2019: 216 buildings, average cost: $303,700
- 2018: 180 buildings, average cost: $295,500
- 2017: 113 buildings, average cost: $228,400
- 2016: 66 buildings, average cost: $256,100
- 2015: 28 buildings, average cost: $321,800
- 2014: 30 buildings, average cost: $264,200
- 2013: 28 buildings, average cost: $321,200
- 2012: 45 buildings, average cost: $326,900
- 2011: 55 buildings, average cost: $338,900
- 2010: 31 buildings, average cost: $329,900
- 2009: 33 buildings, average cost: $206,500
- 2008: 7 buildings, average cost: $267,700
- 2007: 76 buildings, average cost: $324,000
- 2006: 333 buildings, average cost: $248,800
- 2005: 587 buildings, average cost: $267,000
- 2004: 629 buildings, average cost: $256,100
- 2003: 366 buildings, average cost: $264,000
- 2002: 699 buildings, average cost: $253,300
- 2001: 1090 buildings, average cost: $248,000
- 2000: 1323 buildings, average cost: $227,400
- 1999: 1657 buildings, average cost: $224,300
- 1998: 1483 buildings, average cost: $171,800
- 1997: 1977 buildings, average cost: $163,800
| Here: | 4.1% |
| California: | 5.1% |
Population change in the 1990s: +47,251 (+60.8%).
- Health care (8.3%)
- Construction (8.1%)
- Educational services (7.9%)
- Public administration (6.2%)
- Accommodation & food services (5.8%)
- Administrative & support & waste management services (5.8%)
- Professional, scientific, technical services (5.1%)
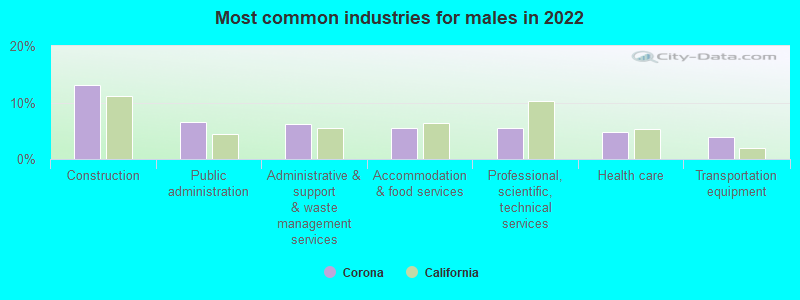
- Construction (13.2%)
- Public administration (6.6%)
- Administrative & support & waste management services (6.2%)
- Accommodation & food services (5.5%)
- Professional, scientific, technical services (5.4%)
- Health care (4.8%)
- Transportation equipment (3.9%)
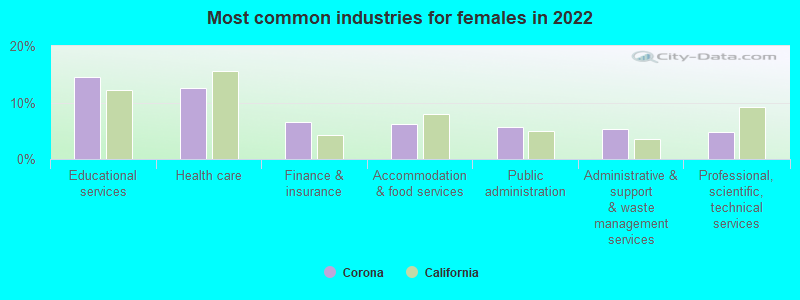
- Educational services (14.6%)
- Health care (12.7%)
- Finance & insurance (6.6%)
- Accommodation & food services (6.2%)
- Public administration (5.7%)
- Administrative & support & waste management services (5.4%)
- Professional, scientific, technical services (4.7%)
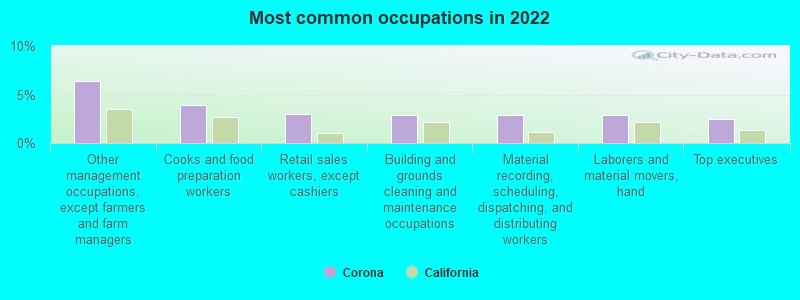
- Other management occupations, except farmers and farm managers (6.4%)
- Cooks and food preparation workers (3.9%)
- Retail sales workers, except cashiers (3.0%)
- Building and grounds cleaning and maintenance occupations (2.9%)
- Material recording, scheduling, dispatching, and distributing workers (2.9%)
- Laborers and material movers, hand (2.9%)
- Top executives (2.5%)
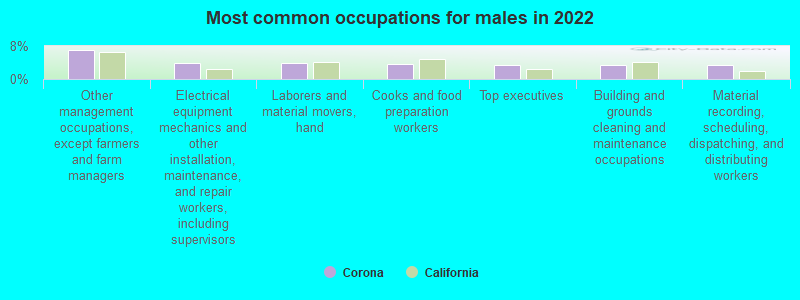
- Other management occupations, except farmers and farm managers (7.1%)
- Electrical equipment mechanics and other installation, maintenance, and repair workers, including supervisors (3.9%)
- Laborers and material movers, hand (3.8%)
- Cooks and food preparation workers (3.5%)
- Top executives (3.5%)
- Building and grounds cleaning and maintenance occupations (3.4%)
- Material recording, scheduling, dispatching, and distributing workers (3.3%)

- Other management occupations, except farmers and farm managers (5.6%)
- Cooks and food preparation workers (4.5%)
- Other office and administrative support workers, including supervisors (3.8%)
- Information and record clerks, except customer service representatives (3.7%)
- Cashiers (3.7%)
- Secretaries and administrative assistants (3.7%)
- Registered nurses (3.4%)
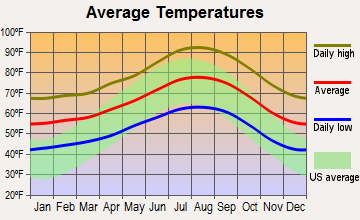
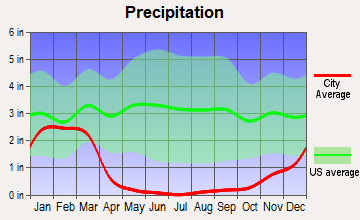
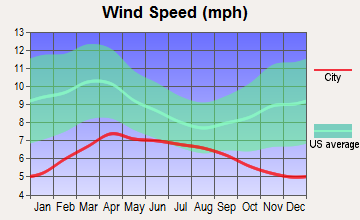
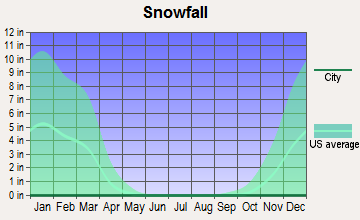
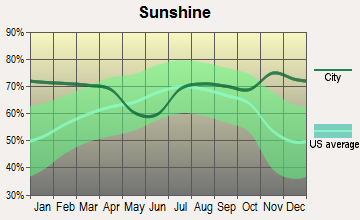
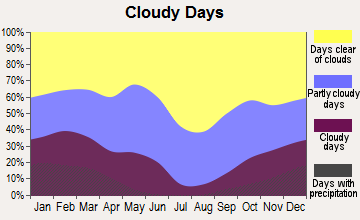
Average climate in Corona, California
Based on data reported by over 4,000 weather stations

|
|

(lower is better)
Air Quality Index (AQI) level in 2022 was 125. This is significantly worse than average.
| City: | 125 |
| U.S.: | 73 |
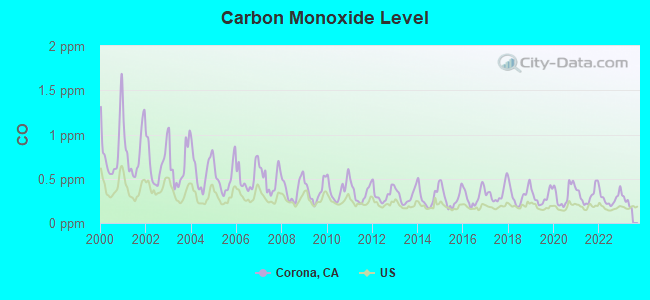
Carbon Monoxide (CO) [ppm] level in 2022 was 0.278. This is about average. Closest monitor was 4.2 miles away from the city center.
| City: | 0.278 |
| U.S.: | 0.251 |
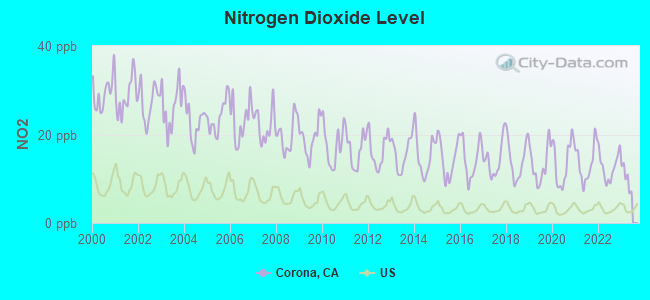
Nitrogen Dioxide (NO2) [ppb] level in 2022 was 12.7. This is significantly worse than average. Closest monitor was 5.7 miles away from the city center.
| City: | 12.7 |
| U.S.: | 5.1 |
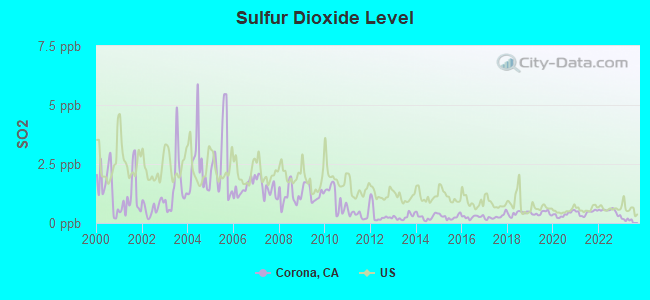
Sulfur Dioxide (SO2) [ppb] level in 2022 was 0.509. This is significantly better than average. Closest monitor was 9.0 miles away from the city center.
| City: | 0.509 |
| U.S.: | 1.515 |
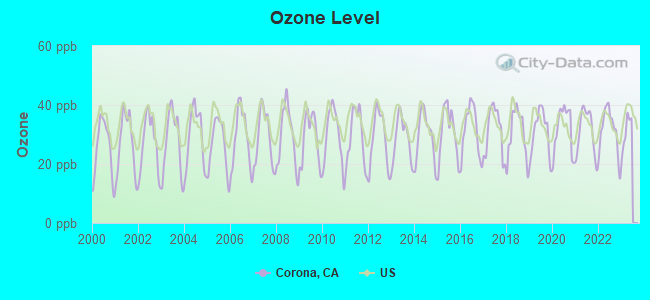
Ozone [ppb] level in 2022 was 31.3. This is about average. Closest monitor was 3.6 miles away from the city center.
| City: | 31.3 |
| U.S.: | 33.3 |
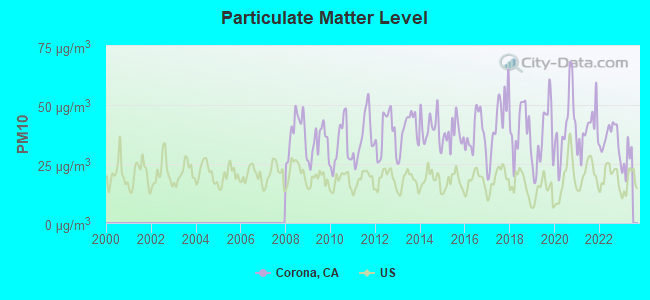
Particulate Matter (PM10) [µg/m3] level in 2022 was 36.1. This is significantly worse than average. Closest monitor was 3.6 miles away from the city center.
| City: | 36.1 |
| U.S.: | 19.2 |
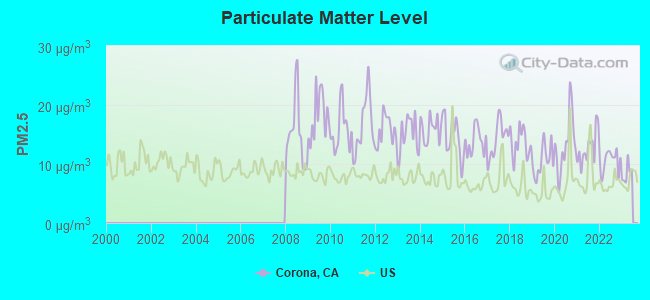
Particulate Matter (PM2.5) [µg/m3] level in 2022 was 10.6. This is worse than average. Closest monitor was 9.8 miles away from the city center.
| City: | 10.6 |
| U.S.: | 8.1 |
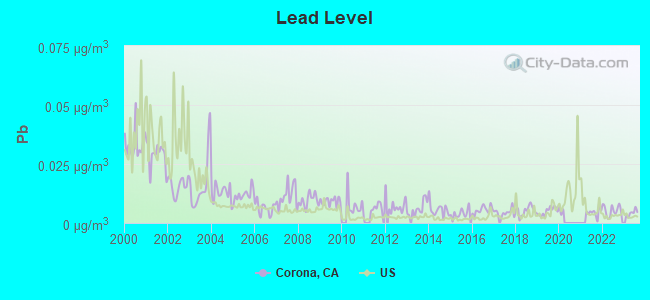
Lead (Pb) [µg/m3] level in 2023 was 0.00426. This is significantly better than average. Closest monitor was 9.0 miles away from the city center.
| City: | 0.00426 |
| U.S.: | 0.00931 |
Earthquake activity:
Corona-area historical earthquake activity is significantly above California state average. It is 7101% greater than the overall U.S. average.On 6/28/1992 at 11:57:34, a magnitude 7.6 (6.2 MB, 7.6 MS, 7.3 MW, Depth: 0.7 mi, Class: Major, Intensity: VIII - XII) earthquake occurred 63.2 miles away from the city center, causing 3 deaths (1 shaking deaths, 2 other deaths) and 400 injuries, causing $100,000,000 total damage and $40,000,000 insured losses
On 7/21/1952 at 11:52:14, a magnitude 7.7 (7.7 UK) earthquake occurred 113.1 miles away from the city center, causing $50,000,000 total damage
On 10/16/1999 at 09:46:44, a magnitude 7.4 (6.3 MB, 7.4 MS, 7.2 MW, 7.3 ML) earthquake occurred 78.7 miles away from the city center
On 4/21/1918 at 22:32:30, a magnitude 6.8 (6.8 UK, Class: Strong, Intensity: VII - IX) earthquake occurred 8.4 miles away from the city center
On 5/19/1940 at 04:36:40, a magnitude 7.2 (7.2 UK) earthquake occurred 116.8 miles away from the city center, causing $33,000,000 total damage
On 6/28/1992 at 15:05:30, a magnitude 6.9 (6.3 MB, 6.7 MS, 6.5 MW, 6.9 ME, Depth: 3.1 mi) earthquake occurred 51.9 miles away from the city center
Magnitude types: body-wave magnitude (MB), energy magnitude (ME), local magnitude (ML), surface-wave magnitude (MS), moment magnitude (MW)
Natural disasters:
The number of natural disasters in Riverside County (46) is a lot greater than the US average (15).Major Disasters (Presidential) Declared: 27
Emergencies Declared: 1
Causes of natural disasters: Fires: 22, Floods: 20, Storms: 8, Winter Storms: 8, Landslides: 6, Mudslides: 5, Heavy Rains: 2, Earthquake: 1, Flash Flood: 1, Freeze: 1, Hurricane: 1, Tornado: 1, Tropical Storm: 1, Other: 1 (Note: some incidents may be assigned to more than one category).
Main business address for: WATSON PHARMACEUTICALS INC (PHARMACEUTICAL PREPARATIONS), HANSEN NATURAL CORP (BOTTLED & CANNED SOFT DRINKS CARBONATED WATERS).
Hospitals in Corona:
- CORONA REGIONAL MEDICAL CENTER (Proprietary, provides emergency services, 800 SOUTH MAIN STREET)
- ELMHURST HOUSE (1068 ELMHURST STREET)
- ROGER RESIDENCE (825-B MAGNOLIA AVENUE)
- TEAKWOOD HOUSE (1481 TEAKWOOD PLACE)
- VILLA VADNAIS (4045 CASTLE PINES WAY)
Nursing Homes in Corona:
- CORONA CARE CONVALESCENT (1400 E. CIRCLE CITY DRIVE)
- CORONA COMMUNITY HOSPITAL SNF (2600 S MAIN STREET)
- CORONA REGIONAL MEDICAL CENTER D/P SNF (730 MAGNOLIA AVENUE)
- VISTA COVE CARE CENTER AT CORONA (2600 SOUTH MAIN STREET)
Dialysis Facilities in Corona:
Home Health Centers in Corona:
Airports located in Corona:
- Corona Municipal Airport (AJO) (Runways: 1, Itinerant Ops: 13,500, Local Ops: 36,500)
Amtrak stations near Corona:
- 14 miles: RIVERSIDE (4066 VINE ST.) - Bus Station . Services: fully wheelchair accessible, public payphones, full-service food facilities, free short-term parking, free long-term parking, call for car rental service, call for taxi service, public transit connection.
- 15 miles: ONTARIO (228 S. PLUM ST.) . Services: fully wheelchair accessible, public payphones, vending machines, free short-term parking, call for taxi service.
- 17 miles: MORENO VALLEY (ARCO MINI MART, 2624 E. ALESSANDRO BLVD.) - Bus Station . Services: public payphones.
Colleges/Universities in Corona:
- ITT Technical Institute-Corona (Full-time enrollment: 498; Location: 4160 Temescal Canyon Rd Ste 100; Private, for-profit; Website: www.itt-tech.edu)
- Salon Success Academy-Corona (Full-time enrollment: 146; Location: 2097 Compton Ave. Suite 201; Private, for-profit; Website: www.gotobeautyschool.com)
Colleges/universities with over 2000 students nearest to Corona:
- Norco College (about 4 miles; Norco, CA; Full-time enrollment: 4,916)
- La Sierra University (about 5 miles; Riverside, CA; FT enrollment: 2,205)
- California Baptist University (about 10 miles; Riverside, CA; FT enrollment: 6,085)
- Santiago Canyon College (about 13 miles; Orange, CA; FT enrollment: 6,050)
- Riverside City College (about 13 miles; Riverside, CA; FT enrollment: 10,661)
- Universal Technical Institute of California Inc (about 15 miles; Rancho Cucamonga, CA; FT enrollment: 4,158)
- University of California-Riverside (about 16 miles; Riverside, CA; FT enrollment: 20,647)
Public high schools in Corona:
- CORONA HIGH (Students: 2,309, Location: 1150 W. TENTH ST., Grades: 9-12)
- CENTENNIAL HIGH (Students: 2,046, Location: 1820 RIMPAU AVE., Grades: 9-12)
- LEE V. POLLARD HIGH (Students: 174, Location: 185 MAGNOLIA AVE., Grades: 9-12)
- ORANGE GROVE HIGH (Students: 67, Location: 300 BUENA VISTA AVE., Grades: 9-12)
- CORONA-NORCO ALTERNATIVE (Students: 33, Location: 185 MAGNOLIA AVE., Grades: KG-12)
- CENTENNIAL VISTA HIGH (Students: 20, Location: 1824 RIMPAU AVE., Grades: 9-12)
- CORONA VISTA HIGH (Students: 4, Location: 1154 TENTH ST., Grades: 9-12)
- SANTIAGO HIGH (Location: 1395 FOOTHILL PKWY., Grades: 9-12)
Private high schools in Corona:
- CROSSROADS CHRISTIAN SCHOOLS (Students: 1,035, Location: 2380 FULLERTON AVE, Grades: PK-12)
- GRACE CHRISTIAN ACADEMY (Students: 65, Location: 2781 S LINCOLN AVE, Grades: KG-12)
- AMOR CHRISTIAN ACADEMY (Students: 14, Location: 517 RAMONA AVE, Grades: 6-12)
- HARVEST INTERNATIONAL SCHOOL (Students: 13, Location: 850 E PARKRIDGE AVENUE SUITE 116, Grades: 2-12)
Biggest public elementary/middle schools in Corona:
- CITRUS HILLS INTERMEDIATE (Students: 1,616, Location: 3211 S. MAIN ST., Grades: 7-8)
- LETHA RANEY INTERMEDIATE (Students: 1,296, Location: 1010 W. CITRON ST., Grades: 6-8)
- CORONA FUNDAMENTAL INTERMEDIATE (Students: 1,154, Location: 1230 S. MAIN ST., Grades: 6-8)
- AUBURNDALE INTERMEDIATE (Students: 892, Location: 1255 RIVER RD., Grades: 7-8)
- EL CERRITO MIDDLE (Students: 831, Location: 7610 EL CERRITO RD., Grades: 6-8)
- ORANGE ELEMENTARY (Students: 778, Location: 1350 VALENCIA RD., Grades: KG-6)
- LINCOLN ALTERNATIVE ELEMENTARY (Students: 774, Location: 1041 FULLERTON AVE., Grades: KG-6)
- WOODROW WILSON ELEMENTARY (Students: 762, Location: 1750 SPYGLASS DR., Grades: KG-6)
- ROSA PARKS ELEMENTARY (Students: 761, Location: 13830 WHISPERING HILLS DR., Grades: KG-6)
- CORONA RANCH ELEMENTARY (Students: 726, Location: 785 VILLAGE LOOP DR., Grades: KG-6)
Private elementary/middle schools in Corona:
- ST EDWARD SCHOOL (Students: 334, Location: 500 S MERRILL ST, Grades: PK-8)
- MONTESSORI SCHOOL OF CORONA (Students: 225, Location: 260 W ONTARIO AVE, Grades: PK-8)
- OLIVE BRANCH CHRISTIAN ACADEMY (Students: 141, Location: 7702 EL CERRITO RD, Grades: KG-8)
- COUNTRYSIDE MONTESSORI CENTER (Students: 83, Location: 2266 GRIFFIN WAY, Grades: PK-1)
- CHILDRENS MONTESSORI CENTER (Students: 59, Location: 2791 GREEN RIVER RD #112, Grades: PK-1)
- CALVARY CHAPEL CHRISTIAN ACADEMY (Students: 42, Location: 130 W CHASE DR, Grades: PK-6)
- MONTESSORI ACADEMY OF CORONA (Students: 34, Location: 1400 W 6TH ST 112, Grades: PK-T1)
User-submitted facts and corrections:
- Additional strong FM stations in Corona: * 99.1 (KGG1) * 100.3 (KKBT)
- Montessori School of Corona is now located at 260 W. Ontario Ave and has 225 students enrolled from pre-school thorugh 6th grade.
Points of interest:
Notable locations in Corona: Corona Sewage Treatment Plant Number 1 (A), Corona Regional Medical Center (B), Cresta Verde Golf Club (C), Prado Dam (D), American Medical Response Corona (E), Mission Ambulance (F), Corona Public Library (G), Saint Edwards Hall (H), Corona Fire Department Station 4 (I), Corona Fire Department Station 2 (J), Corona Fire Department Station 3 (K), Corona Fire Department Station 1 (L), Corona Fire Department Station 5 (M), Corona Fire Department Station 6 (N), Corona Fire Department Station 7 (O). Display/hide their locations on the map
Shopping Centers: Temscal Village Plaza Shopping Center (1), Village Grove Plaza Shopping Center (2), Sierra del Oro Towne Centre Shopping Center (3), The Plaza on Sixth Street Shopping Center (4), Smith Shopping Center (5), Corona Plaza Shopping Center (6), Corona Mall Shopping Center (7), Corona Hills Plaza Shopping Center (8), Corona del Vista Shopping Center (9). Display/hide their locations on the map
Main business address in Corona include: WATSON PHARMACEUTICALS INC (A), HANSEN NATURAL CORP (B). Display/hide their locations on the map
Churches in Corona include: Amor Outreach (A), Apostolic Assembly Church (B), Calvary Chapel of Corona (C), Central Church of Christ (D), First Assembly of God Church (E), Goodnews Church (F), Grace Lutheran Church (G), Saint Edwards Convent (H), Saint Edwards Roman Catholic Church (I). Display/hide their locations on the map
Cemetery: Sunny Shope Cemetery (1). Display/hide its location on the map
Reservoir: Oak Street Creek Reservoir (A). Display/hide its location on the map
Streams, rivers, and creeks: Main Street Wash (A), Temescal Wash (B). Display/hide their locations on the map
Parks in Corona include: Husteo Park (1), Eucalyptus Park (2), Cypress Park (3), Butterfield Stage Trail Park (4), Contreras Park (5), Rock Vista Park (6), Sheridan Park (7), Border Park (8), Brentwood Park (9). Display/hide their locations on the map
Tourist attractions: Corona Historic Preservation Society (Cultural Attractions- Events- & Facilities; Po Box 2904) (1), Corona Heritage Park (Cultural Attractions- Events- & Facilities; 510 West Foothill Parkway) (2), Glen Eden Sun Club (Recreation Areas; 25999 Glen Eden Road) (3). Display/hide their approximate locations on the map
Hotels: Best Western Kings Inn (1084 Pomona Road) (1), Arizona Motel (210 South Lincoln Avenue) (2). Display/hide their approximate locations on the map
Birthplace of: Gary Webb - (c. 1955-2004), investigative journalist, Crystal Lewis - Female singer, Cirilo Flores - Catholic bishop, Demetrius Wright - Football player, Josh Romanski - Professional baseball player, Matt Kalil - Football offensive tackle, Michael Parks - Film actor, Richard Dornbush - Figure skater, Taylor Martinez - Football player, Joey DiGiamarino - Footballer.
Drinking water stations with addresses in Corona and their reported violations in the past:
GRACE KOREAN CHURCH (Population served: 50, Groundwater):Past monitoring violations:
- One routine major monitoring violation
Drinking water stations with addresses in Corona that have no violations reported:
- CALIFORNIA INSTITUTION FOR WOMEN (Population served: 2,000, Primary Water Source Type: Purch groundwater)
| This city: | 3.4 people |
| California: | 2.9 people |
| This city: | 80.8% |
| Whole state: | 68.7% |
| This city: | 6.6% |
| Whole state: | 7.2% |
Likely homosexual households (counted as self-reported same-sex unmarried-partner households)
- Lesbian couples: 0.4% of all households
- Gay men: 0.3% of all households
People in group quarters in Corona in 2010:
- 268 people in nursing facilities/skilled-nursing facilities
- 73 people in group homes intended for adults
- 45 people in residential treatment centers for adults
- 35 people in other noninstitutional facilities
- 31 people in workers' group living quarters and job corps centers
- 27 people in emergency and transitional shelters (with sleeping facilities) for people experiencing homelessness
- 18 people in college/university student housing
- 6 people in group homes for juveniles (non-correctional)
- 4 people in residential treatment centers for juveniles (non-correctional)
- 4 people in in-patient hospice facilities
People in group quarters in Corona in 2000:
- 337 people in nursing homes
- 148 people in other noninstitutional group quarters
- 79 people in schools, hospitals, or wards for the intellectually disabled
- 39 people in other group homes
- 15 people in orthopedic wards and institutions for the physically handicapped
- 7 people in other nonhousehold living situations
- 4 people in homes for the mentally retarded
- 3 people in homes or halfway houses for drug/alcohol abuse
Banks with most branches in Corona (2011 data):
- U.S. Bank National Association: 8 branches. Info updated 2012/01/30: Bank assets: $330,470.8 mil, Deposits: $236,091.5 mil, headquarters in Cincinnati, OH, positive income, 3121 total offices, Holding Company: U.S. Bancorp
- Bank of America, National Association: Foothill Parkway & Main Branch, Hidden Valley Branch, Corona Plaza Branch, Corona Branch, Green River Branch. Info updated 2009/11/18: Bank assets: $1,451,969.3 mil, Deposits: $1,077,176.8 mil, headquarters in Charlotte, NC, positive income, 5782 total offices, Holding Company: Bank Of America Corporation
- Wells Fargo Bank, National Association: Sycamore Creek Branch, 6th Street Plaza, Corona Branch, Vons Corona Branch, Eagle Glen Branch. Info updated 2011/04/05: Bank assets: $1,161,490.0 mil, Deposits: $905,653.0 mil, headquarters in Sioux Falls, SD, positive income, 6395 total offices, Holding Company: Wells Fargo & Company
- JPMorgan Chase Bank, National Association: Corona Hills Branch, Eagle Glen Stater Brothers Banking C, Eastvale Archibald Banking Center, Corona - Ontario Ave & Main St. Info updated 2011/11/10: Bank assets: $1,811,678.0 mil, Deposits: $1,190,738.0 mil, headquarters in Columbus, OH, positive income, International Specialization, 5577 total offices, Holding Company: Jpmorgan Chase & Co.
- Union Bank, National Association: Corona Magnolia Branch, Corona Branch, Sierra Del Oro Instore Branch. Info updated 2011/09/01: Bank assets: $88,967.5 mil, Deposits: $65,286.4 mil, headquarters in San Francisco, CA, positive income, Commercial Lending Specialization, 403 total offices, Holding Company: Mitsubishi Ufj Financial Group, Inc.
- California Bank & Trust: Corona Branch at 200 South Main Street, Suite 150, branch established on 2003/04/15; Corona Pointe Administrative Office at 1260 Corona Pointe Court, branch established on 2005/05/23. Info updated 2009/07/20: Bank assets: $10,894.1 mil, Deposits: $9,193.9 mil, headquarters in San Diego, CA, positive income, Commercial Lending Specialization, 109 total offices, Holding Company: Zions Bancorporation
- First-Citizens Bank & Trust Company: Corona Branch at 1120 El Camino Avenue, branch established on 2004/06/01; Corona Messenger Service Branch at 1120 El Camino Avenue, branch established on 2004/08/02. Info updated 2011/10/11: Bank assets: $20,566.4 mil, Deposits: $17,596.8 mil, headquarters in Raleigh, NC, positive income, Commercial Lending Specialization, 433 total offices, Holding Company: First Citizens Bancshares, Inc.
- American Security Bank: Corona Branch at 2163 Compton Avenue, branch established on 2007/09/24; Corona Branch at 2163 Compton Avenue, branch established on 2005/06/27. Info updated 2008/09/12: Bank assets: $424.0 mil, Deposits: $370.1 mil, headquarters in Newport Beach, CA, positive income, Commercial Lending Specialization, 10 total offices, Holding Company: America Bancshares, Inc.
- Citibank, National Association: 408 N Main St Branch at 408 N Main St, branch established on 1945/01/01; Magnolia Avenue Branch at 1189 Magnolia Avenue, branch established on 1890/01/01. Info updated 2012/01/10: Bank assets: $1,288,658.0 mil, Deposits: $882,541.0 mil, headquarters in Sioux Falls, SD, positive income, International Specialization, 1048 total offices, Holding Company: Citigroup Inc.
- 8 other banks with 8 local branches
For population 15 years and over in Corona:
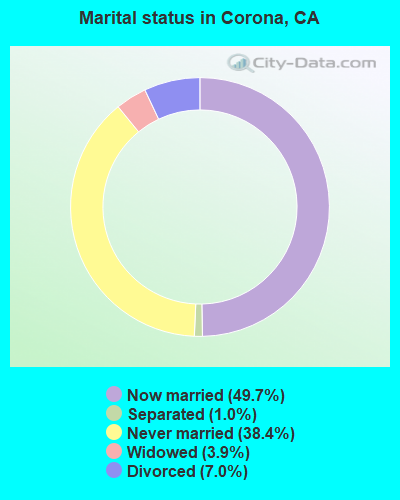
- Never married: 38.4%
- Now married: 49.7%
- Separated: 1.0%
- Widowed: 3.9%
- Divorced: 7.0%
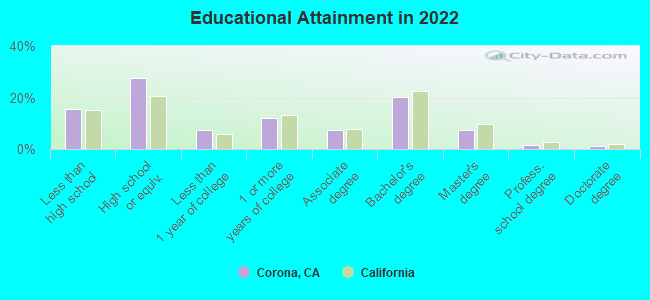
For population 25 years and over in Corona:
- High school or higher: 84.3%
- Bachelor's degree or higher: 30.0%
- Graduate or professional degree: 9.8%
- Unemployed: 5.4%
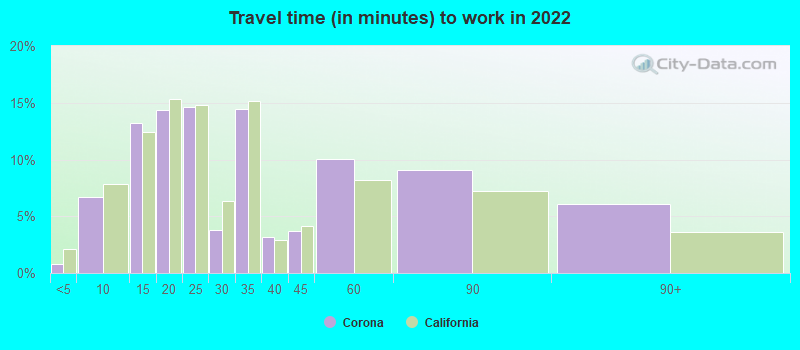
- Mean travel time to work (commute): 29.2 minutes
| Here: | 15.7 |
| California average: | 15.5 |


Graphs represent county-level data. Detailed 2008 Election Results
Neighborhoods in Corona:
(Corona, California Neighborhood Map)Religion statistics for Corona, CA (based on Riverside County data)


| Religion | Adherents | Congregations |
|---|---|---|
| Catholic | 602,765 | 51 |
| Evangelical Protestant | 240,306 | 741 |
| Other | 77,581 | 194 |
| Mainline Protestant | 29,535 | 103 |
| Black Protestant | 19,170 | 40 |
| Orthodox | 3,647 | 11 |
| None | 1,216,637 | - |
Food Environment Statistics:
| This county: | 1.60 / 10,000 pop. |
| State: | 2.14 / 10,000 pop. |
| Riverside County: | 0.05 / 10,000 pop. |
| California: | 0.04 / 10,000 pop. |
| Riverside County: | 0.44 / 10,000 pop. |
| California: | 0.62 / 10,000 pop. |
| This county: | 1.51 / 10,000 pop. |
| California: | 1.49 / 10,000 pop. |
| This county: | 5.45 / 10,000 pop. |
| California: | 7.42 / 10,000 pop. |
| Riverside County: | 7.7% |
| California: | 7.3% |
| This county: | 24.5% |
| California: | 21.3% |
| Riverside County: | 15.2% |
| State: | 17.9% |
Health and Nutrition:
| Here: | 48.5% |
| California: | 49.4% |
| Corona: | 47.8% |
| California: | 48.0% |
| This city: | 28.4 |
| California: | 28.1 |
| Corona: | 20.6% |
| California: | 20.2% |
| Here: | 10.8% |
| State: | 11.2% |
| Corona: | 6.8 |
| California: | 6.8 |
| Corona: | 32.2% |
| State: | 31.5% |
| Corona: | 57.0% |
| California: | 56.4% |
| Corona: | 82.1% |
| California: | 80.9% |
More about Health and Nutrition of Corona, CA Residents
| Local government employment and payroll (March 2022) | |||||
| Function | Full-time employees | Monthly full-time payroll | Average yearly full-time wage | Part-time employees | Monthly part-time payroll |
|---|---|---|---|---|---|
| Police Protection - Officers | 148 | $1,749,514 | $141,852 | 0 | $0 |
| Firefighters | 98 | $1,567,987 | $191,998 | 0 | $0 |
| Police - Other | 74 | $500,833 | $81,216 | 22 | $35,704 |
| Water Supply | 62 | $468,150 | $90,610 | 0 | $0 |
| Other Government Administration | 61 | $507,238 | $99,785 | 7 | $5,157 |
| Financial Administration | 44 | $389,932 | $106,345 | 14 | $26,456 |
| Streets and Highways | 41 | $335,061 | $98,067 | 5 | $10,080 |
| Sewerage | 24 | $236,012 | $118,006 | 0 | $0 |
| Local Libraries | 19 | $128,655 | $81,256 | 10 | $13,589 |
| Other and Unallocable | 18 | $125,426 | $83,617 | 0 | $0 |
| Natural Resources | 12 | $88,858 | $88,858 | 7 | $7,969 |
| Parks and Recreation | 10 | $108,135 | $129,762 | 87 | $125,601 |
| Electric Power | 6 | $85,847 | $171,694 | 0 | $0 |
| Judicial and Legal | 6 | $93,272 | $186,544 | 2 | $1,139 |
| Fire - Other | 5 | $33,953 | $81,487 | 12 | $17,412 |
| Welfare | 0 | $0 | 7 | $8,673 | |
| Totals for Government | 628 | $6,418,871 | $122,654 | 173 | $251,780 |
Corona government finances - Expenditure in 2021 (per resident):
- Construction - Regular Highways: $24,859,000 ($155.79)
Housing and Community Development: $23,537,000 ($147.51)
Water Utilities: $19,207,000 ($120.37)
General - Other: $14,454,000 ($90.58)
Sewerage: $7,803,000 ($48.90)
Police Protection: $4,562,000 ($28.59)
Parks and Recreation: $3,825,000 ($23.97)
Libraries: $193,000 ($1.21)
Local Fire Protection: $62,000 ($0.39)
- Current Operations - Water Utilities: $118,978,000 ($745.63)
Police Protection: $47,711,000 ($299.00)
Central Staff Services: $40,399,000 ($253.18)
Local Fire Protection: $29,465,000 ($184.66)
Sewerage: $20,365,000 ($127.63)
Regular Highways: $17,229,000 ($107.97)
Electric Utilities: $13,996,000 ($87.71)
Solid Waste Management: $10,142,000 ($63.56)
Health - Other: $4,883,000 ($30.60)
Parks and Recreation: $4,797,000 ($30.06)
Libraries: $4,734,000 ($29.67)
Financial Administration: $4,147,000 ($25.99)
Transit Utilities: $3,124,000 ($19.58)
Housing and Community Development: $1,809,000 ($11.34)
Judicial and Legal Services: $1,733,000 ($10.86)
Protective Inspection and Regulation - Other: $1,238,000 ($7.76)
Air Transportation: $173,000 ($1.08)
- Electric Utilities - Interest on Debt: $198,000 ($1.24)
- General - Interest on Debt: $5,715,000 ($35.82)
- Other Capital Outlay - Water Utilities: $24,138,000 ($151.27)
Sewerage: $16,871,000 ($105.73)
Regular Highways: $8,533,000 ($53.48)
General - Other: $4,583,000 ($28.72)
Parks and Recreation: $2,542,000 ($15.93)
Transit Utilities: $268,000 ($1.68)
Local Fire Protection: $136,000 ($0.85)
Libraries: $66,000 ($0.41)
Police Protection: $15,000 ($0.09)
- Water Utilities - Interest on Debt: $10,371,000 ($64.99)
Corona government finances - Revenue in 2021 (per resident):
- Charges - Sewerage: $34,559,000 ($216.58)
Other: $26,453,000 ($165.78)
Solid Waste Management: $10,044,000 ($62.95)
Parks and Recreation: $850,000 ($5.33)
Air Transportation: $592,000 ($3.71)
Regular Highways: $65,000 ($0.41)
- Federal Intergovernmental - Other: $17,713,000 ($111.01)
Housing and Community Development: $2,360,000 ($14.79)
Transit Utilities: $1,184,000 ($7.42)
Water Utilities: $44,000 ($0.28)
- Local Intergovernmental - Transit Utilities: $11,000 ($0.07)
Other: $10,000 ($0.06)
Water Utilities: $7,000 ($0.04)
- Miscellaneous - General Revenue - Other: $17,977,000 ($112.66)
Special Assessments: $12,369,000 ($77.52)
Rents: $7,981,000 ($50.02)
Interest Earnings: $2,986,000 ($18.71)
Fines and Forfeits: $1,011,000 ($6.34)
Donations From Private Sources: $61,000 ($0.38)
Sale of Property: $2,000 ($0.01)
- Revenue - Water Utilities: $162,631,000 ($1019.20)
Electric Utilities: $16,484,000 ($103.30)
Transit Utilities: $68,000 ($0.43)
- State Intergovernmental - Other: $9,016,000 ($56.50)
Highways: $6,528,000 ($40.91)
Water Utilities: $734,000 ($4.60)
General Local Government Support: $281,000 ($1.76)
Transit Utilities: $14,000 ($0.09)
- Tax - Property: $51,219,000 ($320.99)
General Sales and Gross Receipts: $47,558,000 ($298.04)
Public Utilities Sales: $6,245,000 ($39.14)
Other License: $4,656,000 ($29.18)
Occupation and Business License - Other: $2,522,000 ($15.81)
Other Selective Sales: $2,447,000 ($15.34)
Documentary and Stock Transfer: $1,083,000 ($6.79)
Other: $197,000 ($1.23)
Corona government finances - Debt in 2021 (per resident):
- Long Term Debt - Outstanding Unspecified Public Purpose: $572,995,000 ($3590.94)
Beginning Outstanding - Unspecified Public Purpose: $518,452,000 ($3249.12)
Issue, Unspecified Public Purpose: $72,958,000 ($457.22)
Beginning Outstanding - Public Debt for Private Purpose: $40,330,000 ($252.75)
Outstanding Nonguaranteed - Industrial Revenue: $38,494,000 ($241.24)
Retired Unspecified Public Purpose: $18,414,000 ($115.40)
Retired Nonguaranteed - Public Debt for Private Purpose: $1,836,000 ($11.51)
Corona government finances - Cash and Securities in 2021 (per resident):
- Bond Funds - Cash and Securities: $38,837,000 ($243.39)
- Other Funds - Cash and Securities: $304,914,000 ($1910.88)
- Sinking Funds - Cash and Securities: $52,090,000 ($326.45)
7.19% of this county's 2021 resident taxpayers lived in other counties in 2020 ($71,521 average adjusted gross income)
| Here: | 7.19% |
| California average: | 5.19% |
0.03% of residents moved from foreign countries ($210 average AGI)
Riverside County: 0.03% California average: 0.03%
Top counties from which taxpayers relocated into this county between 2020 and 2021:
| from Los Angeles County, CA | |
| from San Bernardino County, CA | |
| from Orange County, CA |
6.28% of this county's 2020 resident taxpayers moved to other counties in 2021 ($64,593 average adjusted gross income)
| Here: | 6.28% |
| California average: | 6.14% |
0.02% of residents moved to foreign countries ($200 average AGI)
Riverside County: 0.02% California average: 0.02%
Top counties to which taxpayers relocated from this county between 2020 and 2021:
| to San Bernardino County, CA | |
| to Los Angeles County, CA | |
| to Orange County, CA |
| Businesses in Corona, CA | ||||
| Name | Count | Name | Count | |
|---|---|---|---|---|
| 24 Hour Fitness | 2 | KFC | 2 | |
| 7-Eleven | 5 | Knights Inn | 1 | |
| 99 Cents Only Stores | 1 | Kohl's | 2 | |
| AT&T | 1 | Kroger | 3 | |
| Ace Hardware | 1 | Lane Bryant | 1 | |
| Albertsons | 2 | Little Caesars Pizza | 3 | |
| American Eagle Outfitters | 1 | Lowe's | 1 | |
| Ann Taylor | 1 | Marriott | 2 | |
| Applebee's | 1 | Marshalls | 1 | |
| Arby's | 1 | MasterBrand Cabinets | 13 | |
| AutoZone | 3 | McDonald's | 6 | |
| Avenue | 1 | Men's Wearhouse | 1 | |
| Bakers | 1 | Motel 6 | 1 | |
| Banana Republic | 1 | Motherhood Maternity | 1 | |
| Barnes & Noble | 1 | New York & Co | 1 | |
| Baskin-Robbins | 4 | Nike | 7 | |
| Bath & Body Works | 1 | Nissan | 1 | |
| Bebe | 1 | Office Depot | 1 | |
| Bed Bath & Beyond | 1 | OfficeMax | 1 | |
| Best Western | 1 | Old Navy | 1 | |
| Big O Tires | 1 | On The Border | 1 | |
| Blockbuster | 2 | Outback | 1 | |
| Buffalo Wild Wings | 1 | Outback Steakhouse | 1 | |
| Burger King | 2 | Pac Sun | 1 | |
| Burlington Coat Factory | 1 | Panda Express | 1 | |
| CVS | 4 | Panera Bread | 1 | |
| Carl\s Jr. | 7 | Papa John's Pizza | 1 | |
| Charlotte Russe | 1 | Payless | 4 | |
| Chick-Fil-A | 2 | Penske | 2 | |
| Chico's | 1 | PetSmart | 1 | |
| Chuck E. Cheese's | 1 | Pier 1 Imports | 1 | |
| Circle K | 6 | Pizza Hut | 3 | |
| Clarks | 1 | Quiznos | 2 | |
| Cold Stone Creamery | 1 | RadioShack | 3 | |
| Coldwater Creek | 1 | Red Robin | 1 | |
| Costco | 1 | Rite Aid | 1 | |
| Curves | 1 | Safeway | 3 | |
| DHL | 2 | Sam's Club | 1 | |
| Dairy Queen | 1 | Sears | 4 | |
| Decora Cabinetry | 2 | Skechers USA | 1 | |
| Dennys | 3 | Sprint Nextel | 1 | |
| Domino's Pizza | 1 | Staples | 1 | |
| DressBarn | 1 | Starbucks | 8 | |
| Dressbarn | 1 | Subway | 10 | |
| El Pollo Loco | 2 | T-Mobile | 11 | |
| Ethan Allen | 1 | T.G.I. Driday's | 1 | |
| Express | 1 | Taco Bell | 5 | |
| Famous Footwear | 1 | Target | 1 | |
| FedEx | 22 | The Room Place | 2 | |
| Firestone Complete Auto Care | 1 | Toyota | 1 | |
| Fredericks Of Hollywood | 1 | Toys"R"Us | 1 | |
| GNC | 1 | Trader Joe's | 1 | |
| GameStop | 2 | Travelodge | 1 | |
| Goodwill | 2 | U-Haul | 5 | |
| Gymboree | 1 | UPS | 19 | |
| H&R Block | 5 | Vans | 2 | |
| Holiday Inn | 1 | Verizon Wireless | 4 | |
| Home Depot | 2 | Victoria's Secret | 1 | |
| HomeTown Buffet | 1 | Volkswagen | 1 | |
| Honda | 1 | Vons | 3 | |
| Jack In The Box | 8 | Walgreens | 3 | |
| Jamba Juice | 1 | Walmart | 2 | |
| JoS. A. Bank | 1 | Wendy's | 4 | |
| Jones New York | 5 | Wet Seal | 1 | |
| Just Tires | 1 | YMCA | 1 | |
| Justice | 1 | Z Gallerie | 1 | |
Strongest AM radio stations in Corona:
- KPLS (830 AM; 50 kW; ORANGE, CA; Owner: CRN LICENSES, LLC)
- KWRM (1370 AM; 5 kW; CORONA, CA; Owner: MAJOR MARKET STATIONS, INC.)
- KFI (640 AM; 50 kW; LOS ANGELES, CA; Owner: CAPSTAR TX LIMITED PARTNERSHIP)
- KLAC (570 AM; 50 kW; LOS ANGELES, CA; Owner: AMFM RADIO LICENSES, L.L.C.)
- KTNQ (1020 AM; 50 kW; LOS ANGELES, CA; Owner: KTNQ-AM LICENSE CORP.)
- KXTA (1150 AM; 50 kW; LOS ANGELES, CA; Owner: CITICASTERS LICENSES, L.P.)
- KDIS (1110 AM; 50 kW; PASADENA, CA; Owner: ABC,INC.)
- KFWB (980 AM; 50 kW; LOS ANGELES, CA; Owner: INFINITY BROADCASTING OPERATIONS, INC.)
- KPRO (1570 AM; 5 kW; RIVERSIDE, CA; Owner: OLIVE L. SHERBAN)
- KSPA (1510 AM; 10 kW; ONTARIO, CA; Owner: ONTARIO BROADCASTING, LLC)
- KSPN (710 AM; 50 kW; LOS ANGELES, CA; Owner: KABC-AM RADIO, INC.)
- KNX (1070 AM; 50 kW; LOS ANGELES, CA; Owner: INFINITY BROADCASTING OPERATIONS, INC.)
- KMPC (1540 AM; 50 kW; LOS ANGELES, CA; Owner: ROSE CITY RADIO CORPORATION)
Strongest FM radio stations in Corona:
- KWVE (107.9 FM; SAN CLEMENTE, CA; Owner: CALVARY CHAPEL OF COSTA MESA)
- KOLA (99.9 FM; SAN BERNARDINO, CA; Owner: INLAND EMPIRE BROADCASTING CORP.)
- KUCR (88.3 FM; RIVERSIDE, CA; Owner: THE REGENTS OF THE UNIV. OF CA)
- KVCR (91.9 FM; SAN BERNARDINO, CA; Owner: SAN BERNARDINO COMMUNITY COLLEGE DISTRICT)
- KUOR-FM (89.1 FM; REDLANDS, CA; Owner: UNIVERSITY OF REDLANDS)
- K264AF (100.7 FM; GUASTI, CA; Owner: EDUCATIONAL MEDIA FOUNDATION)
- KLRD (90.1 FM; YUCAIPA, CA; Owner: EDUCATIONAL MEDIA FOUNDATION)
- KCBS-FM (93.1 FM; LOS ANGELES, CA; Owner: INFINITY BROADCASTING OPERATIONS, INC.)
- KRTM (88.9 FM; TEMECULA, CA; Owner: PENFOLD COMMUNICATIONS, INC.)
- K295AI (106.9 FM; MUSCOY, CA; Owner: ASSOCIATION FOR COMMUNITY EDUCATION, INC.)
- KSCA (101.9 FM; GLENDALE, CA; Owner: HBC LICENSE CORPORATION)
- KLOS (95.5 FM; LOS ANGELES, CA; Owner: KLOS-FM RADIO, INC.)
- K212FA (90.3 FM; TEMPLE CITY, CA; Owner: EDUCATIONAL MEDIA FOUNDATION)
- KOST (103.5 FM; LOS ANGELES, CA; Owner: CAPSTAR TX LIMITED PARTNERSHIP)
- KLVE (107.5 FM; LOS ANGELES, CA; Owner: KLVE-FM LICENSE CORP.)
- KIIS-FM (102.7 FM; LOS ANGELES, CA; Owner: CITICASTERS LICENSES, L.P.)
- KPCC (89.3 FM; PASADENA, CA; Owner: PASADENA AREA COMMUNITY COLLEGE DISTRICT)
- KHHT (92.3 FM; LOS ANGELES, CA; Owner: AMFM RADIO LICENSES, L.L.C.)
- KBIG-FM (104.3 FM; LOS ANGELES, CA; Owner: AMFM RADIO LICENSES, L.L.C.)
- KMZT-FM (105.1 FM; LOS ANGELES, CA; Owner: MOUNT WILSON FM BROADCASTERS, INC.)
TV broadcast stations around Corona:
- KTRO-LP (Channel 50; LANCASTER, CA; Owner: ROBERT D. ADELMAN)
- KHIZ (Channel 64; BARSTOW, CA; Owner: SUNBELT TELEVISION, INC.)
- KCBS-TV (Channel 2; LOS ANGELES, CA; Owner: CBS BROADCASTING INC.)
- KVCR-TV (Channel 24; SAN BERNARDINO, CA; Owner: SAN BERNARDINO COMMUNITY COLLEGE DISTRICT)
- National Bridge Inventory (NBI) Statistics
- 137Number of bridges
- 2,690ft / 820mTotal length
- $243,000Total costs
- 10,230,988Total average daily traffic
- 720,624Total average daily truck traffic
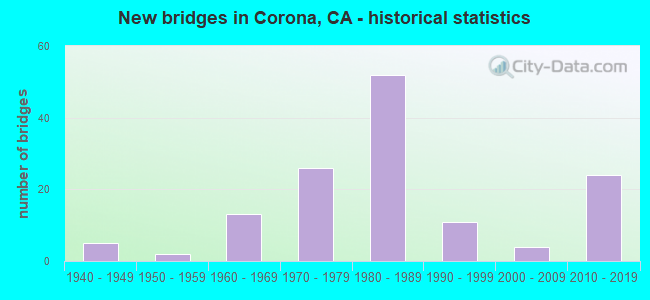
- New bridges - historical statistics
- 51940-1949
- 21950-1959
- 131960-1969
- 261970-1979
- 521980-1989
- 111990-1999
- 42000-2009
- 242010-2019
FCC Registered Antenna Towers: 663 (See the full list of FCC Registered Antenna Towers)
FCC Registered Commercial Land Mobile Towers: 1 (See the full list of FCC Registered Commercial Land Mobile Towers in Corona, CA)
FCC Registered Private Land Mobile Towers: 23 (See the full list of FCC Registered Private Land Mobile Towers)
FCC Registered Broadcast Land Mobile Towers: 135 (See the full list of FCC Registered Broadcast Land Mobile Towers)
FCC Registered Microwave Towers: 206 (See the full list of FCC Registered Microwave Towers in this town)
FCC Registered Paging Towers: 34 (See the full list of FCC Registered Paging Towers)
FCC Registered Maritime Coast & Aviation Ground Towers: 7 (See the full list of FCC Registered Maritime Coast & Aviation Ground Towers)
FCC Registered Amateur Radio Licenses: 1,126 (See the full list of FCC Registered Amateur Radio Licenses in Corona)
FAA Registered Aircraft Manufacturers and Dealers: 12 (See the full list of FAA Registered Manufacturers and Dealers in Corona)
FAA Registered Aircraft: 177 (See the full list of FAA Registered Aircraft)
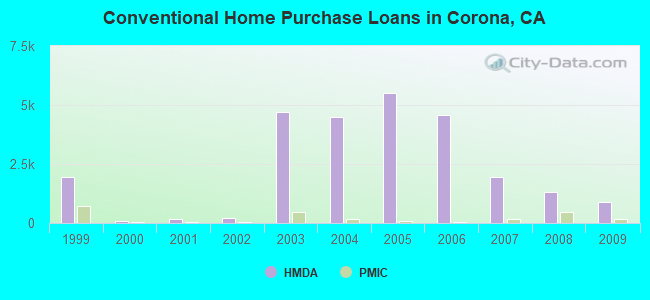
| Home Mortgage Disclosure Act Aggregated Statistics For Year 2009 (Based on 23 full and 7 partial tracts) | ||||||||||||||
| A) FHA, FSA/RHS & VA Home Purchase Loans | B) Conventional Home Purchase Loans | C) Refinancings | D) Home Improvement Loans | E) Loans on Dwellings For 5+ Families | F) Non-occupant Loans on < 5 Family Dwellings (A B C & D) | G) Loans On Manufactured Home Dwelling (A B C & D) | ||||||||
|---|---|---|---|---|---|---|---|---|---|---|---|---|---|---|
| Number | Average Value | Number | Average Value | Number | Average Value | Number | Average Value | Number | Average Value | Number | Average Value | Number | Average Value | |
| LOANS ORIGINATED | 1,102 | $253,100 | 875 | $255,743 | 1,874 | $251,220 | 78 | $155,386 | 1 | $128,000 | 254 | $195,131 | 10 | $114,622 |
| APPLICATIONS APPROVED, NOT ACCEPTED | 95 | $249,493 | 138 | $267,380 | 240 | $269,727 | 19 | $55,255 | 1 | $8,581,950 | 42 | $208,910 | 5 | $56,138 |
| APPLICATIONS DENIED | 230 | $262,557 | 242 | $267,855 | 740 | $288,048 | 67 | $76,623 | 0 | $0 | 109 | $197,407 | 17 | $54,322 |
| APPLICATIONS WITHDRAWN | 129 | $269,042 | 178 | $251,673 | 453 | $270,041 | 28 | $129,796 | 0 | $0 | 59 | $180,003 | 1 | $25,000 |
| FILES CLOSED FOR INCOMPLETENESS | 46 | $271,976 | 49 | $261,168 | 149 | $275,885 | 5 | $192,400 | 0 | $0 | 18 | $194,775 | 0 | $0 |
Detailed mortgage data for all 30 tracts in Corona, CA
| Private Mortgage Insurance Companies Aggregated Statistics For Year 2009 (Based on 21 full and 7 partial tracts) | ||||||
| A) Conventional Home Purchase Loans | B) Refinancings | C) Non-occupant Loans on < 5 Family Dwellings (A & B) | ||||
|---|---|---|---|---|---|---|
| Number | Average Value | Number | Average Value | Number | Average Value | |
| LOANS ORIGINATED | 151 | $292,139 | 27 | $291,918 | 1 | $394,000 |
| APPLICATIONS APPROVED, NOT ACCEPTED | 79 | $283,780 | 14 | $342,756 | 0 | $0 |
| APPLICATIONS DENIED | 33 | $260,798 | 8 | $311,242 | 0 | $0 |
| APPLICATIONS WITHDRAWN | 16 | $292,802 | 4 | $336,750 | 0 | $0 |
| FILES CLOSED FOR INCOMPLETENESS | 12 | $256,180 | 2 | $383,500 | 0 | $0 |
2005 - 2018 National Fire Incident Reporting System (NFIRS) incidents
- Fire incident types reported to NFIRS in Corona, CA
- 65242.9%Outside Fires
- 44029.0%Structure Fires
- 38425.3%Mobile Property/Vehicle Fires
- 432.8%Other
 Based on the data from the years 2005 - 2018 the average number of fire incidents per year is 108. The highest number of fire incidents - 376 took place in 2008, and the least - 1 in 2012. The data has a decreasing trend.
 When looking into fire subcategories, the most reports belonged to: Outside Fires (42.9%), and Structure Fires (29.0%).
Fire-safe hotels and motels in Corona, California:
- Dynasty Suites Corona, 1805 W Sixth St, Corona, California 92882 , Phone: (951) 371-7185, Fax: (951) 371-0401
- Travelodge Of Corona, 1701 W 6th St, Corona, California 92882 , Phone: (951) 735-5500, Fax: (951) 371-6538
- Ayres Suites Corona West, 1900 Frontage Rd, Corona, California 92882 , Phone: (951) 738-9113, Fax: (951) 738-9182
- Ayres Inn Corona East/West Riverside, 2260 Griffin Way, Corona, California 92879 , Phone: (951) 734-2140, Fax: (951) 734-4056
- Residence Inn By Marriott Corona Riverside County, 1015 Montecito Dr, Corona, California 92879 , Phone: (951) 371-0107, Fax: (951) 371-0159
- Holiday Inn Express & Suites, 1550 Cir City Dr, Corona, California 92879 , Phone: (951) 479-4000, Fax: (951) 479-4129
- Springhill Suites Corona Riverside, 2025 Compton Ave, Corona, California 92881 , Phone: (951) 520-0984, Fax: (951) 520-8468
- Scottish Inns And Suites, 210 S Lincoln Ave, Corona, California 92882 , Phone: (951) 272-4800, Fax: (951) 736-0904
- Staybridge Suites Corona, 2700 Blue Springs Dr, Corona, California 92883 , Phone: (951) 277-9000, Fax: (951) 277-9100
| Most common first names in Corona, CA among deceased individuals | ||
| Name | Count | Lived (average) |
|---|---|---|
| John | 288 | 73.4 years |
| Mary | 283 | 79.5 years |
| Robert | 280 | 71.4 years |
| William | 219 | 73.8 years |
| James | 214 | 71.3 years |
| Charles | 175 | 72.8 years |
| George | 146 | 75.6 years |
| Maria | 132 | 77.2 years |
| Frank | 129 | 73.1 years |
| Margaret | 127 | 79.6 years |
| Most common last names in Corona, CA among deceased individuals | ||
| Last name | Count | Lived (average) |
|---|---|---|
| Smith | 118 | 76.9 years |
| Johnson | 88 | 74.7 years |
| Brown | 76 | 72.2 years |
| Hernandez | 66 | 71.9 years |
| Martinez | 64 | 71.9 years |
| Rodriguez | 60 | 71.8 years |
| Miller | 53 | 75.9 years |
| Davis | 51 | 78.1 years |
| Jones | 50 | 73.4 years |
| Perez | 50 | 73.4 years |
- 85.3%Utility gas
- 11.3%Electricity
- 1.4%Bottled, tank, or LP gas
- 1.0%Solar energy
- 0.5%No fuel used
- 0.3%Other fuel
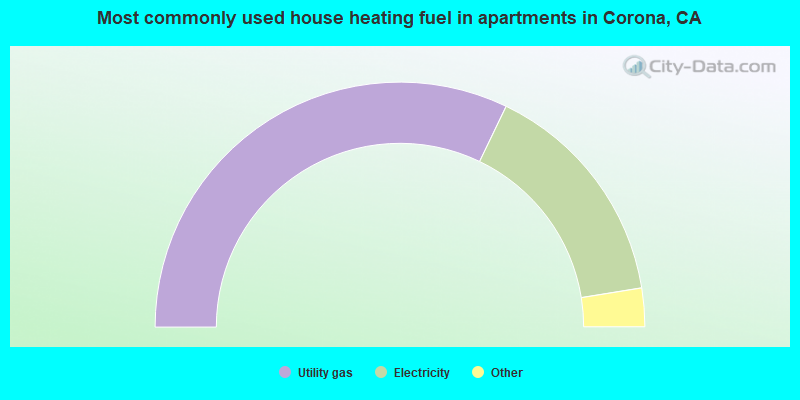
- 64.3%Utility gas
- 30.6%Electricity
- 2.6%No fuel used
- 2.0%Bottled, tank, or LP gas
- 0.3%Other fuel
- 0.2%Fuel oil, kerosene, etc.
Corona compared to California state average:
- Unemployed percentage significantly below state average.
- House age below state average.
Corona, CA compared to other similar cities:
Corona on our top lists:
- #18 on the list of "Top 101 cities with the highest percentage of family households, population 100,000+"
- #23 on the list of "Top 101 cities with the largest city-data.com crime index increase from 2011 to 2012 (population 50,000+)"
- #47 on the list of "Top 101 cities with the lowest number of police officers per 1000 residents (population 50,000+)"
- #50 on the list of "Top 100 cities with longest commuting times (pop. 50,000+)"
- #53 on the list of "Top 101 cities with the lowest average yearly precipitation (population 50,000+)"
- #55 on the list of "Top 101 cities with largest percentage population increases in the 1990s) (population 50,000+)"
- #57 on the list of "Top 101 cities with largest percentage of females in industries: administrative and support and waste management services (population 50,000+)"
- #65 on the list of "Top 101 cities with largest percentage of females in industries: management of companies and enterprises (population 50,000+)"
- #67 on the list of "Top 101 cities with the lowest number of assaults per 100,000 residents (population 50,000+)"
- #69 on the list of "Top 100 cities with highest median household income and median resident age less than 35 (pop. 50,000+)"
- #76 on the list of "Top 101 cities with largest percentage of females in occupations: sales and related occupations (population 50,000+)"
- #78 on the list of "Top 101 cities with the smallest percentage of high school students in private schools (3,000+ students)"
- #86 on the list of "Top 101 cities with the highest cost per building permit(population 50,000+)"
- #97 on the list of "Top 101 cities with the most cars per house, population 50,000+"
- #97 on the list of "Top 101 cities with the smallest household incomes disparities (population 50,000+)"
- #98 on the list of "Top 101 cities with largest percentage of males in occupations: management occupations (population 50,000+)"
- #100 on the list of "Top 101 cities with largest percentage of females in occupations: transportation occupations (population 50,000+)"
- #3 on the list of "Top 101 counties with the highest lead air pollution readings in 2012 (µg/m3)"
- #4 on the list of "Top 101 counties with the highest ground withdrawal of fresh water for public supply"
- #11 on the list of "Top 101 counties with the most Catholic adherents"
- #11 on the list of "Top 101 counties with the highest total withdrawal of fresh water for public supply"
- #12 on the list of "Top 101 counties with the highest carbon monoxide air pollution readings in 2012 (ppm)"

|
|
Total of 1134 patent applications in 2008-2024.