Estimated zip code population in 2022: 31,140 Zip code population in 2010: 30,991 Zip code population in 2000: 21,903
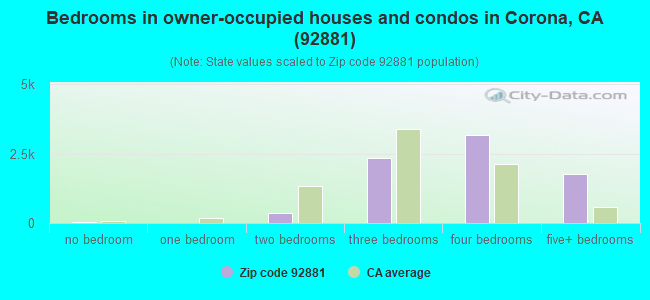
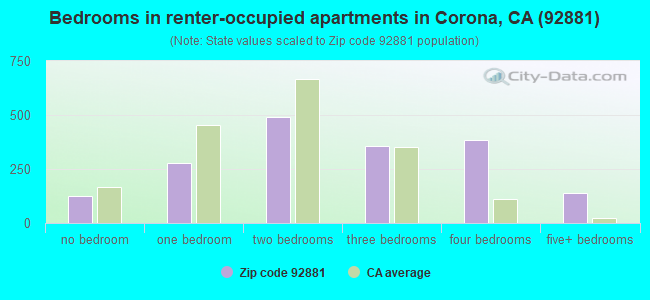
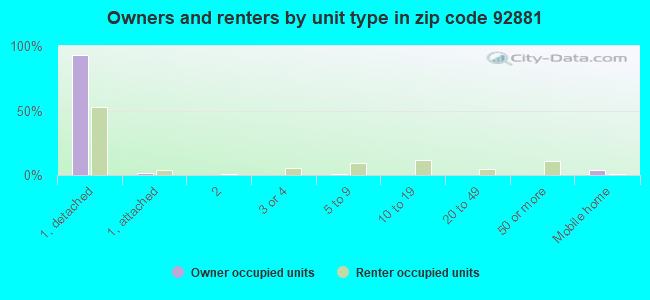
Houses and condos: 9,698 Renter-occupied apartments: 1,768
% of renters here:
19%
State:
44%
March 2022 cost of living index in zip code 92881: 82.4 (low, U.S. average is 100)
Land area: 27.7 sq. mi. Water area: 0.2 sq. mi.
Population density: 1,125 people per square mile
(low).
OSM Map
General Map
Google Map
MSN Map
OSM Map
General Map
Google Map
MSN Map
OSM Map
General Map
Google Map
MSN Map
OSM Map
General Map
Google Map
MSN Map
Please wait while loading the map...
Real estate property taxes paid for housing units in 2022:
This zip code:
0.8% ($6,164)
California:
0.7% ($4,831)
Median real estate property taxes paid for housing units with mortgages in 2022: $6,305 (0.9%) Median real estate property taxes paid for housing units with no mortgage in 2022: $5,266 (0.7%)
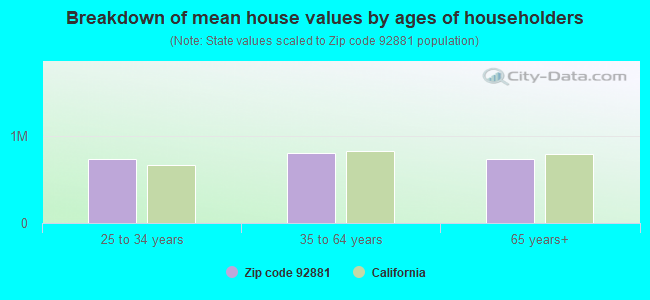
Estimated median house/condo value in 2022: $736,097
92881:
$736,097
California:
$715,900
According to our research of California and other state lists, there were 20 registered sex offenders living in 92881 zip code as of April 27, 2024. The ratio of all residents to sex offenders in zip code 92881 is 1,748 to 1. The ratio of registered sex offenders to all residents in this zip code is lower than the state average.
Median resident age:
This zip code:
40.3 years
California median age:
37.9 years
Average household size:
This zip code:
3.3 people
California:
2.8 people
Averages for the 2020 tax year for zip code 92881, filed in 2021:
Average Adjusted Gross Income (AGI) in 2020: $94,612 (Individual Income Tax Returns)
Here:
$94,612
State:
$95,910
Salary/wage: $79,015 (reported on 84.1% of returns)
Here:
$79,015
State:
$77,331
(% of AGI for various income ranges: 1218.0% for AGIs below $25k, 3865.6% for AGIs $25k-50k, 7464.0% for AGIs $50k-75k, 11184.3% for AGIs $75k-100k, 22140.1% for AGIs $100k-200k, 84797.6% for AGIs over 200k)
Taxable interest for individuals: $1,025 (reported on 41.6% of returns)
This zip code:
$1,025
California:
$2,294
(% of AGI for various income ranges: 15.7% for AGIs below $25k, 22.2% for AGIs $25k-50k, 29.7% for AGIs $50k-75k, 55.6% for AGIs $75k-100k, 84.2% for AGIs $100k-200k, 840.5% for AGIs over 200k)
Ordinary dividends: $3,874 (reported on 16.8% of returns)
Here:
$3,874
State:
$10,949
(% of AGI for various income ranges: 15.9% for AGIs below $25k, 24.7% for AGIs $25k-50k, 52.4% for AGIs $50k-75k, 62.8% for AGIs $75k-100k, 108.0% for AGIs $100k-200k, 1512.4% for AGIs over 200k)
Net capital gain/loss in AGI: +$20,631 (reported on 17.4% of returns)
Here:
+$20,631
State:
+$49,306
(% of AGI for various income ranges: 14.6% for AGIs below $25k, 26.6% for AGIs $25k-50k, 81.0% for AGIs $50k-75k, 70.8% for AGIs $75k-100k, 401.4% for AGIs $100k-200k, 11656.5% for AGIs over 200k)
Profit/loss from business: +$12,943 (reported on 19.1% of returns)
Here:
+$12,943
State:
+$15,671
(% of AGI for various income ranges: 135.0% for AGIs below $25k, 259.2% for AGIs $25k-50k, 269.3% for AGIs $50k-75k, 304.3% for AGIs $75k-100k, 559.6% for AGIs $100k-200k, 3245.9% for AGIs over 200k)
Taxable individual retirement arrangement distribution: $21,625 (reported on 5.5% of returns)
92881:
$21,625
California:
$23,505
(% of AGI for various income ranges: 26.1% for AGIs below $25k, 73.8% for AGIs $25k-50k, 132.6% for AGIs $50k-75k, 261.3% for AGIs $75k-100k, 424.0% for AGIs $100k-200k, 1159.2% for AGIs over 200k)
Self-employed (Keogh) retirement plans: $28,456 (reported on 0.6% of returns)
92881:
$28,456
California:
$30,163
(% of AGI for various income ranges: 31.9% for AGIs $100k-200k, 555.9% for AGIs over 200k)
Total itemized deductions: $34,499 (reported on 24.0% of returns)
Here:
$34,499
State:
$39,517
(% of AGI for various income ranges: 107.1% for AGIs below $25k, 245.4% for AGIs $25k-50k, 698.1% for AGIs $50k-75k, 1580.7% for AGIs $75k-100k, 3118.7% for AGIs $100k-200k, 10888.4% for AGIs over 200k)
Charity contributions: $7,791 (reported on 20.9% of returns)
Here:
$7,791
State:
$12,598
(% of AGI for various income ranges: 6.2% for AGIs below $25k, 25.7% for AGIs $25k-50k, 87.8% for AGIs $50k-75k, 228.1% for AGIs $75k-100k, 536.2% for AGIs $100k-200k, 3077.8% for AGIs over 200k)
Taxes paid: $9,109 (reported on 23.8% of returns)
92881:
$9,109
State:
$8,807
(% of AGI for various income ranges: 21.8% for AGIs below $25k, 58.6% for AGIs $25k-50k, 183.6% for AGIs $50k-75k, 465.5% for AGIs $75k-100k, 913.4% for AGIs $100k-200k, 2411.1% for AGIs over 200k)
Earned income credit: $1,955 (reported on 10.8% of returns)
Here:
$1,955
State:
$2,074
(% of AGI for various income ranges: 62.6% for AGIs below $25k, 65.1% for AGIs $25k-50k)
Percentage of individuals using paid preparers for their 2020 taxes: 93.5%
Here:
94%
State:
92%
(% for various income ranges: 92.5% for AGIs below $25k, 93.1% for AGIs $25k-50k, 93.8% for AGIs $50k-75k, 93.0% for AGIs $75k-100k, 94.7% for AGIs $100k-200k, 94.8% for AGIs over 200k)
Averages for the 2012 tax year for zip code 92881, filed in 2013:
Average Adjusted Gross Income (AGI) in 2012: $75,957 (Individual Income Tax Returns)
Here:
$75,957
State:
$72,726
Salary/wage: $67,402 (reported on 86.6% of returns)
Here:
$67,402
State:
$59,079
(% of AGI for various income ranges: 76.7% for AGIs below $25k, 79.0% for AGIs $25k-50k, 81.5% for AGIs $50k-75k, 82.9% for AGIs $75k-100k, 84.4% for AGIs $100k-200k, 60.4% for AGIs over 200k)
Taxable interest for individuals: $1,065 (reported on 42.3% of returns)
This zip code:
$1,065
California:
$2,146
(% of AGI for various income ranges: 0.5% for AGIs below $25k, 0.5% for AGIs $25k-50k, 0.5% for AGIs $50k-75k, 0.4% for AGIs $75k-100k, 0.4% for AGIs $100k-200k, 1.1% for AGIs over 200k)
Ordinary dividends: $2,901 (reported on 16.4% of returns)
Here:
$2,901
State:
$9,308
(% of AGI for various income ranges: 0.7% for AGIs below $25k, 0.5% for AGIs $25k-50k, 0.4% for AGIs $50k-75k, 0.5% for AGIs $75k-100k, 0.5% for AGIs $100k-200k, 1.1% for AGIs over 200k)
Net capital gain/loss in AGI: +$9,573 (reported on 14.1% of returns)
Here:
+$9,573
State:
+$30,460
(% of AGI for various income ranges: 0.2% for AGIs $75k-100k, 0.7% for AGIs $100k-200k, 5.9% for AGIs over 200k)
Profit/loss from business: +$16,655 (reported on 19.2% of returns)
Here:
+$16,655
State:
+$17,064
(% of AGI for various income ranges: 11.3% for AGIs below $25k, 7.5% for AGIs $25k-50k, 3.4% for AGIs $50k-75k, 3.4% for AGIs $75k-100k, 2.8% for AGIs $100k-200k, 4.4% for AGIs over 200k)
Taxable individual retirement arrangement distribution: $17,951 (reported on 6.5% of returns)
92881:
$17,951
California:
$19,557
(% of AGI for various income ranges: 1.7% for AGIs below $25k, 2.1% for AGIs $25k-50k, 2.2% for AGIs $50k-75k, 1.7% for AGIs $75k-100k, 1.5% for AGIs $100k-200k, 1.0% for AGIs over 200k)
Self-employment retirement plans: $23,971 (reported on 0.6% of returns)
92881:
$23,971
California:
$24,530
Total itemized deductions: $32,309 (27% of AGI, reported on 51.5% of returns)
Here:
$32,309
State:
$34,004
Here:
26.7% of AGI
State:
22.7% of AGI
(% of AGI for various income ranges: 15.7% for AGIs below $25k, 18.0% for AGIs $25k-50k, 23.3% for AGIs $50k-75k, 25.1% for AGIs $75k-100k, 24.0% for AGIs $100k-200k, 19.2% for AGIs over 200k)
Charity contributions: $4,102 (reported on 44.3% of returns)
Here:
$4,102
State:
$4,659
(% of AGI for various income ranges: 0.9% for AGIs below $25k, 1.5% for AGIs $25k-50k, 2.2% for AGIs $50k-75k, 2.7% for AGIs $75k-100k, 2.7% for AGIs $100k-200k, 2.5% for AGIs over 200k)
Taxes paid: $11,601 (reported on 51.3% of returns)
92881:
$11,601
State:
$14,448
(% of AGI for various income ranges: 3.4% for AGIs below $25k, 4.4% for AGIs $25k-50k, 6.4% for AGIs $50k-75k, 7.6% for AGIs $75k-100k, 8.7% for AGIs $100k-200k, 9.3% for AGIs over 200k)
Earned income credit: $2,168 (reported on 13.3% of returns)
Here:
$2,168
State:
$2,286
(% of AGI for various income ranges: 5.3% for AGIs below $25k, 1.3% for AGIs $25k-50k)
Percentage of individuals using paid preparers for their 2012 taxes: 66.3%
Here:
66%
State:
64%
(% for various income ranges: 58.8% for AGIs below $25k, 66.5% for AGIs $25k-50k, 67.1% for AGIs $50k-75k, 71.4% for AGIs $75k-100k, 70.8% for AGIs $100k-200k, 81.2% for AGIs over 200k)
Averages for the 2004 tax year for zip code 92881, filed in 2005:
Average Adjusted Gross Income (AGI) in 2004: $67,942 (Individual Income Tax Returns)
Here:
$67,942
State:
$58,600
Salary/wage: $62,625 (reported on 88.0% of returns)
Here:
$62,625
State:
$49,455
(% of AGI for various income ranges: 183.3% for AGIs below $10k, 77.9% for AGIs $10k-25k, 83.2% for AGIs $25k-50k, 85.3% for AGIs $50k-75k, 88.7% for AGIs $75k-100k, 76.6% for AGIs over 100k)
Taxable interest for individuals: $829 (reported on 53.3% of returns)
This zip code:
$829
California:
$2,365
(% of AGI for various income ranges: 4.8% for AGIs below $10k, 1.0% for AGIs $10k-25k, 0.8% for AGIs $25k-50k, 0.5% for AGIs $50k-75k, 0.4% for AGIs $75k-100k, 0.6% for AGIs over 100k)
Taxable dividends: $1,730 (reported on 19.1% of returns)
Here:
$1,730
State:
$4,746
(% of AGI for various income ranges: 4.5% for AGIs below $10k, 0.4% for AGIs $10k-25k, 0.3% for AGIs $25k-50k, 0.3% for AGIs $50k-75k, 0.3% for AGIs $75k-100k, 0.6% for AGIs over 100k)
Net capital gain/loss: +$10,952 (reported on 17.0% of returns)
Here:
+$10,952
State:
+$23,418
(% of AGI for various income ranges: -2.4% for AGIs below $10k, -0.1% for AGIs $10k-25k, 0.5% for AGIs $25k-50k, 0.9% for AGIs $50k-75k, 0.6% for AGIs $75k-100k, 4.5% for AGIs over 100k)
Profit/loss from business: +$16,297 (reported on 20.7% of returns)
Here:
+$16,297
State:
+$16,826
(% of AGI for various income ranges: -0.2% for AGIs below $10k, 11.5% for AGIs $10k-25k, 7.4% for AGIs $25k-50k, 5.5% for AGIs $50k-75k, 3.3% for AGIs $75k-100k, 4.4% for AGIs over 100k)
IRA payment deduction: $3,479 (reported on 2.9% of returns)
92881:
$3,479
California:
$3,192
(% of AGI for various income ranges: 1.0% for AGIs below $10k, 0.1% for AGIs $10k-25k, 0.2% for AGIs $25k-50k, 0.2% for AGIs $50k-75k, 0.2% for AGIs $75k-100k, 0.1% for AGIs over 100k)
Self-employed pension: $14,770 (reported on 1.1% of returns)
Here:
$14,770
California:
$17,688
(% of AGI for various income ranges: 0.1% for AGIs $25k-50k, 0.1% for AGIs $50k-75k, 0.2% for AGIs $75k-100k, 0.3% for AGIs over 100k)
Total itemized deductions: $32,420 (32% of AGI, reported on 59.4% of returns)
Here:
$32,420
State:
$28,113
Here:
32.2% of AGI
State:
25.3% of AGI
(% of AGI for various income ranges: 26.6% for AGIs below $10k, 19.8% for AGIs $10k-25k, 29.5% for AGIs $25k-50k, 41.9% for AGIs $50k-75k, 31.4% for AGIs $75k-100k, 24.5% for AGIs over 100k)
Charity contributions deductions: $3,551 (3% of AGI, reported on 53.7% of returns)
Here:
$3,551
State:
$3,923
Here:
3.4% of AGI
State:
3.3% of AGI
(% of AGI for various income ranges: 1.0% for AGIs below $10k, 1.3% for AGIs $10k-25k, 2.2% for AGIs $25k-50k, 3.0% for AGIs $50k-75k, 3.1% for AGIs $75k-100k, 2.9% for AGIs over 100k)
Total tax: $9,812 (reported on 79.5% of returns)
92881:
$9,812
State:
$10,761
(% of AGI for various income ranges: 6.2% for AGIs below $10k, 4.9% for AGIs $10k-25k, 6.0% for AGIs $25k-50k, 6.5% for AGIs $50k-75k, 7.3% for AGIs $75k-100k, 15.6% for AGIs over 100k)
Earned income credit: $1,702 (reported on 9.7% of returns)
Here:
$1,702
State:
$1,763
Percentage of individuals using paid preparers for their 2004 taxes: 67.8%
Here:
68%
State:
66%
(% for various income ranges: 52.3% for AGIs below $10k, 62.9% for AGIs $10k-25k, 69.0% for AGIs $25k-50k, 73.1% for AGIs $50k-75k, 72.5% for AGIs $75k-100k, 75.4% for AGIs over 100k)
Likely homosexual households (counted as self-reported same-sex unmarried-partner households)
Lesbian couples: 0.5% of all households
Gay men: 0.0% of all households
Household received Food Stamps/SNAP in the past 12 months: 623 Household did not receive Food Stamps/SNAP in the past 12 months: 8,620
Women who had a birth in the past 12 months: 127 (116 now married, 10 unmarried) Women who did not have a birth in the past 12 months: 7,202 (3,255 now married, 3,930 unmarried)
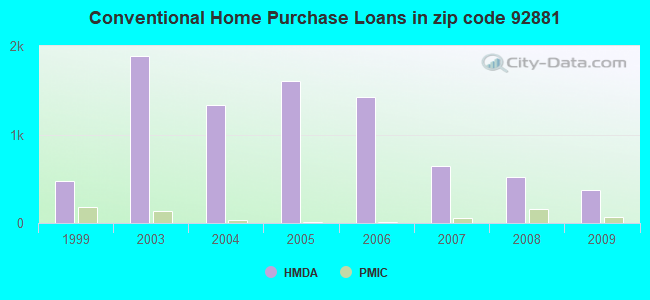
Housing units in zip code 92881 with a mortgage: 5,642 (526 second mortgage, 10 home equity loan, 322 both second mortgage and home equity loan) Houses without a mortgage: 60
Median monthly owner costs for units with a mortgage: $2,872 Median monthly owner costs for units without a mortgage: over $1,000
Residents with income below the poverty level in 2022:
This zip code:
5.9%
Whole state:
12.2%
Residents with income below 50% of the poverty level in 2022:
This zip code:
2.5%
Whole state:
6.2%
Median number of rooms in houses and condos:
Here:
7.5
State:
6.0
Median number of rooms in apartments:
Here:
4.8
State:
3.9
Notable locations in this zip code not listed on our city pages
Notable locations in zip code 92881: Cavalry Ambulance (A), Riverside County Fire Department Station 15 El Cerrito (B), Corona Fire Department Station 7 (C). Display/hide their locations on the map
In group quarters: 291 (-1 institutionalized population)
Size of family households: 2,777 2-persons, 1,666 3-persons, 2,086 4-persons, 779 5-persons, 575 6-persons, 251 7-or-more-persons
Size of nonfamily households: 955 1-person, 187 2-persons
5,521 married couples with children.
1,106 single-parent households (256 men, 850 women).
63.7% of residents of 92881 zip code speak English at home.
21.3% of residents speak Spanish at home (73% very well, 15% well, 9% not well, 3% not at all).
5.6% of residents speak other Indo-European language at home (70% very well, 16% well, 11% not well, 4% not at all).
6.5% of residents speak Asian or Pacific Island language at home (64% very well, 24% well, 9% not well, 3% not at all).
2.7% of residents speak other language at home (88% very well, 3% well, 9% not well).
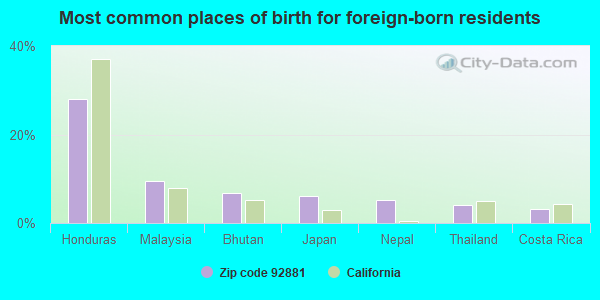
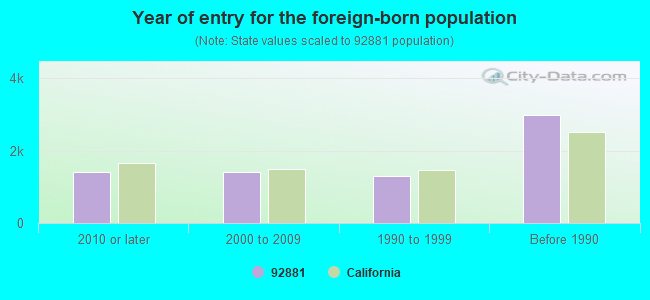
Foreign born population: 6,825 (21.9%) (67.8% of them are naturalized citizens)
Facilities with environmental interests located in this zip code:
LAMINATED SHIM (1691 CALIFORNIA AVE in CORONA, CA)
STATE MASTER (California - Hazardous Waste Tracking) - HAZARDOU WASTE PROGRAM Large Quantity Generators, more that 1000 kg of hazardous waste/month (Resource Conservation and Recovery Act (tracking hazardous waste)) - notification Organizations: ROBERT JOHNSON (CONTACT/OWNER)
ADVANCED FUEL FILTRATION INC (1275 GRAPHITE DR in CORONA, CA)
STATE MASTER (California - Hazardous Waste Tracking) - HAZARDOU WASTE PROGRAM TRANSPORTER (Resource Conservation and Recovery Act (tracking hazardous waste)) - notification Organizations: DOUGLAS PARKER (CONTACT/OWNER)
ALPHA PETROLEUM TRANSPORT INC (2621 COTTAGE DR in CORONA, CA)
STATE MASTER (California - Hazardous Waste Tracking) - HAZARDOU WASTE PROGRAM TRANSPORTER (Resource Conservation and Recovery Act (tracking hazardous waste)) - notification Organizations: DELMAR PARKER (CONTACT/OWNER)
CENTER MANUFACTURING INC (1160 OLYMPIC DR in CORONA, CA)
STATE MASTER (California - Hazardous Waste Tracking) - HAZARDOU WASTE PROGRAM Small Quantity Generators, between 100 kg and 1000 kg of hazardous waste/month (Resource Conservation and Recovery Act (tracking hazardous waste)) - notification
CHEVRON STATION 91582 (2270 FRONTAGE ROAD in CORONA, CA)
STATE MASTER (California - Hazardous Waste Tracking) - HAZARDOU WASTE PROGRAM Small Quantity Generators, between 100 kg and 1000 kg of hazardous waste/month (Resource Conservation and Recovery Act (tracking hazardous waste)) - notification Organizations: CHEVRON PRODUCTS CO (CONTACT/OWNER)
EL CERRITO ELEMENTARY (7581 RUDELL ROAD in CORONA, CA)
(National Center for Education Statistics) - STATE ID-6031777 Organizations: CORONA-NORCO UNIFIED (SCHOOL DISTRICT)
CENTENNIAL HIGH (1820 RIMPAU AVE. in CORONA, CA)
(National Center for Education Statistics) - STATE ID-3330446 Organizations: CORONA-NORCO UNIFIED (SCHOOL DISTRICT)
3M CO CORONA (18750 MINNESOTA ROAD in CORONA, CA)
AIR MAJOR (AIRS/AFS) CRITERIA AND HAZARDOUS AIR POLLUTANT INVENTORY (Inventory of air pollution sources) TRI REPORTER (Tracking of toxic chemicals releasing facilities) Business SIC classification: ASPHALT FELTS AND COATINGS; MINERALS AND EARTHS, GROUND OR OTHERWISE TREATED Alternative names: 3M CO. - CORONA
TRANSPORTER (Resource Conservation and Recovery Act (tracking hazardous waste)) Business NAICS classification: SOLID WASTE COLLECTION.; HAZARDOUS WASTE COLLECTION.
LE MYERS CO THE (21840 NORTH 19TH AVE SUITE B in CORONA, CA)
Small Quantity Generators, between 100 kg and 1000 kg of hazardous waste/month (Resource Conservation and Recovery Act (tracking hazardous waste)) - notification
GAMBOA TRUCK LINES (20305 TEMESCAL CANYON ROAD in CORONA, CA)
Small Quantity Generators, between 100 kg and 1000 kg of hazardous waste/month (Resource Conservation and Recovery Act (tracking hazardous waste))
GLISTENS (1441 POMONA ROAD UNIT 21 in CORONA, CA)
Small Quantity Generators, between 100 kg and 1000 kg of hazardous waste/month (Resource Conservation and Recovery Act (tracking hazardous waste)) - notification Organizations: ERIK CAMPBELL (CONTACT/OWNER)
LOOMIS NATIONAL MARKETING (1128 OLYMPIC DR in CORONA, CA)
COMPLIANCE ACTIVITY (Tracking inspections of insecticide, fungicide, and rodenticide, and toxic substances)
Housing units lacking complete plumbing facilities: 1.5% Housing units lacking complete kitchen facilities: 1.8%
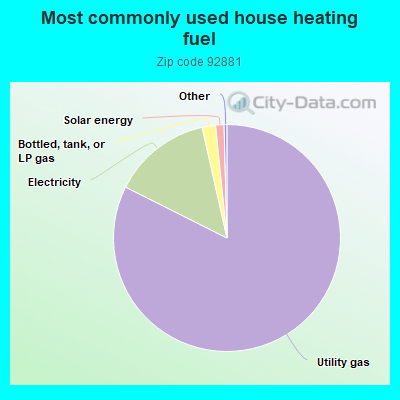
82.4%Utility gas
14.1%Electricity
1.9%Bottled, tank, or LP gas
1.2%Solar energy
Place of birth for U.S.-born residents:
This state: 20,180
Northeast: 665
Midwest: 1,241
South: 1,061
West: 832
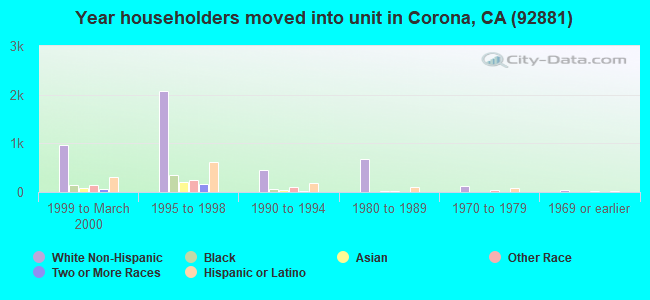
35% of the 92881 zip code residents lived in the same house 5 years ago. Out of people who lived in different houses, 40% lived in this county. Out of people who lived in different counties, 50% lived in California.
90% of the 92881 zip code residents lived in the same house 1 year ago. Out of people who lived in different houses, 41% moved from this county. Out of people who lived in different houses, 43% moved from different county within same state. Out of people who lived in different houses, 12% moved from different state. Out of people who lived in different houses, 5% moved from abroad.
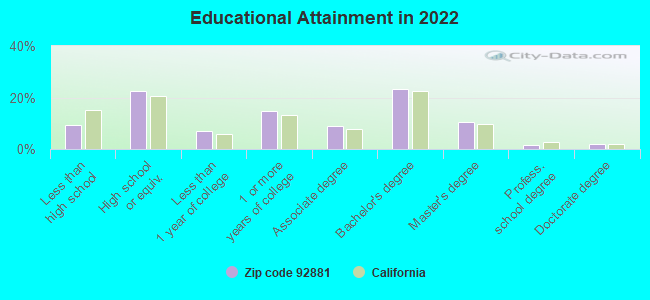
Private vs. public school enrollment:
Students in private schools in grades 1 to 8 (elementary and middle school): 403
Here:
11.4%
California:
10.5%
Students in private schools in grades 9 to 12 (high school): 53
Here:
2.3%
California:
8.5%
Students in private undergraduate colleges: 430
Here:
22.9%
California:
15.9%
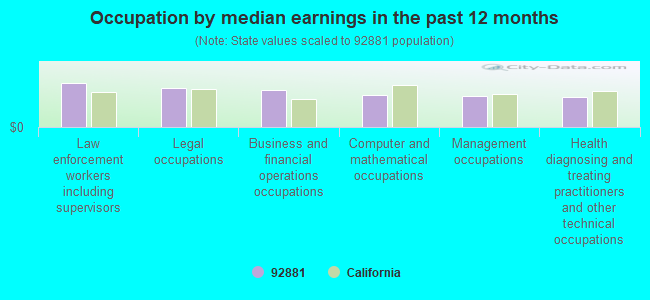
Occupation by median earnings in the past 12 months ($)
150,149Law enforcement workers including supervisors
133,774Legal occupations
127,500Business and financial operations occupations
109,352Computer and mathematical occupations
104,112Management occupations
101,265Health diagnosing and treating practitioners and other technical occupations
Companies with federal contracts located in this zip code (CORONA, CA):
ROSE CONSTRUCTION (4080 GILBERT AVE; small business) : $639,238 in 14 contractsfrom 2000 to 2001
Contracts for Construction of Structures and Facilities -- Miscellaneous Buildings, Maintenance, Repair or Alteration of Real Property -- Miscellaneous Buildings, Maintenance, Repair or Alteration of Real Property -- Other Industrial Buildings, Maintenance, Repair or Alteration of Real Property -- Family Housing Facilities, and moreby Navy, Army Signed by year:2000: $591,223; 2001: $48,015; 2002: $0; 2003: $0; 2004: $0; 2005: $0; 2006: $0.
Biggest contracts:
$400,000 with Navy for Construction of Structures and Facilities -- Miscellaneous Buildings. Signed on 2000-07-10. Completion date: 2000-11-26.
$56,074 with Army for Maintenance, Repair or Alteration of Real Property -- Miscellaneous Buildings. Signed on 2000-02-11. Completion date: 2000-09-01.
$53,831 with Army for Maintenance, Repair or Alteration of Real Property -- Other Industrial Buildings. Signed on 2000-09-28. Completion date: 2000-04-03.
$31,872 with Army for Maintenance, Repair or Alteration of Real Property -- Miscellaneous Buildings. Signed on 2001-08-05. Completion date: 2001-11-15.
A L I IMAGING SYSTEMS CORP (1325 PICO STEET) : $546,281 in 9 contractsfrom 1999 to 2002
Contracts for X-Ray Equipment and Supplies: Medical, Dental, Veterinary, Maintenance, Repair and Rebuilding of Equipment -- Medical, Dental, and Veterinary Equipment and Supplies, ADP Software, Laboratory Testing Services, and moreby Defense Logistics Agency, Navy, Air Force, Department of Veterans Affairs, and others Signed by year:2000: $315,544; 2001: $129,687; 2002: $66,377; 2003: $0; 2004: $0; 2005: $0; 2006: $0.
Biggest contracts:
$243,458 with Defense Logistics Agency for X-Ray Equipment and Supplies: Medical, Dental, Veterinary. Signed on 2000-05-13. Completion date: 2000-07-10.
$52,758 with Navy for Maintenance, Repair and Rebuilding of Equipment -- Medical, Dental, and Veterinary Equipment and Supplies. Taking place in MD. Signed on 2001-10-15. Completion date: 2002-09-30.
$40,585 with Navy for ADP Software. Taking place in WI. Signed on 2001-10-26. Completion date: 2002-09-30.
$37,377 with Air Force for ADP Software. Signed on 2002-10-01. Completion date: 2002-11-05.
HOOSIER PLASTIC FABRICATION, I (1152 CALIFORNIA AVE; small business) : $143,159 in 10 contractsfrom 2004 to 2006
Contracts for Hardware, Weapon System, Miscellaneous Power Transmission Equipment, Electrical and Electronic assemblies, Boards, Cards, and Associated Hardware, Hose, Pipe, Tube, Lubrication, and Railing Fittings, and moreby Navy, Defense Logistics Agency, Army Signed by year:2000: $0; 2001: $0; 2002: $0; 2003: $0; 2004: $94,782; 2005: $35,127; 2006: $13,250.
Biggest contracts:
$80,995 with Navy for Hardware, Weapon System. Signed on 2004-03-29. Completion date: 2004-06-03.
$13,250 with Defense Logistics Agency for Miscellaneous Power Transmission Equipment. Signed on 2006-01-13. Completion date: 2006-03-02.
$12,443, same as above.Signed on 2005-03-02. Completion date: 2005-04-16.
$12,323, same as above.Signed on 2004-11-24. Completion date: 2005-01-08.
TANK SPECIALTIES, INC (1379 PICO ST STE 103; small business) : $108,329 in 2 contractsin 2003
$54,694 with Navy for Maintenance, Repair and Rebuilding of Equipment -- Fuels, Lubricants, Oils, and Waxes. Signed on 2003-08-07. Completion date: 2003-10-10.
$53,635, same as above.Signed on 2003-09-15. Completion date: 2003-11-17.
TEKLAM CORPORATION (1121 OLYMPIC DR; small business) : $78,196 in 5 contractsfrom 2003 to 2006
Contracts for Hardware, Commercial, Plywood and Veneer by Army Signed by year:2000: $0; 2001: $0; 2002: $0; 2003: $57,352; 2004: $0; 2005: $0; 2006: $20,844.
Biggest contracts:
$32,291 with Army for Hardware, Commercial. Signed on 2003-07-03. Completion date: 2003-08-01.
$20,844 with Army for Plywood and Veneer. Signed on 2006-02-21. Completion date: 2006-03-31.
$12,312 with Army for Hardware, Commercial. Signed on 2003-07-10. Completion date: 2003-09-25.
$10,924, same as above.Signed on 2003-05-02. Completion date: 2003-06-06.
FUTURA COMPANIES OF SOUTHERN C (1257 CONESTOGA CIR; small business) : $69,580 in 2 contractsin 2003
$55,535 with Navy for Preservative and Sealing Compounds. Signed on 2003-09-11. Completion date: 2003-10-11.
$14,045, same as above.Signed on 2003-05-21. Completion date: 2003-05-30.
LAMINATED SHIM COMPANY INC (1691 CALIFORNIA AVE; small business) : $38,540 in 4 contractsfrom 2000 to 2005
$25,760 with Defense Logistics Agency for Bushings, Rings, Shims, and Spacers. Signed on 2000-08-02. Completion date: 2000-09-01.
$4,605, same as above.Signed on 2004-10-30. Completion date: 2004-11-30.
$4,301, same as above.Signed on 2005-06-08. Completion date: 2005-07-08.
$3,874, same as above.Signed on 2005-11-29. Completion date: 2006-01-13.
TAYLOR SERVICES INC (1555 COLONY WAY; small business) 50 employees, $0 revenue
$33,606 with Navy for Non-nuclear Ship Repair (East) Ship repair (including overhauls and conversions) performed on non-nuclear propelled and nonpropelled ships east of the 108th meridian. Taking place in VA. Signed on 2004-10-29. Completion date: 2005-05-15.
AAA ROOFING BY GENE (19907 TEMESCAL CANYON RD; small business)
$18,600 with Army for Maintenance, Repair or Alteration of Real Property -- Miscellaneous Buildings. Signed on 2000-06-08. Completion date: 2000-07-19.
UNDERGROUND SERVICE ALERT OF S (1379 PICO ST STE 101) : $4,635 in 4 contractsfrom 2002 to 2005
$1,200 with Navy for Other Professional Services. Signed on 2002-10-07. Completion date: 2003-09-30.
$1,182 with Navy for Surveillance Services. Signed on 2004-09-30. Completion date: 2005-09-30.
$1,182 with Navy for Other Professional Services. Signed on 2003-09-25. Completion date: 2004-09-30.
$1,071 with Navy for Other Quality Control, Testing and Inspection Services -- Miscellaneous. Signed on 2005-09-28. Completion date: 2006-09-30.
Top industries in this zip code by the number of employees in 2005:
Management of Companies and Enterprises: Corporate, Subsidiary, and Regional Managing Offices (250-499 employees: 1 establishment, 50-99 employees: 2 establishments, 10-19 employees: 2 establishments, 1-4 employees: 1 establishment)
2005 - 2018 National Fire Incident Reporting System (NFIRS) incidents
According to the data from the years 2005 - 2018 the average number of fire incidents per year is 22. The highest number of fire incidents - 55 took place in 2009, and the least - 3 in 2006. The data has a declining trend.
When looking into fire subcategories, the most incidents belonged to: Outside Fires (44.1%), and Mobile Property/Vehicle Fires (29.6%).
Fire incident types reported to NFIRS in Zip Code 92881


 Nearest zip codes: 92879, 92882, 92883, 92503, 92860, 92505.


 According to the data from the years 2005 - 2018 the average number of fire incidents per year is 22. The highest number of fire incidents - 55 took place in 2009, and the least - 3 in 2006. The data has a declining trend.
 When looking into fire subcategories, the most incidents belonged to: Outside Fires (44.1%), and Mobile Property/Vehicle Fires (29.6%).