Estimated zip code population in 2022: 52,258 Zip code population in 2010: 47,672 Zip code population in 2000: 38,442
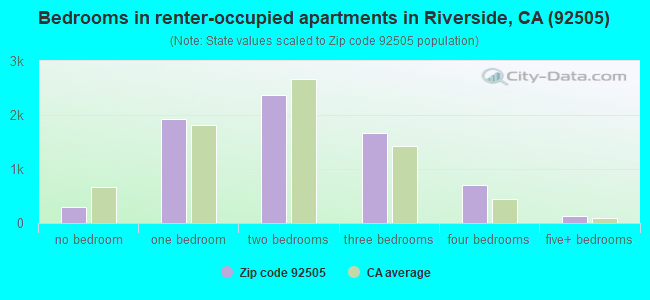
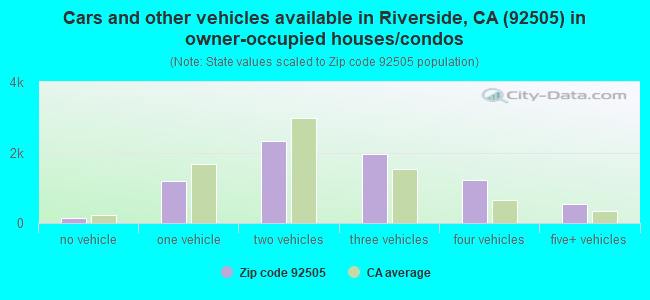
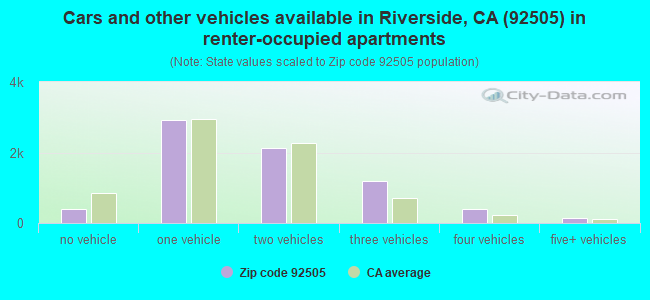
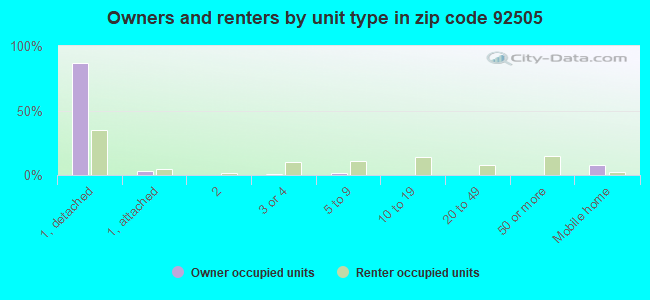
Houses and condos: 15,231 Renter-occupied apartments: 7,128
% of renters here:
49%
State:
44%
March 2022 cost of living index in zip code 92505: 82.5 (low, U.S. average is 100)
Land area: 12.2 sq. mi. Water area: 0.2 sq. mi.
Population density: 4,275 people per square mile
(average).
OSM Map
General Map
Google Map
MSN Map
OSM Map
General Map
Google Map
MSN Map
OSM Map
General Map
Google Map
MSN Map
OSM Map
General Map
Google Map
MSN Map
Please wait while loading the map...
Real estate property taxes paid for housing units in 2022:
This zip code:
0.6% ($3,245)
California:
0.7% ($4,831)
Median real estate property taxes paid for housing units with mortgages in 2022: $3,648 (0.7%) Median real estate property taxes paid for housing units with no mortgage in 2022: $2,196 (0.5%)
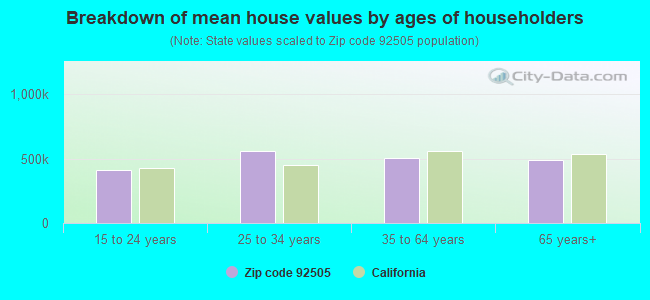
Estimated median house/condo value in 2022: $503,291
92505:
$503,291
California:
$715,900
According to our research of California and other state lists, there were 58 registered sex offenders living in 92505 zip code as of April 27, 2024. The ratio of all residents to sex offenders in zip code 92505 is 869 to 1. The ratio of registered sex offenders to all residents in this zip code is near the state average.
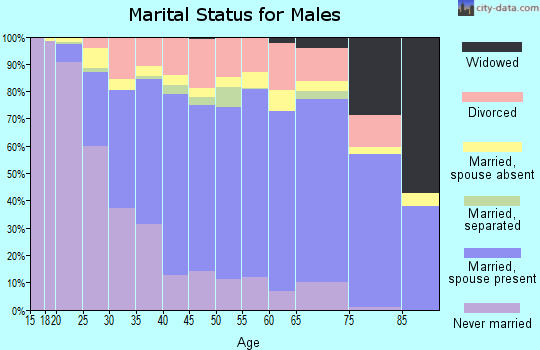
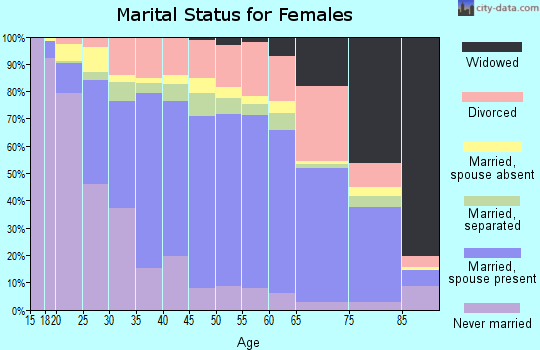
Median resident age:
This zip code:
33.9 years
California median age:
37.9 years
Average household size:
This zip code:
3.5 people
California:
2.8 people
Averages for the 2020 tax year for zip code 92505, filed in 2021:
Average Adjusted Gross Income (AGI) in 2020: $49,103 (Individual Income Tax Returns)
Here:
$49,103
State:
$95,910
Salary/wage: $46,323 (reported on 85.3% of returns)
Here:
$46,323
State:
$77,331
(% of AGI for various income ranges: 1203.9% for AGIs below $25k, 3936.4% for AGIs $25k-50k, 7757.8% for AGIs $50k-75k, 11365.4% for AGIs $75k-100k, 21062.9% for AGIs $100k-200k, 68967.8% for AGIs over 200k)
Taxable interest for individuals: $492 (reported on 23.2% of returns)
This zip code:
$492
California:
$2,294
(% of AGI for various income ranges: 5.2% for AGIs below $25k, 7.4% for AGIs $25k-50k, 20.8% for AGIs $50k-75k, 18.8% for AGIs $75k-100k, 55.0% for AGIs $100k-200k, 653.3% for AGIs over 200k)
Ordinary dividends: $1,738 (reported on 5.9% of returns)
Here:
$1,738
State:
$10,949
(% of AGI for various income ranges: 3.5% for AGIs below $25k, 5.2% for AGIs $25k-50k, 16.4% for AGIs $50k-75k, 25.6% for AGIs $75k-100k, 53.5% for AGIs $100k-200k, 635.6% for AGIs over 200k)
Net capital gain/loss in AGI: +$8,678 (reported on 6.7% of returns)
Here:
+$8,678
State:
+$49,306
(% of AGI for various income ranges: 1.4% for AGIs below $25k, 10.5% for AGIs $25k-50k, 12.0% for AGIs $50k-75k, 53.9% for AGIs $75k-100k, 224.3% for AGIs $100k-200k, 10702.2% for AGIs over 200k)
Profit/loss from business: +$8,719 (reported on 16.5% of returns)
Here:
+$8,719
State:
+$15,671
(% of AGI for various income ranges: 171.1% for AGIs below $25k, 159.7% for AGIs $25k-50k, 200.7% for AGIs $50k-75k, 203.2% for AGIs $75k-100k, 353.4% for AGIs $100k-200k, 3850.0% for AGIs over 200k)
Taxable individual retirement arrangement distribution: $15,716 (reported on 3.1% of returns)
92505:
$15,716
California:
$23,505
(% of AGI for various income ranges: 20.0% for AGIs below $25k, 25.2% for AGIs $25k-50k, 71.1% for AGIs $50k-75k, 135.5% for AGIs $75k-100k, 268.6% for AGIs $100k-200k, 2740.0% for AGIs over 200k)
Self-employed (Keogh) retirement plans: $28,500 (reported on 0.1% of returns)
92505:
$28,500
California:
$30,163
(% of AGI for various income ranges: 10.2% for AGIs $25k-50k)
Total itemized deductions: $28,657 (reported on 9.5% of returns)
Here:
$28,657
State:
$39,517
(% of AGI for various income ranges: 42.1% for AGIs below $25k, 139.9% for AGIs $25k-50k, 430.9% for AGIs $50k-75k, 896.0% for AGIs $75k-100k, 2053.8% for AGIs $100k-200k, 8532.2% for AGIs over 200k)
Charity contributions: $6,131 (reported on 7.7% of returns)
Here:
$6,131
State:
$12,598
(% of AGI for various income ranges: 2.8% for AGIs below $25k, 20.6% for AGIs $25k-50k, 61.3% for AGIs $50k-75k, 136.0% for AGIs $75k-100k, 394.5% for AGIs $100k-200k, 2140.0% for AGIs over 200k)
Taxes paid: $8,021 (reported on 9.4% of returns)
92505:
$8,021
State:
$8,807
(% of AGI for various income ranges: 9.6% for AGIs below $25k, 33.2% for AGIs $25k-50k, 116.6% for AGIs $50k-75k, 272.8% for AGIs $75k-100k, 625.2% for AGIs $100k-200k, 1940.0% for AGIs over 200k)
Earned income credit: $2,171 (reported on 19.8% of returns)
Here:
$2,171
State:
$2,074
(% of AGI for various income ranges: 98.9% for AGIs below $25k, 76.7% for AGIs $25k-50k, 1.7% for AGIs $50k-75k)
Percentage of individuals using paid preparers for their 2020 taxes: 93.4%
Here:
93%
State:
92%
(% for various income ranges: 92.4% for AGIs below $25k, 94.5% for AGIs $25k-50k, 93.5% for AGIs $50k-75k, 93.6% for AGIs $75k-100k, 93.0% for AGIs $100k-200k, 93.9% for AGIs over 200k)
Averages for the 2012 tax year for zip code 92505, filed in 2013:
Average Adjusted Gross Income (AGI) in 2012: $40,731 (Individual Income Tax Returns)
Here:
$40,731
State:
$72,726
Salary/wage: $38,914 (reported on 86.6% of returns)
Here:
$38,914
State:
$59,079
(% of AGI for various income ranges: 76.6% for AGIs below $25k, 86.7% for AGIs $25k-50k, 86.0% for AGIs $50k-75k, 86.4% for AGIs $75k-100k, 84.2% for AGIs $100k-200k, 52.3% for AGIs over 200k)
Taxable interest for individuals: $453 (reported on 23.9% of returns)
This zip code:
$453
California:
$2,146
(% of AGI for various income ranges: 0.4% for AGIs below $25k, 0.2% for AGIs $25k-50k, 0.2% for AGIs $50k-75k, 0.3% for AGIs $75k-100k, 0.2% for AGIs $100k-200k, 0.5% for AGIs over 200k)
Ordinary dividends: $1,700 (reported on 5.7% of returns)
Here:
$1,700
State:
$9,308
(% of AGI for various income ranges: 0.3% for AGIs below $25k, 0.1% for AGIs $25k-50k, 0.2% for AGIs $50k-75k, 0.2% for AGIs $75k-100k, 0.2% for AGIs $100k-200k, 0.9% for AGIs over 200k)
Net capital gain/loss in AGI: +$1,813 (reported on 4.7% of returns)
Here:
+$1,813
State:
+$30,460
(% of AGI for various income ranges: 0.3% for AGIs $75k-100k, 0.5% for AGIs $100k-200k, 1.8% for AGIs over 200k)
Profit/loss from business: +$9,014 (reported on 16.3% of returns)
Here:
+$9,014
State:
+$17,064
(% of AGI for various income ranges: 12.5% for AGIs below $25k, 3.7% for AGIs $25k-50k, 1.9% for AGIs $50k-75k, 0.7% for AGIs $75k-100k, 1.5% for AGIs $100k-200k, 1.4% for AGIs over 200k)
Taxable individual retirement arrangement distribution: $12,551 (reported on 4.2% of returns)
92505:
$12,551
California:
$19,557
(% of AGI for various income ranges: 1.2% for AGIs below $25k, 0.8% for AGIs $25k-50k, 1.2% for AGIs $50k-75k, 1.4% for AGIs $75k-100k, 2.2% for AGIs $100k-200k)
Self-employment retirement plans: $12,050 (reported on 0.2% of returns)
92505:
$12,050
California:
$24,530
Total itemized deductions: $22,435 (29% of AGI, reported on 28.2% of returns)
Here:
$22,435
State:
$34,004
Here:
29.3% of AGI
State:
22.7% of AGI
(% of AGI for various income ranges: 6.3% for AGIs below $25k, 11.9% for AGIs $25k-50k, 17.5% for AGIs $50k-75k, 18.5% for AGIs $75k-100k, 20.5% for AGIs $100k-200k, 22.2% for AGIs over 200k)
Charity contributions: $3,098 (reported on 23.0% of returns)
Here:
$3,098
State:
$4,659
(% of AGI for various income ranges: 0.4% for AGIs below $25k, 1.2% for AGIs $25k-50k, 1.9% for AGIs $50k-75k, 2.1% for AGIs $75k-100k, 2.8% for AGIs $100k-200k, 2.2% for AGIs over 200k)
Taxes paid: $6,126 (reported on 28.1% of returns)
92505:
$6,126
State:
$14,448
(% of AGI for various income ranges: 1.1% for AGIs below $25k, 2.3% for AGIs $25k-50k, 4.2% for AGIs $50k-75k, 5.3% for AGIs $75k-100k, 6.9% for AGIs $100k-200k, 8.6% for AGIs over 200k)
Earned income credit: $2,486 (reported on 26.6% of returns)
Here:
$2,486
State:
$2,286
(% of AGI for various income ranges: 8.4% for AGIs below $25k, 1.6% for AGIs $25k-50k)
Percentage of individuals using paid preparers for their 2012 taxes: 69.4%
Here:
69%
State:
64%
(% for various income ranges: 67.4% for AGIs below $25k, 71.7% for AGIs $25k-50k, 70.4% for AGIs $50k-75k, 70.5% for AGIs $75k-100k, 69.0% for AGIs $100k-200k, 81.8% for AGIs over 200k)
Averages for the 2004 tax year for zip code 92505, filed in 2005:
Average Adjusted Gross Income (AGI) in 2004: $37,366 (Individual Income Tax Returns)
Here:
$37,366
State:
$58,600
Salary/wage: $36,061 (reported on 89.6% of returns)
Here:
$36,061
State:
$49,455
(% of AGI for various income ranges: 145.5% for AGIs below $10k, 83.9% for AGIs $10k-25k, 90.1% for AGIs $25k-50k, 89.1% for AGIs $50k-75k, 89.1% for AGIs $75k-100k, 73.7% for AGIs over 100k)
Taxable interest for individuals: $673 (reported on 32.6% of returns)
This zip code:
$673
California:
$2,365
(% of AGI for various income ranges: 4.2% for AGIs below $10k, 0.6% for AGIs $10k-25k, 0.5% for AGIs $25k-50k, 0.4% for AGIs $50k-75k, 0.4% for AGIs $75k-100k, 0.8% for AGIs over 100k)
Taxable dividends: $949 (reported on 8.6% of returns)
Here:
$949
State:
$4,746
(% of AGI for various income ranges: 1.5% for AGIs below $10k, 0.2% for AGIs $10k-25k, 0.2% for AGIs $25k-50k, 0.1% for AGIs $50k-75k, 0.2% for AGIs $75k-100k, 0.3% for AGIs over 100k)
Net capital gain/loss: +$8,356 (reported on 7.7% of returns)
Here:
+$8,356
State:
+$23,418
(% of AGI for various income ranges: 0.9% for AGIs below $10k, -0.0% for AGIs $10k-25k, 0.2% for AGIs $25k-50k, 0.5% for AGIs $50k-75k, 1.0% for AGIs $75k-100k, 7.1% for AGIs over 100k)
Profit/loss from business: +$8,768 (reported on 14.8% of returns)
Here:
+$8,768
State:
+$16,826
(% of AGI for various income ranges: 6.2% for AGIs below $10k, 7.4% for AGIs $10k-25k, 2.9% for AGIs $25k-50k, 2.2% for AGIs $50k-75k, 2.3% for AGIs $75k-100k, 3.8% for AGIs over 100k)
IRA payment deduction: $2,732 (reported on 1.4% of returns)
92505:
$2,732
California:
$3,192
(% of AGI for various income ranges: 0.1% for AGIs $10k-25k, 0.1% for AGIs $25k-50k, 0.1% for AGIs $50k-75k, 0.1% for AGIs $75k-100k, 0.1% for AGIs over 100k)
Self-employed pension: $11,371 (reported on 0.2% of returns)
Here:
$11,371
California:
$17,688
Total itemized deductions: $20,737 (33% of AGI, reported on 37.1% of returns)
Here:
$20,737
State:
$28,113
Here:
32.5% of AGI
State:
25.3% of AGI
(% of AGI for various income ranges: 15.2% for AGIs below $10k, 11.2% for AGIs $10k-25k, 18.8% for AGIs $25k-50k, 23.7% for AGIs $50k-75k, 25.2% for AGIs $75k-100k, 22.7% for AGIs over 100k)
Charity contributions deductions: $2,779 (4% of AGI, reported on 32.2% of returns)
Here:
$2,779
State:
$3,923
Here:
4.2% of AGI
State:
3.3% of AGI
(% of AGI for various income ranges: 0.8% for AGIs below $10k, 1.0% for AGIs $10k-25k, 1.9% for AGIs $25k-50k, 2.7% for AGIs $50k-75k, 3.0% for AGIs $75k-100k, 3.2% for AGIs over 100k)
Total tax: $4,165 (reported on 67.8% of returns)
92505:
$4,165
State:
$10,761
(% of AGI for various income ranges: 4.4% for AGIs below $10k, 3.6% for AGIs $10k-25k, 5.1% for AGIs $25k-50k, 6.8% for AGIs $50k-75k, 8.5% for AGIs $75k-100k, 14.1% for AGIs over 100k)
Earned income credit: $1,843 (reported on 21.2% of returns)
Here:
$1,843
State:
$1,763
Percentage of individuals using paid preparers for their 2004 taxes: 70.5%
Here:
71%
State:
66%
(% for various income ranges: 61.8% for AGIs below $10k, 71.0% for AGIs $10k-25k, 73.6% for AGIs $25k-50k, 73.0% for AGIs $50k-75k, 72.3% for AGIs $75k-100k, 70.9% for AGIs over 100k)
Likely homosexual households (counted as self-reported same-sex unmarried-partner households)
Lesbian couples: 0.2% of all households
Gay men: 0.1% of all households
Household received Food Stamps/SNAP in the past 12 months: 1,778 Household did not receive Food Stamps/SNAP in the past 12 months: 12,780
Women who had a birth in the past 12 months: 659 (376 now married, 284 unmarried) Women who did not have a birth in the past 12 months: 13,240 (5,112 now married, 8,133 unmarried)
Housing units in zip code 92505 with a mortgage: 5,220 (324 second mortgage, 38 home equity loan, 154 both second mortgage and home equity loan) Houses without a mortgage: 74
Median monthly owner costs for units with a mortgage: $2,130 Median monthly owner costs for units without a mortgage: $585
Residents with income below the poverty level in 2022:
This zip code:
11.2%
Whole state:
12.2%
Residents with income below 50% of the poverty level in 2022:
This zip code:
6.7%
Whole state:
6.2%
Median number of rooms in houses and condos:
Here:
6.0
State:
6.0
Median number of rooms in apartments:
Here:
4.1
State:
3.9
Notable locations in this zip code not listed on our city pages
Notable locations in zip code 92505: La Sierra Branch Riverside City and County Public Library (A), Alford School Administration Center (B), World Museum of Natural History (C), Thaine B Price Science Complex (D), Stahl Center (E), South Hall (F), Sierra Towers (G), San Fernando Hall (H), City of Riverside Fire Department Station 8 La Sierra (I), Palmer Hall (J), La Sierra University Library (K), La Sierra Hall (L), Hole Memorial Auditorium (M), Gladwyn Hall (N), Christian Counseling Center (O), Calkins Hall Security Building (P), Brandstarter Gallery (Q), Angwin Hall (R), Ambs Hall (S). Display/hide their locations on the map
Shopping Centers: Five Points Shopping Center (1), Westgate Plaza Shopping Center (2), La Sierra Plaza Shopping Center (3), West Plaza Shopping Center (4). Display/hide their locations on the map
Churches in zip code 92505 include: Arlington Christian Church (A), Southeastern California Conference of Seventh Day Adventists (B), Sierra Vista Chapel (C), Ministerio Biblico Verbo Divino (D), Meier Chapel (E), Matheson Chapel (F), Celebration Church (G), La Sierra Community Church (H), Queen of Angels Church (I). Display/hide their locations on the map
Parks in zip code 92505 include: Glory of Gods Grace Sculpture (1), Clough Park (2), La Sierra Park (3), Myra Linn Park (4), Rancho Loma Park (5). Display/hide their locations on the map
7,338 married couples with children.
2,806 single-parent households (644 men, 2,162 women).
40.1% of residents of 92505 zip code speak English at home.
45.8% of residents speak Spanish at home (66% very well, 13% well, 14% not well, 7% not at all).
4.9% of residents speak other Indo-European language at home (60% very well, 28% well, 8% not well, 4% not at all).
7.1% of residents speak Asian or Pacific Island language at home (51% very well, 30% well, 16% not well, 4% not at all).
2.2% of residents speak other language at home (54% very well, 28% well, 10% not well, 7% not at all).
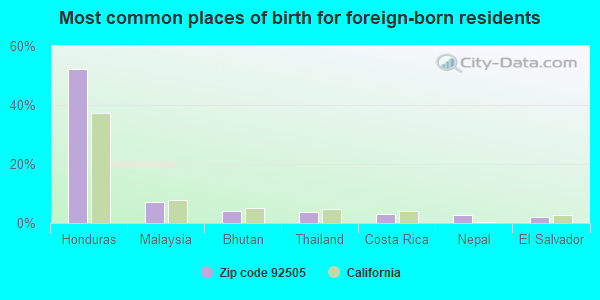
Foreign born population: 15,650 (29.9%) (62.5% of them are naturalized citizens)
Major facilities with environmental interests located in this zip code:
ALVORD UNIFIED SCHOOL DISTRICT (10365 KELLER AVE in RIVERSIDE, CA)
STATE MASTER (California - Hazardous Waste Tracking) - HAZARDOU WASTE PROGRAM COMPLIANCE ACTIVITY (Tracking inspections of insecticide, fungicide, and rodenticide, and toxic substances) Small Quantity Generators, between 100 kg and 1000 kg of hazardous waste/month (Resource Conservation and Recovery Act (tracking hazardous waste)) - notification Organizations: ALVORD UNFD SCHOOL DISTRICT (CONTACT/OWNER)
Alternative names: ALVORD UNIFIED SD
JIFFY LUBE #2337 (3693 LA SIERRA AVE in RIVERSIDE, CA)
(Resource Conservation and Recovery Act (tracking hazardous waste)) STATE MASTER (California - Used Oil Recycling System ) - USED OIL RECYCLING Organizations: QUAKER STATE MINIT LUBE INC (CONTACT/OWNER)
Alternative names: MINIT LUBE 1572
METAL CONTAINER CORPORATION (7155 CENTRAL AVE in RIVERSIDE, CA)
AIR MAJOR (AIRS/AFS) STATE MASTER (California - Hazardous Waste Tracking) - HAZARDOU WASTE PROGRAM CRITERIA AND HAZARDOUS AIR POLLUTANT INVENTORY (Inventory of air pollution sources) Small Quantity Generators, between 100 kg and 1000 kg of hazardous waste/month (Resource Conservation and Recovery Act (tracking hazardous waste)) - notification Business SIC classification: METAL CANS
ALLAN ORRENMAA ELEMENTARY SCHOOL (3350 FILLMORE ST in RIVERSIDE, CA)
(Geographic Names Information System) (National Center for Education Statistics) - STATE ID-6031496 Organizations: ALVORD UNIFIED (SCHOOL DISTRICT)
Alternative names: ORRENMAA (ALLAN) ELEMENTARY
KENNEDY (ROSEMARY) ELEMENTARY (6411 MITCHELL ST. in RIVERSIDE, CA)
(National Center for Education Statistics) - STATE ID-6116339 Organizations: ALVORD UNIFIED (SCHOOL DISTRICT)
LA GRANADA ELEMENTARY (10346 KELLER AVE. in RIVERSIDE, CA)
(National Center for Education Statistics) - STATE ID-6031546 Organizations: ALVORD UNIFIED (SCHOOL DISTRICT)
LA SIERRA HIGH (4145 LA SIERRA AVE. in RIVERSIDE, CA)
(National Center for Education Statistics) - STATE ID-3330008 Organizations: ALVORD UNIFIED (SCHOOL DISTRICT)
LOMA VISTA INTERMEDIATE (11050 ARLINGTON AVE. in RIVERSIDE, CA)
(National Center for Education Statistics) - STATE ID-6098156 Organizations: ALVORD UNIFIED (SCHOOL DISTRICT)
MCAULIFFE (S. CHRISTA) ELEMENTARY (4100 GOLDEN AVE. in RIVERSIDE, CA)
(National Center for Education Statistics) - STATE ID-6106074 Organizations: ALVORD UNIFIED (SCHOOL DISTRICT)
MYRA LINN ELEMENTARY (10435 BRANIGAN WAY in RIVERSIDE, CA)
(National Center for Education Statistics) - STATE ID-6031553 Organizations: ALVORD UNIFIED (SCHOOL DISTRICT)
ENERGY FUELS EXPLORATION MULE MT PROJ (SUITE 900 1515 ARAPAHOE STREET in RIVERSIDE, CA)
(Resource Conservation and Recovery Act (tracking hazardous waste)) Organizations: ENERGY FUELS EXPLORATION COMPANY (CONTACT/OWNER)
ADAMS SERVICE (11035 WELLS AVE in RIVERSIDE, CA)
Small Quantity Generators, between 100 kg and 1000 kg of hazardous waste/month (Resource Conservation and Recovery Act (tracking hazardous waste)) Organizations: BOB ADAMS (CONTACT/OWNER)
GEMCO #800 (10471 MAGNOLIA AVE in RIVERSIDE, CA)
Small Quantity Generators, between 100 kg and 1000 kg of hazardous waste/month (Resource Conservation and Recovery Act (tracking hazardous waste)) Organizations: LUCKY, INC (CONTACT/OWNER)
Housing units lacking complete plumbing facilities: 0.4% Housing units lacking complete kitchen facilities: 1.9%
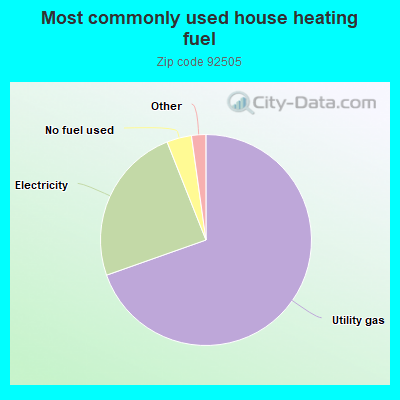
69.6%Utility gas
24.4%Electricity
3.8%No fuel used
0.9%Bottled, tank, or LP gas
0.5%Wood
Population in 1990: 37,420. Population change in the 1990s: +1,022 (+2.7%).
Place of birth for U.S.-born residents:
This state: 32,115
Northeast: 832
Midwest: 1,383
South: 1,192
West: 646
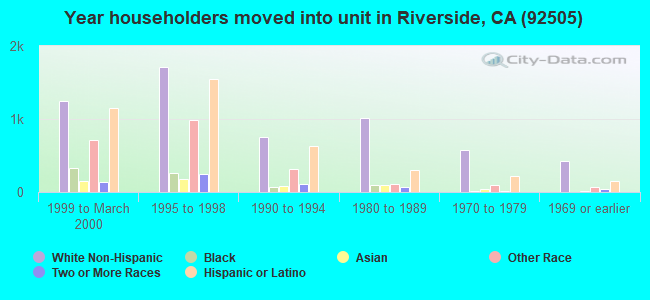
47% of the 92505 zip code residents lived in the same house 5 years ago. Out of people who lived in different houses, 66% lived in this county. Out of people who lived in different counties, 50% lived in California.
91% of the 92505 zip code residents lived in the same house 1 year ago. Out of people who lived in different houses, 49% moved from this county. Out of people who lived in different houses, 39% moved from different county within same state. Out of people who lived in different houses, 7% moved from different state. Out of people who lived in different houses, 6% moved from abroad.
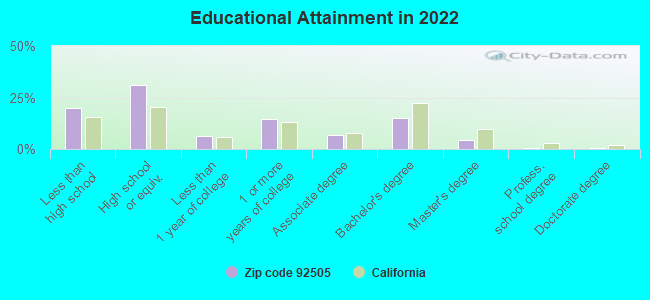
Private vs. public school enrollment:
Students in private schools in grades 1 to 8 (elementary and middle school): 440
Here:
7.5%
California:
10.5%
Students in private schools in grades 9 to 12 (high school): 121
Here:
3.5%
California:
8.5%
Students in private undergraduate colleges: 699
Here:
19.8%
California:
15.9%
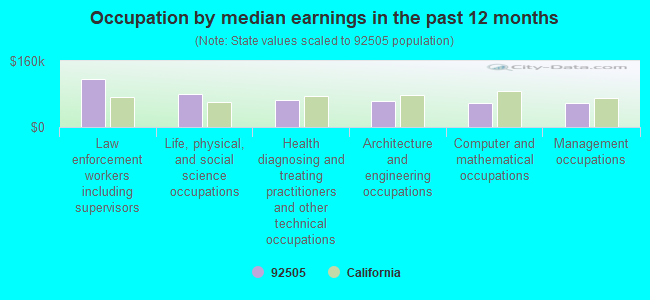
Occupation by median earnings in the past 12 months ($)
115,731Law enforcement workers including supervisors
79,729Life, physical, and social science occupations
64,975Health diagnosing and treating practitioners and other technical occupations
63,522Architecture and engineering occupations
58,763Computer and mathematical occupations
57,626Management occupations
Companies with federal contracts located in this zip code (RIVERSIDE, CA):
ENVIRONMENTAL ASSESMENT AND RE (4097 TRAIL CREEK ROAD; small business) : $12,832,577 in 97 contractsfrom 2003 to 2006
Contracts for Maintenance, Repair or Alteration of Real Property -- Airport Terminals, Maintenance, Repair or Alteration of Real Property -- Highways, Roads, Streets, Bridges, and Railways (includes resurfacing), Construction of Structures and Facilities -- Other Non-Building Facilities, Maintenance, Repair or Alteration of Real Property -- Miscellaneous Buildings, and moreby Navy, Army, Minerals Management Service, Office of Policy, Management and Budget/Chief Financial Officer, and others Signed by year:2000: $0; 2001: $0; 2002: $0; 2003: $1,408,846; 2004: $4,644,158; 2005: $5,519,352; 2006: $1,260,221.
Biggest contracts:
$1,057,735 with Navy for Maintenance, Repair or Alteration of Real Property -- Airport Terminals. Signed on 2005-09-22. Completion date: 2006-06-04.
$998,683 with Navy for Maintenance, Repair or Alteration of Real Property -- Highways, Roads, Streets, Bridges, and Railways (includes resurfacing). Signed on 2004-09-30. Completion date: 2005-04-13.
$945,500 with Navy for Construction of Structures and Facilities -- Other Non-Building Facilities. Signed on 2005-09-30. Completion date: 2005-03-30.
$874,722 with Army for Maintenance, Repair or Alteration of Real Property -- Miscellaneous Buildings. Signed on 2006-06-29. Completion date: 2007-06-15.
VERSATILE INFORMATION PRODUCTS (3630 PARK SIERRA DR; small business) : $30,573 in 2 contractsfrom 2003 to 2006
$25,142 with Navy for ADP Support Equipment. Signed on 2006-05-31. Completion date: 2006-09-07.
$5,431 with Army for ADP Software. Signed on 2003-07-25. Completion date: 2003-08-07.
R JENSEN COMPANY (10752 CAMPBELL AVE; small business)
$15,000 with Army for Construction of Structures and Facilities -- Office Buildings. Signed on 2003-09-22. Completion date: 2003-12-30.
MARK GINGERELLA (3870 LA SIERRA AVENUE; small business) : $7,775 in 2 contractsin 2005
$5,000 with Army for Preservative and Sealing Compounds. Signed on 2005-06-30. Completion date: 2005-07-11.
$2,775, same as above.Signed on 2005-04-14. Completion date: 2005-04-18.
ER BLOCK PLUMBING (10910 HOLE AV; small business)
$4,800 with Army for Maintenance, Repair or Alteration of Real Property -- Other Warehouse Buildings. Signed on 2005-04-22. Completion date: 2005-02-26.
Top industries in this zip code by the number of employees in 2005:
Health Care and Social Assistance: Offices of Physicians (except Mental Health Specialists) (over 1000 employees: 1 establishment, 10-19 employees: 1 establishment, 5-9 employees: 4 establishments, 1-4 employees: 7 establishments)
Health Care and Social Assistance: General Medical and Surgical Hospitals (over 1000: 1)
2005 - 2018 National Fire Incident Reporting System (NFIRS) incidents
According to the data from the years 2005 - 2018 the average number of fires per year is 53. The highest number of fire incidents - 103 took place in 2005, and the least - 3 in 2018. The data has a dropping trend.
When looking into fire subcategories, the most incidents belonged to: Outside Fires (52.6%), and Structure Fires (28.7%).
Fire incident types reported to NFIRS in Zip Code 92505


 Nearest zip codes: 92860, 92879, 91752, 92503, 92509, 92504.


 According to the data from the years 2005 - 2018 the average number of fires per year is 53. The highest number of fire incidents - 103 took place in 2005, and the least - 3 in 2018. The data has a dropping trend.
 When looking into fire subcategories, the most incidents belonged to: Outside Fires (52.6%), and Structure Fires (28.7%).