Estimated zip code population in 2022: 87,881 Zip code population in 2010: 84,519 Zip code population in 2000: 71,670
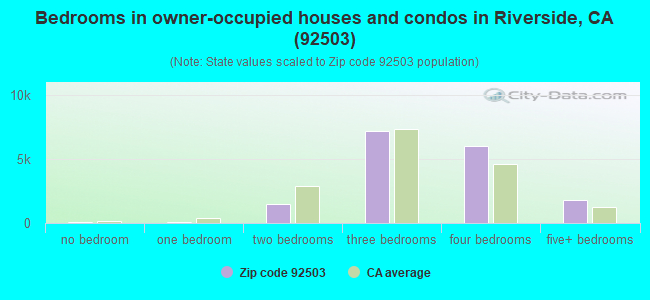
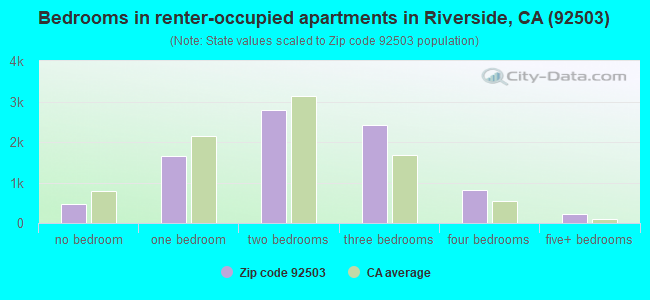
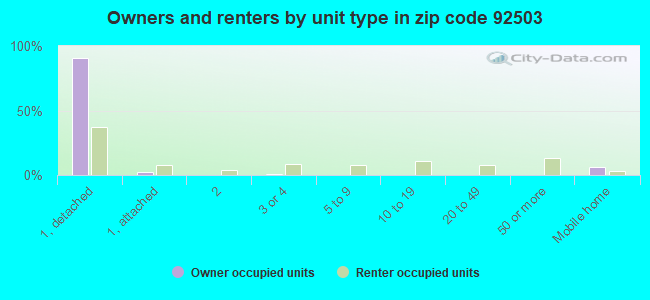
Houses and condos: 26,038 Renter-occupied apartments: 8,395
% of renters here:
34%
State:
44%
March 2022 cost of living index in zip code 92503: 82.3 (low, U.S. average is 100)
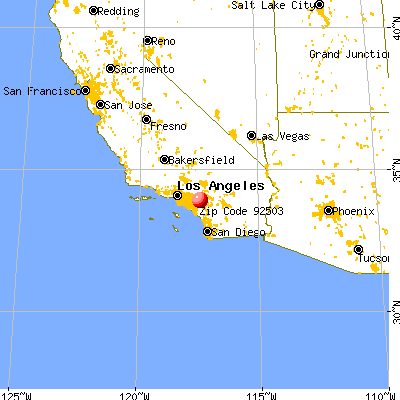
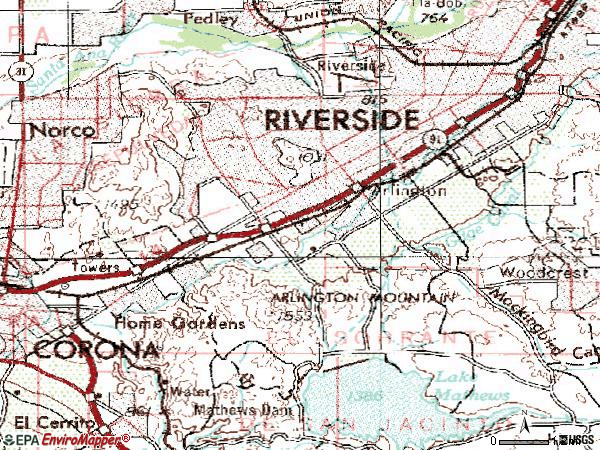
Land area: 29.9 sq. mi. Water area: 4.2 sq. mi.
Population density: 2,942 people per square mile
(average).
OSM Map
General Map
Google Map
MSN Map
OSM Map
General Map
Google Map
MSN Map
OSM Map
General Map
Google Map
MSN Map
OSM Map
General Map
Google Map
MSN Map
Please wait while loading the map...
Real estate property taxes paid for housing units in 2022:
This zip code:
0.7% ($3,507)
California:
0.7% ($4,831)
Median real estate property taxes paid for housing units with mortgages in 2022: $3,914 (0.7%) Median real estate property taxes paid for housing units with no mortgage in 2022: $2,212 (0.5%)
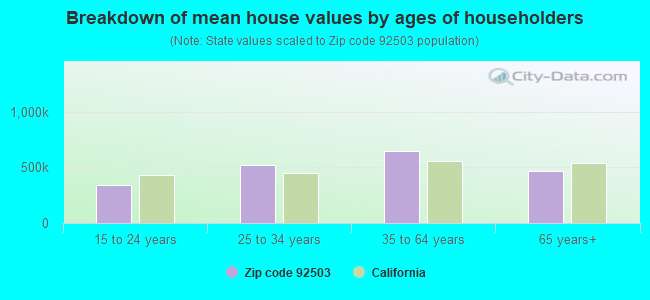
Estimated median house/condo value in 2022: $531,197
92503:
$531,197
California:
$715,900
According to our research of California and other state lists, there were 97 registered sex offenders living in 92503 zip code as of April 27, 2024. The ratio of all residents to sex offenders in zip code 92503 is 983 to 1. The ratio of registered sex offenders to all residents in this zip code is lower than the state average.
Median resident age:
This zip code:
35.1 years
California median age:
37.9 years
Average household size:
This zip code:
3.5 people
California:
2.8 people
Averages for the 2020 tax year for zip code 92503, filed in 2021:
Average Adjusted Gross Income (AGI) in 2020: $58,401 (Individual Income Tax Returns)
Here:
$58,401
State:
$95,910
Salary/wage: $53,148 (reported on 85.4% of returns)
Here:
$53,148
State:
$77,331
(% of AGI for various income ranges: 1255.0% for AGIs below $25k, 3930.8% for AGIs $25k-50k, 7590.8% for AGIs $50k-75k, 11336.0% for AGIs $75k-100k, 21099.9% for AGIs $100k-200k, 74181.8% for AGIs over 200k)
Taxable interest for individuals: $612 (reported on 28.1% of returns)
This zip code:
$612
California:
$2,294
(% of AGI for various income ranges: 6.1% for AGIs below $25k, 7.9% for AGIs $25k-50k, 13.3% for AGIs $50k-75k, 29.0% for AGIs $75k-100k, 56.2% for AGIs $100k-200k, 818.2% for AGIs over 200k)
Ordinary dividends: $2,551 (reported on 7.6% of returns)
Here:
$2,551
State:
$10,949
(% of AGI for various income ranges: 5.1% for AGIs below $25k, 6.3% for AGIs $25k-50k, 19.0% for AGIs $50k-75k, 31.5% for AGIs $75k-100k, 96.3% for AGIs $100k-200k, 760.2% for AGIs over 200k)
Net capital gain/loss in AGI: +$11,774 (reported on 8.5% of returns)
Here:
+$11,774
State:
+$49,306
(% of AGI for various income ranges: 4.3% for AGIs below $25k, 9.1% for AGIs $25k-50k, 34.1% for AGIs $50k-75k, 76.5% for AGIs $75k-100k, 332.7% for AGIs $100k-200k, 7346.0% for AGIs over 200k)
Profit/loss from business: +$9,938 (reported on 15.9% of returns)
Here:
+$9,938
State:
+$15,671
(% of AGI for various income ranges: 150.5% for AGIs below $25k, 153.7% for AGIs $25k-50k, 189.0% for AGIs $50k-75k, 280.6% for AGIs $75k-100k, 370.1% for AGIs $100k-200k, 3360.0% for AGIs over 200k)
Taxable individual retirement arrangement distribution: $18,799 (reported on 3.5% of returns)
92503:
$18,799
California:
$23,505
(% of AGI for various income ranges: 19.9% for AGIs below $25k, 29.8% for AGIs $25k-50k, 88.0% for AGIs $50k-75k, 157.3% for AGIs $75k-100k, 386.4% for AGIs $100k-200k, 1499.2% for AGIs over 200k)
Self-employed (Keogh) retirement plans: $30,522 (reported on 0.2% of returns)
92503:
$30,522
California:
$30,163
(% of AGI for various income ranges: 3.4% for AGIs $25k-50k, 608.5% for AGIs over 200k)
Total itemized deductions: $31,326 (reported on 13.1% of returns)
Here:
$31,326
State:
$39,517
(% of AGI for various income ranges: 42.0% for AGIs below $25k, 155.5% for AGIs $25k-50k, 527.4% for AGIs $50k-75k, 1071.8% for AGIs $75k-100k, 2596.8% for AGIs $100k-200k, 9897.2% for AGIs over 200k)
Charity contributions: $6,844 (reported on 11.0% of returns)
Here:
$6,844
State:
$12,598
(% of AGI for various income ranges: 2.5% for AGIs below $25k, 18.0% for AGIs $25k-50k, 66.9% for AGIs $50k-75k, 166.0% for AGIs $75k-100k, 478.0% for AGIs $100k-200k, 2719.0% for AGIs over 200k)
Taxes paid: $8,547 (reported on 13.0% of returns)
92503:
$8,547
State:
$8,807
(% of AGI for various income ranges: 9.7% for AGIs below $25k, 37.1% for AGIs $25k-50k, 147.5% for AGIs $50k-75k, 318.4% for AGIs $75k-100k, 783.1% for AGIs $100k-200k, 2136.5% for AGIs over 200k)
Earned income credit: $2,139 (reported on 18.0% of returns)
Here:
$2,139
State:
$2,074
(% of AGI for various income ranges: 93.2% for AGIs below $25k, 75.4% for AGIs $25k-50k, 1.6% for AGIs $50k-75k)
Percentage of individuals using paid preparers for their 2020 taxes: 93.6%
Here:
94%
State:
92%
(% for various income ranges: 92.8% for AGIs below $25k, 94.0% for AGIs $25k-50k, 94.0% for AGIs $50k-75k, 93.8% for AGIs $75k-100k, 93.9% for AGIs $100k-200k, 94.9% for AGIs over 200k)
Averages for the 2012 tax year for zip code 92503, filed in 2013:
Average Adjusted Gross Income (AGI) in 2012: $46,182 (Individual Income Tax Returns)
Here:
$46,182
State:
$72,726
Salary/wage: $43,400 (reported on 85.8% of returns)
Here:
$43,400
State:
$59,079
(% of AGI for various income ranges: 76.3% for AGIs below $25k, 84.5% for AGIs $25k-50k, 85.1% for AGIs $50k-75k, 82.9% for AGIs $75k-100k, 83.2% for AGIs $100k-200k, 62.0% for AGIs over 200k)
Taxable interest for individuals: $534 (reported on 27.9% of returns)
This zip code:
$534
California:
$2,146
(% of AGI for various income ranges: 0.4% for AGIs below $25k, 0.2% for AGIs $25k-50k, 0.2% for AGIs $50k-75k, 0.3% for AGIs $75k-100k, 0.3% for AGIs $100k-200k, 0.7% for AGIs over 200k)
Ordinary dividends: $3,060 (reported on 7.6% of returns)
Here:
$3,060
State:
$9,308
(% of AGI for various income ranges: 0.4% for AGIs below $25k, 0.3% for AGIs $25k-50k, 0.3% for AGIs $50k-75k, 0.3% for AGIs $75k-100k, 0.3% for AGIs $100k-200k, 2.0% for AGIs over 200k)
Net capital gain/loss in AGI: +$4,276 (reported on 6.6% of returns)
Here:
+$4,276
State:
+$30,460
(% of AGI for various income ranges: 0.1% for AGIs $50k-75k, 0.3% for AGIs $75k-100k, 0.4% for AGIs $100k-200k, 4.1% for AGIs over 200k)
Profit/loss from business: +$11,084 (reported on 16.2% of returns)
Here:
+$11,084
State:
+$17,064
(% of AGI for various income ranges: 11.9% for AGIs below $25k, 4.1% for AGIs $25k-50k, 2.2% for AGIs $50k-75k, 2.3% for AGIs $75k-100k, 1.8% for AGIs $100k-200k, 3.9% for AGIs over 200k)
Taxable individual retirement arrangement distribution: $14,638 (reported on 4.5% of returns)
92503:
$14,638
California:
$19,557
(% of AGI for various income ranges: 1.1% for AGIs below $25k, 1.0% for AGIs $25k-50k, 1.3% for AGIs $50k-75k, 1.7% for AGIs $75k-100k, 1.6% for AGIs $100k-200k, 2.0% for AGIs over 200k)
Self-employment retirement plans: $21,414 (reported on 0.2% of returns)
92503:
$21,414
California:
$24,530
(% of AGI for various income ranges: 0.6% for AGIs over 200k)
Total itemized deductions: $24,806 (29% of AGI, reported on 32.8% of returns)
Here:
$24,806
State:
$34,004
Here:
28.5% of AGI
State:
22.7% of AGI
(% of AGI for various income ranges: 7.1% for AGIs below $25k, 12.8% for AGIs $25k-50k, 18.9% for AGIs $50k-75k, 21.2% for AGIs $75k-100k, 22.5% for AGIs $100k-200k, 20.6% for AGIs over 200k)
Charity contributions: $3,185 (reported on 27.0% of returns)
Here:
$3,185
State:
$4,659
(% of AGI for various income ranges: 0.4% for AGIs below $25k, 1.1% for AGIs $25k-50k, 1.8% for AGIs $50k-75k, 2.3% for AGIs $75k-100k, 2.6% for AGIs $100k-200k, 2.7% for AGIs over 200k)
Taxes paid: $7,378 (reported on 32.7% of returns)
92503:
$7,378
State:
$14,448
(% of AGI for various income ranges: 1.3% for AGIs below $25k, 2.6% for AGIs $25k-50k, 4.7% for AGIs $50k-75k, 6.0% for AGIs $75k-100k, 7.8% for AGIs $100k-200k, 8.6% for AGIs over 200k)
Earned income credit: $2,513 (reported on 24.9% of returns)
Here:
$2,513
State:
$2,286
(% of AGI for various income ranges: 8.3% for AGIs below $25k, 1.6% for AGIs $25k-50k)
Percentage of individuals using paid preparers for their 2012 taxes: 70.8%
Here:
71%
State:
64%
(% for various income ranges: 68.6% for AGIs below $25k, 72.0% for AGIs $25k-50k, 72.6% for AGIs $50k-75k, 74.1% for AGIs $75k-100k, 71.5% for AGIs $100k-200k, 77.4% for AGIs over 200k)
Averages for the 2004 tax year for zip code 92503, filed in 2005:
Average Adjusted Gross Income (AGI) in 2004: $41,479 (Individual Income Tax Returns)
Here:
$41,479
State:
$58,600
Salary/wage: $39,604 (reported on 89.0% of returns)
Here:
$39,604
State:
$49,455
(% of AGI for various income ranges: 117.8% for AGIs below $10k, 82.7% for AGIs $10k-25k, 88.5% for AGIs $25k-50k, 89.3% for AGIs $50k-75k, 88.9% for AGIs $75k-100k, 75.2% for AGIs over 100k)
Taxable interest for individuals: $679 (reported on 36.2% of returns)
This zip code:
$679
California:
$2,365
(% of AGI for various income ranges: 2.9% for AGIs below $10k, 0.8% for AGIs $10k-25k, 0.4% for AGIs $25k-50k, 0.4% for AGIs $50k-75k, 0.4% for AGIs $75k-100k, 0.8% for AGIs over 100k)
Taxable dividends: $1,338 (reported on 10.7% of returns)
Here:
$1,338
State:
$4,746
(% of AGI for various income ranges: 1.2% for AGIs below $10k, 0.4% for AGIs $10k-25k, 0.2% for AGIs $25k-50k, 0.2% for AGIs $50k-75k, 0.2% for AGIs $75k-100k, 0.6% for AGIs over 100k)
Net capital gain/loss: +$8,608 (reported on 8.7% of returns)
Here:
+$8,608
State:
+$23,418
(% of AGI for various income ranges: -1.8% for AGIs below $10k, 0.0% for AGIs $10k-25k, 0.2% for AGIs $25k-50k, 0.4% for AGIs $50k-75k, 0.7% for AGIs $75k-100k, 5.9% for AGIs over 100k)
Profit/loss from business: +$10,818 (reported on 14.4% of returns)
Here:
+$10,818
State:
+$16,826
(% of AGI for various income ranges: 6.2% for AGIs below $10k, 7.0% for AGIs $10k-25k, 3.4% for AGIs $25k-50k, 2.3% for AGIs $50k-75k, 2.3% for AGIs $75k-100k, 4.5% for AGIs over 100k)
IRA payment deduction: $3,008 (reported on 1.6% of returns)
92503:
$3,008
California:
$3,192
(% of AGI for various income ranges: 0.1% for AGIs $10k-25k, 0.1% for AGIs $25k-50k, 0.1% for AGIs $50k-75k, 0.1% for AGIs $75k-100k, 0.1% for AGIs over 100k)
Self-employed pension: $15,041 (reported on 0.4% of returns)
Here:
$15,041
California:
$17,688
(% of AGI for various income ranges: 0.1% for AGIs $25k-50k, 0.0% for AGIs $50k-75k, 0.1% for AGIs $75k-100k, 0.4% for AGIs over 100k)
Total itemized deductions: $22,798 (33% of AGI, reported on 41.1% of returns)
Here:
$22,798
State:
$28,113
Here:
32.7% of AGI
State:
25.3% of AGI
(% of AGI for various income ranges: 14.8% for AGIs below $10k, 11.1% for AGIs $10k-25k, 23.2% for AGIs $25k-50k, 25.8% for AGIs $50k-75k, 26.0% for AGIs $75k-100k, 22.7% for AGIs over 100k)
Charity contributions deductions: $2,705 (4% of AGI, reported on 36.0% of returns)
Here:
$2,705
State:
$3,923
Here:
3.7% of AGI
State:
3.3% of AGI
(% of AGI for various income ranges: 0.8% for AGIs below $10k, 0.9% for AGIs $10k-25k, 1.8% for AGIs $25k-50k, 2.6% for AGIs $50k-75k, 3.0% for AGIs $75k-100k, 3.0% for AGIs over 100k)
Total tax: $5,122 (reported on 68.1% of returns)
92503:
$5,122
State:
$10,761
(% of AGI for various income ranges: 3.9% for AGIs below $10k, 3.6% for AGIs $10k-25k, 4.9% for AGIs $25k-50k, 6.6% for AGIs $50k-75k, 8.4% for AGIs $75k-100k, 15.2% for AGIs over 100k)
Earned income credit: $1,872 (reported on 19.6% of returns)
Here:
$1,872
State:
$1,763
Percentage of individuals using paid preparers for their 2004 taxes: 71.4%
Here:
71%
State:
66%
(% for various income ranges: 62.6% for AGIs below $10k, 72.2% for AGIs $10k-25k, 73.6% for AGIs $25k-50k, 74.4% for AGIs $50k-75k, 71.7% for AGIs $75k-100k, 74.1% for AGIs over 100k)
Likely homosexual households (counted as self-reported same-sex unmarried-partner households)
Lesbian couples: 0.1% of all households
Gay men: 0.1% of all households
Household received Food Stamps/SNAP in the past 12 months: 3,131 Household did not receive Food Stamps/SNAP in the past 12 months: 21,793
Women who had a birth in the past 12 months: 946 (668 now married, 277 unmarried) Women who did not have a birth in the past 12 months: 20,812 (8,661 now married, 12,133 unmarried)
Housing units in zip code 92503 with a mortgage: 12,557 (716 second mortgage, 13 home equity loan, 477 both second mortgage and home equity loan) Houses without a mortgage: 132
Median monthly owner costs for units with a mortgage: $2,268 Median monthly owner costs for units without a mortgage: $606
Residents with income below the poverty level in 2022:
This zip code:
11.6%
Whole state:
12.2%
Residents with income below 50% of the poverty level in 2022:
This zip code:
7.0%
Whole state:
6.2%
Median number of rooms in houses and condos:
Here:
6.2
State:
6.0
Median number of rooms in apartments:
Here:
4.2
State:
3.9
Notable locations in this zip code not listed on our city pages
Notable locations in zip code 92503: Juvenile Hall (A), Van Buren Drive-In (B), Van Buren Golf Center (C), Arlington Plaza (D), Arlington Water Plant Number 2 (E), American Medical Response Sterling (F), Riverside County Fire Department Station 82 - Lake Hills (G), Arlington Branch Riverside City and County Public Library (H), City of Riverside Fire Department Station 12 La Sierra South (I), City of Riverside Fire Department Station 7 Arlanza (J), City of Riverside Fire Department Station 2 Arlington (K), Rainbow Christian Center Riverside Dream Center (L). Display/hide their locations on the map
Shopping Centers: Van Buren Plaza I Shopping Center (1), Van Buren Plaza Shopping Center (2), Nexus Towncenter Shopping Center (3), Tyler Village Shopping Center (4), Tyler Mall Galleria Shopping Center (5), The Brickyard-Riverside Shopping Center (6). Display/hide their locations on the map
Churches in zip code 92503 include: Arlington Apostolic Church (A), Yahweh House of Worship (B), Sierra Vista Baptist Church (C), Riverside Temple Hindu Society of Inland Empire (D), Riverside Korean Baptist Church (E), Riverside Baptist Church (F), Praise Community Fellowship Church (G), Pentecostal Full Gospel Fellowship Church (H), Arlanza Baptist Church (I). Display/hide their locations on the map
Parks in zip code 92503 include: Hunt Park (1), Arlington Park (2), California Citrus State Historic Park (3), Chalen Hill Park (4), Don Lorenzi Park (5), El Dorado Park (6), Harrison Park (7), John Bryant Park (8), Agricultural Park (9). Display/hide their locations on the map
13,140 married couples with children.
5,313 single-parent households (1,797 men, 3,516 women).
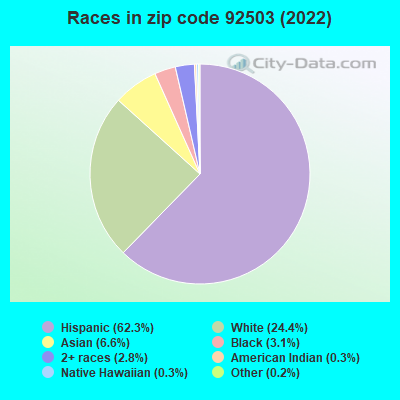
45.7% of residents of 92503 zip code speak English at home.
45.3% of residents speak Spanish at home (67% very well, 13% well, 14% not well, 6% not at all).
2.1% of residents speak other Indo-European language at home (56% very well, 31% well, 11% not well, 2% not at all).
4.6% of residents speak Asian or Pacific Island language at home (52% very well, 28% well, 18% not well, 2% not at all).
1.9% of residents speak other language at home (71% very well, 20% well, 9% not well).
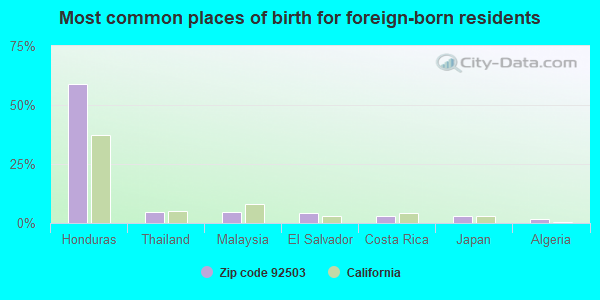
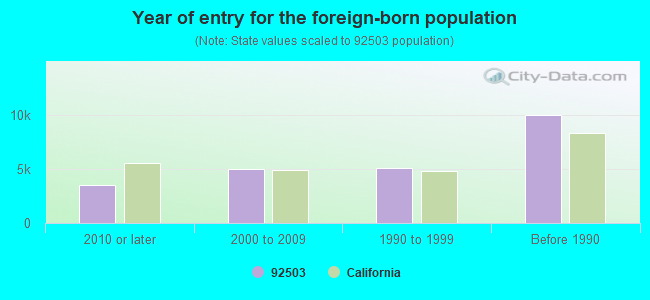
Foreign born population: 23,197 (26.4%) (62.6% of them are naturalized citizens)
Major facilities with environmental interests located in this zip code:
HYDROSEAL POLYMERS INCORPORATED (12151 MADERA WAY in RIVERSIDE, CA)
AIR MAJOR (AIRS/AFS) STATE MASTER (California - Hazardous Waste Tracking) - HAZARDOU WASTE PROGRAM CRITERIA AND HAZARDOUS AIR POLLUTANT INVENTORY (Inventory of air pollution sources) HAZARDOUS WASTE BIENNIAL REPORTER (Resource Conservation and Recovery Act (tracking hazardous waste)) Large Quantity Generators, more that 1000 kg of hazardous waste/month (Resource Conservation and Recovery Act (tracking hazardous waste)) TRI REPORTER (Tracking of toxic chemicals releasing facilities) Business SIC classification: PLASTICS MATERIALS, SYNTHETIC RESINS, AND NONVULCANIZABLE ELASTOMERS Business NAICS classification: PLASTICS MATERIAL AND RESIN MANUFACTURING.; PLASTICS MATERIAL AND RESIN MANUFACTURING. Organizations: HUNSAKER - FAMILY TRUST (CONTACT/OWNER)
FLEETWOOD ENTERPRISES INCORPORATED (3125 MYERS STREET in RIVERSIDE, CA)
STATE MASTER (California - Hazardous Waste Tracking) - HAZARDOU WASTE PROGRAM CRITERIA AND HAZARDOUS AIR POLLUTANT INVENTORY (Inventory of air pollution sources) Large Quantity Generators, more that 1000 kg of hazardous waste/month (Resource Conservation and Recovery Act (tracking hazardous waste)) - notification Business SIC classification: MOTOR HOMES
HAMBLIN'S BODY AND PAINT SHOP (7590 CYPRESS AVENUE in RIVERSIDE, CA)
STATE MASTER (California - Hazardous Waste Tracking) - HAZARDOU WASTE PROGRAM ENFORCEMENT/COMPLIANCE ACTIVITY (Integrated Compliance Information System) Small Quantity Generators, between 100 kg and 1000 kg of hazardous waste/month (Resource Conservation and Recovery Act (tracking hazardous waste)) Business NAICS classification: GENERAL AUTOMOTIVE REPAIR.
MARK GARCIA TRUCKING (12845 MAGNOLIA AVE in RIVERSIDE, CA)
STATE MASTER (California - Hazardous Waste Tracking) - HAZARDOU WASTE PROGRAM TRANSPORTER (Resource Conservation and Recovery Act (tracking hazardous waste)) - notification Alternative names: CHRISTOFFERSON TRANSPORTATION INC
ALVORD CONTINUATION HIGH SCHOOL (3606 PIERCE ST in RIVERSIDE, CA)
(Geographic Names Information System) (National Center for Education Statistics) - STATE ID-3337128 Organizations: ALVORD UNIFIED (SCHOOL DISTRICT)
JACKSON ELEMENTARY (4585 JACKSON ST. in RIVERSIDE, CA)
(National Center for Education Statistics) - STATE ID-6032650 Organizations: RIVERSIDE UNIFIED (SCHOOL DISTRICT)
NORTE VISTA HIGH (6585 CREST AVE. in RIVERSIDE, CA)
(National Center for Education Statistics) - STATE ID-3334299 Organizations: ALVORD UNIFIED (SCHOOL DISTRICT)
CHEMAWA MIDDLE (8830 MAGNOLIA AVE. in RIVERSIDE, CA)
(National Center for Education Statistics) - STATE ID-6061790 Organizations: RIVERSIDE UNIFIED (SCHOOL DISTRICT)
HARRISON ELEMENTARY (2901 HARRISON ST. in RIVERSIDE, CA)
(National Center for Education Statistics) - STATE ID-6032601 Organizations: RIVERSIDE UNIFIED (SCHOOL DISTRICT)
HAWTHORNE ELEMENTARY (9174 INDIANA AVE. in RIVERSIDE, CA)
(National Center for Education Statistics) - STATE ID-6032619 Organizations: RIVERSIDE UNIFIED (SCHOOL DISTRICT)
LIBERTY ELEMENTARY (9631 HAYES ST. in RIVERSIDE, CA)
(National Center for Education Statistics) - STATE ID-6032684 Organizations: RIVERSIDE UNIFIED (SCHOOL DISTRICT)
FOOTHILL ELEMENTARY (8230 WELLS AVE. in RIVERSIDE, CA)
(National Center for Education Statistics) - STATE ID-6031538 Organizations: ALVORD UNIFIED (SCHOOL DISTRICT)
CALIFORNIA OIL REFINERY INC (16475 MCALLISTER in RIVERSIDE, CA)
TRANSPORTER (Resource Conservation and Recovery Act (tracking hazardous waste)) Organizations: ROBERT BENNETT (CONTACT/OWNER)
, J BENNETT OIL CO INC (CONTACT/OWNER)
Alternative names: J BENNET OIL CO INC
Housing units lacking complete plumbing facilities: 0.3% Housing units lacking complete kitchen facilities: 1.6%
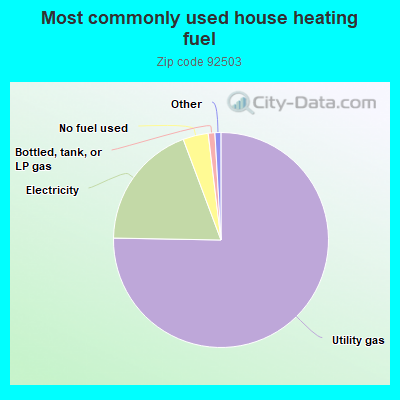
75.3%Utility gas
19.0%Electricity
3.8%No fuel used
1.0%Bottled, tank, or LP gas
Population in 1990: 55,552. Population change in the 1990s: +16,118 (+29.0%).
Place of birth for U.S.-born residents:
This state: 57,118
Northeast: 1,308
Midwest: 2,229
South: 1,753
West: 1,624
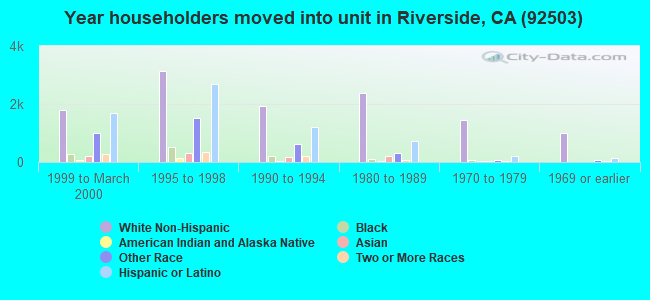
53% of the 92503 zip code residents lived in the same house 5 years ago. Out of people who lived in different houses, 66% lived in this county. Out of people who lived in different counties, 50% lived in California.
92% of the 92503 zip code residents lived in the same house 1 year ago. Out of people who lived in different houses, 60% moved from this county. Out of people who lived in different houses, 33% moved from different county within same state. Out of people who lived in different houses, 6% moved from different state. Out of people who lived in different houses, 2% moved from abroad.
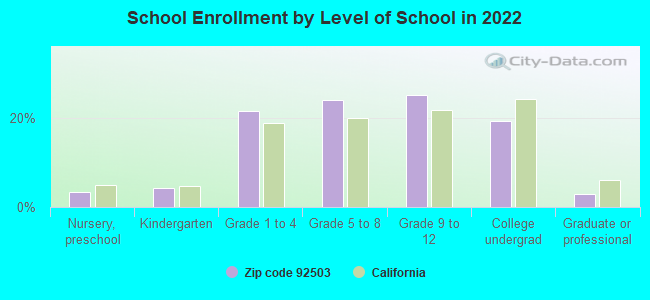
Private vs. public school enrollment:
Students in private schools in grades 1 to 8 (elementary and middle school): 917
Here:
8.2%
California:
10.5%
Students in private schools in grades 9 to 12 (high school): 292
Here:
4.8%
California:
8.5%
Students in private undergraduate colleges: 724
Here:
15.2%
California:
15.9%
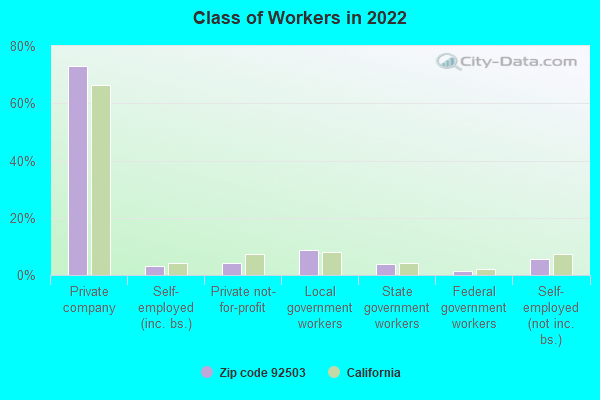
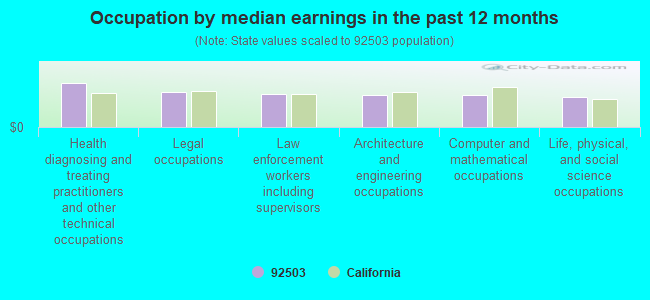
Occupation by median earnings in the past 12 months ($)
114,432Health diagnosing and treating practitioners and other technical occupations
91,429Legal occupations
85,980Law enforcement workers including supervisors
82,734Architecture and engineering occupations
82,689Computer and mathematical occupations
78,184Life, physical, and social science occupations
Companies with biggest federal contracts located in this zip code (RIVERSIDE, CA):
PACIFIC CONSOLIDATED INDUSTRIE (12201 MAGNOLIA AVE; small business) : $89,582,867 in 149 contractsfrom 2000 to 2006
Contracts for Gas Generating and Dispensing Systems, Fixed or Mobile, Hospital Furniture, Equipment, Utensils, and Supplies, Medical and Surgical Instruments, Equipment, and Supplies, Trucks and Truck Tractors, Wheeled, and moreby Air Force, Defense Logistics Agency, Army, Navy, and others Signed by year:2000: $11,681,404; 2001: $345,696; 2002: $13,833,691; 2003: $16,828,518; 2004: $15,490,390; 2005: $29,355,661; 2006: $2,047,507.
Biggest contracts:
$13,846,976 with Air Force for Gas Generating and Dispensing Systems, Fixed or Mobile. Signed on 2004-04-20. Completion date: 2005-10-31.
$13,705,978, same as above.Signed on 2003-01-14. Completion date: 2004-08-31.
$13,320,439, same as above.Signed on 2002-02-01. Completion date: 2003-08-29.
$11,326,959, same as above.Signed on 2000-03-10. Completion date: 2001-05-31.
GOODRICH, B F AEROSPACE (8200 ARLINGTON AVE) : $5,332,274 in 2 contractsin 2000
$3,298,760 with Air Force for Airframe Structural Components. Signed on 2000-02-25. Completion date: 2001-01-31.
$2,033,514, same as above.Signed on 2000-02-25. Completion date: 2001-01-31.
SKYSPARES PARTS, INC (6640 VIEW PARK CT; small business) : $3,784,705 in 310 contractsfrom 1999 to 2006
Contracts for Miscellaneous Aircraft Accessories and Components, Airframe Structural Components, Aircraft Hydraulic, Vacuum, and De-icing System Components, Aircraft Landing Gear Components, and moreby Defense Logistics Agency, Air Force, Army Signed by year:2000: $533,065; 2001: $155,961; 2002: $716,255; 2003: $33,729; 2004: $492,073; 2005: $1,372,713; 2006: $435,349.
Biggest contracts:
$191,764 with Defense Logistics Agency for Miscellaneous Aircraft Accessories and Components. Signed on 2002-07-24. Completion date: 2002-11-21.
$98,600 with Defense Logistics Agency for Airframe Structural Components. Signed on 2005-11-21. Completion date: 2006-06-19.
$98,362 with Defense Logistics Agency for Miscellaneous Aircraft Accessories and Components. Signed on 2000-04-03. Completion date: 2001-05-23.
$79,086 with Defense Logistics Agency for Airframe Structural Components. Signed on 2000-01-12. Completion date: 2000-08-09.
S P A R E S LLC (12155 MAGNOLIA AVE; small business) : $3,066,379 in 143 contractsfrom 1999 to 2006
Contracts for Airframe Structural Components, Packing and Gasket Materials, Miscellaneous Fabricated Nonmetallic Materials, Hardware, Commercial, and moreby Defense Logistics Agency, Army, Navy Signed by year:2000: $148,594; 2001: $389,381; 2002: $628,315; 2003: $22,919; 2004: $574,926; 2005: $781,281; 2006: $492,363.
Biggest contracts:
$168,000 with Defense Logistics Agency for Airframe Structural Components. Signed on 2002-03-08. Completion date: 2002-06-16.
$126,750, same as above.Signed on 2002-04-09. Completion date: 2002-07-18.
$94,510 with Defense Logistics Agency for Packing and Gasket Materials. Signed on 2006-05-24. Completion date: 2007-06-17.
$93,485, same as above.Signed on 2002-04-30. Completion date: 2002-07-29.
PRECISE AERO PRODUCTS, INC (4120 INDUS WAY; small business) : $1,550,478 in 131 contractsfrom 1999 to 2006
Contracts for Nuts and Washers, Bushings, Rings, Shims, and Spacers, Miscellaneous Power Transmission Equipment, Nails, Machine Keys, and Pins, and moreby Defense Logistics Agency, Navy, Army Signed by year:2000: $133,000; 2001: $134,812; 2002: $86,258; 2003: $0; 2004: $228,836; 2005: $693,098; 2006: $169,685.
Biggest contracts:
$89,920 with Defense Logistics Agency for Nuts and Washers. Signed on 2005-09-03. Completion date: 2005-12-12.
$72,680 with Defense Logistics Agency for Bushings, Rings, Shims, and Spacers. Signed on 2000-04-28. Completion date: 2000-07-27.
$70,272 with Defense Logistics Agency for Miscellaneous Power Transmission Equipment. Signed on 1999-10-02. Completion date: 2000-05-12.
$67,430 with Defense Logistics Agency for Nails, Machine Keys, and Pins. Signed on 2004-04-26. Completion date: 2004-09-30.
ONTARIO ENGINEERING INTERNATIO (3333 HARRISON STREET #6; small business) : $1,359,167 in 6 contractsfrom 2000 to 2003
Contracts for Defense Missile and Space Systems -- Basic Research (R&D), Defense Electronics and Communication Equipment -- Basic Research (R&D), Defense Missile and Space Systems -- Applied Research and Exploratory Development (R&D) by Air Force Signed by year:2000: $375,000; 2001: $404,823; 2002: $325,000; 2003: $254,344; 2004: $0; 2005: $0; 2006: $0.
Biggest contracts:
$375,000 with Air Force for Defense Missile and Space Systems -- Basic Research (R&D). Signed on 2000-02-24. Completion date: 2002-02-25.
$325,000 with Air Force for Defense Electronics and Communication Equipment -- Basic Research (R&D). Signed on 2002-11-01. Completion date: 2004-07-10.
$254,344, same as above.Signed on 2003-01-10. Completion date: 2004-07-10.
$179,000 with Air Force for Defense Missile and Space Systems -- Basic Research (R&D). Signed on 2001-02-22. Completion date: 2002-02-25.
DEAN-SO CAL LLC (12171 MADERA WAY) : $916,033 in 10 contractsfrom 2004 to 2006
Contracts for Food Items For Resale, Dairy Foods and Eggs by Defense Commissary Agency, Army Signed by year:2000: $0; 2001: $0; 2002: $0; 2003: $0; 2004: $171,530; 2005: $513,390; 2006: $231,113.
Biggest contracts:
$229,463 with Defense Commissary Agency for Food Items For Resale. Signed on 2006-07-05. Completion date: 2005-12-31.
$227,209, same as above.Signed on 2005-04-01. Completion date: 2005-08-31.
$171,530, same as above.Signed on 2004-10-01. Completion date: 2005-02-28.
$144,811, same as above.Signed on 2005-10-01. Completion date: 2005-12-31.
SORA POWER, INC (11631 STERLING AVE; small business) : $543,595 in 24 contractsfrom 2000 to 2006
Contracts for Coils and Transformers, Converters, Electrical, Nonrotating, Capacitors by Defense Logistics Agency, Army, Air Force Signed by year:2000: $80,122; 2001: $197,040; 2002: $29,358; 2003: $0; 2004: $49,200; 2005: $92,246; 2006: $95,629.
Biggest contracts:
$89,208 with Defense Logistics Agency for Coils and Transformers. Signed on 2001-07-08. Completion date: 2002-01-09.
$74,400, same as above.Signed on 2001-12-28. Completion date: 2002-05-13.
$49,200 with Army for Coils and Transformers. Signed on 2004-01-04. Completion date: 2004-06-30.
$46,690 with Defense Logistics Agency for Converters, Electrical, Nonrotating. Signed on 2000-03-24. Completion date: 2000-09-27.
SIERRA ASSEMBLY TECHNOLOGY, IN (4145 INDUS WAY; small business) : $393,786 in 18 contractsfrom 2003 to 2005
Contracts for Vehicular Furniture and Accessories, Electrical and Electronic assemblies, Boards, Cards, and Associated Hardware, Cable, Cord, and Wire Assemblies: Communications Equipment, Miscellaneous Electric Power and Distribution Equipment by Army Signed by year:2000: $0; 2001: $0; 2002: $0; 2003: $597,292; 2004: -$191,686; 2005: -$11,820; 2006: $0.
Biggest contracts:
$218,855 with Army for Vehicular Furniture and Accessories. Signed on 2003-07-30. Completion date: 2004-06-04.
$149,875 with Army for Electrical and Electronic assemblies, Boards, Cards, and Associated Hardware. Signed on 2003-10-03. Completion date: 2004-09-20.
$119,505 with Army for Vehicular Furniture and Accessories. Signed on 2003-10-07. Completion date: 2004-06-04.
$54,349 with Army for Electrical and Electronic assemblies, Boards, Cards, and Associated Hardware. Signed on 2003-07-28. Completion date: 2004-05-28.
ONTARIO ENGINEERING INTERNATIO (3333 HARRISON STREET UNIT; small business) : $388,864 in 4 contractsfrom 2001 to 2002
$150,000 with Air Force for Defense Missile and Space Systems -- Applied Research and Exploratory Development (R&D). Signed on 2002-04-03. Completion date: 2004-07-10.
$99,934, same as above.Signed on 2001-04-20. Completion date: 2002-04-10.
$69,930 with Navy for Defense Electronics and Communication Equipment -- Applied Research and Exploratory Development (R&D). Signed on 2001-11-29. Completion date: 2002-05-26.
$69,000 with NASA for Aeronautics and Space Technology -- Basic Research (R&D). Signed on 2001-01-15. Completion date: 2001-08-15.
Top industries in this zip code by the number of employees in 2005:
2005 - 2018 National Fire Incident Reporting System (NFIRS) incidents
Based on the data from the years 2005 - 2018 the average number of fires per year is 95. The highest number of fire incidents - 183 took place in 2005, and the least - 21 in 2011. The data has a decreasing trend.
When looking into fire subcategories, the most incidents belonged to: Outside Fires (51.7%), and Mobile Property/Vehicle Fires (23.1%).
Fire incident types reported to NFIRS in Zip Code 92503


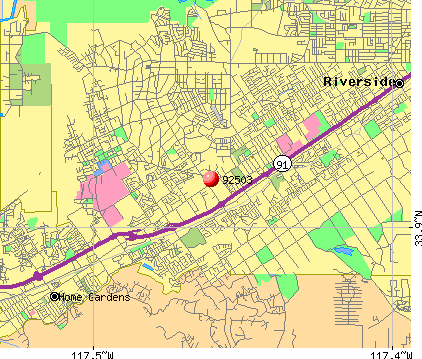 Nearest zip codes: 92504, 92505, 92879, 92506, 92881, 92508.


 Based on the data from the years 2005 - 2018 the average number of fires per year is 95. The highest number of fire incidents - 183 took place in 2005, and the least - 21 in 2011. The data has a decreasing trend.
 When looking into fire subcategories, the most incidents belonged to: Outside Fires (51.7%), and Mobile Property/Vehicle Fires (23.1%).