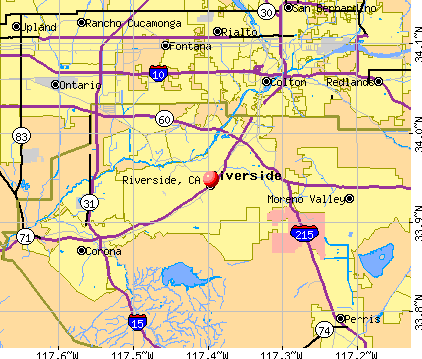
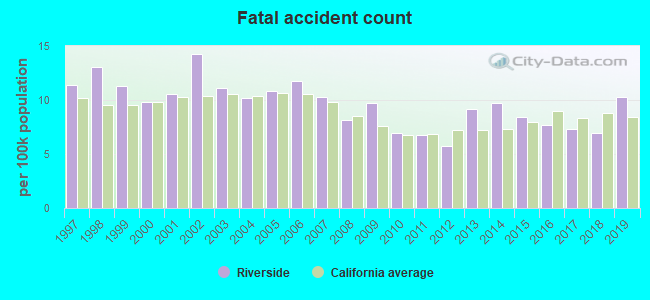
Riverside, California
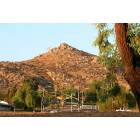
Riverside: view of Lionshead Hill in the La Sierra area
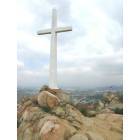
Riverside: MY 1ST DAY TO MT. RUBIDOUX
Riverside: riverside
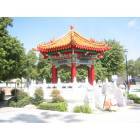
Riverside: Riverside, CA - April 2003

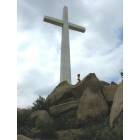
Riverside: Mt. Rubidoux
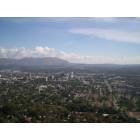
Riverside: Downtown from Mt. Rubidoux
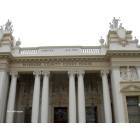
Riverside: Intricate craftsmanship on the Riverside County Courthouse
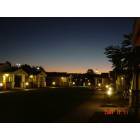
Riverside: California Baptist University Cottages (living residence)
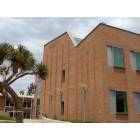
Riverside: Univ. of California Riverside - Biological Sciences Building
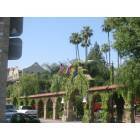
Riverside: Riverside, CA - April 2003
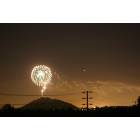
Riverside: Fireworks on the top of Mt. Rubidoux on 4th of July
- see
64
more - add
your
Submit your own pictures of this city and show them to the world
- OSM Map
- General Map
- Google Map
- MSN Map
Population change since 2000: +25.7%
 |
| Males: 157,012 | |
| Females: 163,752 |
| Median resident age: | 33.9 years |
| California median age: | 37.9 years |
Zip codes: 92506.
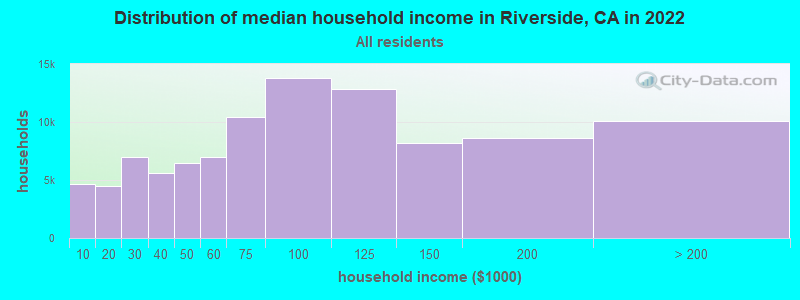
| Riverside: | $81,228 |
| CA: | $91,551 |
Estimated per capita income in 2022: $32,762 (it was $17,882 in 2000)
Riverside city income, earnings, and wages data
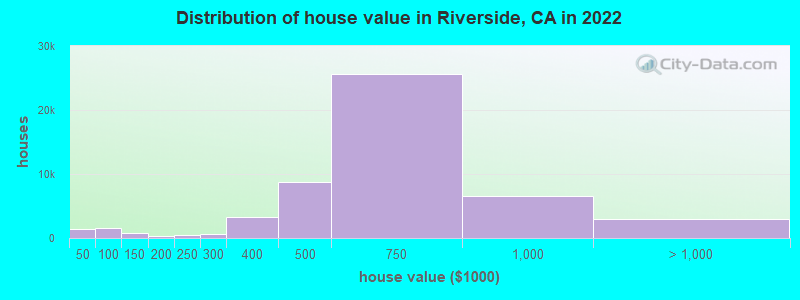
Estimated median house or condo value in 2022: $589,600 (it was $136,000 in 2000)
| Riverside: | $589,600 |
| CA: | $715,900 |
Mean prices in 2022: all housing units: $612,482; detached houses: $636,879; townhouses or other attached units: $605,139; in 2-unit structures: $408,662; in 3-to-4-unit structures: $359,743; in 5-or-more-unit structures: $376,676; mobile homes: $101,978
Median gross rent in 2022: $1,747.
(9.5% for White Non-Hispanic residents, 13.2% for Black residents, 14.2% for Hispanic or Latino residents, 14.0% for American Indian residents, 12.1% for Native Hawaiian and other Pacific Islander residents, 14.6% for other race residents, 9.5% for two or more races residents)
Detailed information about poverty and poor residents in Riverside, CA


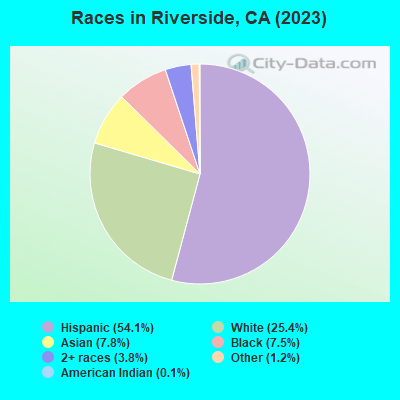
- 180,67156.3%Hispanic
- 88,31327.5%White alone
- 21,7306.8%Asian alone
- 18,2035.7%Black alone
- 9,3382.9%Two or more races
- 1,3800.4%American Indian alone
- 5480.2%Native Hawaiian and Other
Pacific Islander alone - 6020.2%Other race alone
According to our research of California and other state lists, there were 615 registered sex offenders living in Riverside, California as of April 27, 2024.
The ratio of all residents to sex offenders in Riverside is 528 to 1.
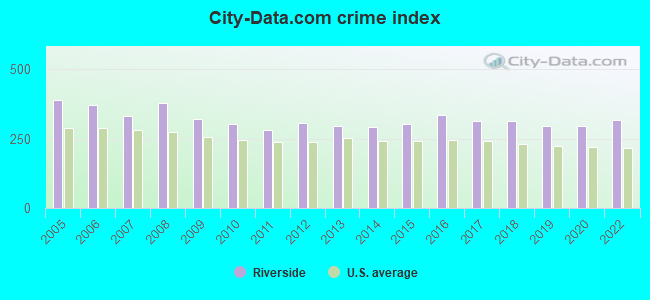
The City-Data.com crime index weighs serious crimes and violent crimes more heavily. Higher means more crime, U.S. average is 246.1. It adjusts for the number of visitors and daily workers commuting into cities.
- means the value is smaller than the state average.- means the value is about the same as the state average.
- means the value is bigger than the state average.
- means the value is much bigger than the state average.
Crime rate in Riverside detailed stats: murders, rapes, robberies, assaults, burglaries, thefts, arson
Full-time law enforcement employees in 2021, including police officers: 520 (363 officers - 318 male; 45 female).
| Officers per 1,000 residents here: | 1.09 |
| California average: | 2.30 |
 Recent articles from our blog. Our writers, many of them Ph.D. graduates or candidates, create easy-to-read articles on a wide variety of topics.

 | Riverside #8 Coolest City According to Forbes (49 replies) |
| Thoughts on Riverside County? (0 replies) |
| Corona versus Riverside (2 replies) |
| Will Riverside develop an identity? (25 replies) |
| Truth About Schools in Riverside City (2 replies) |
| Will you please STOP calling Western Riverside County a "desert?!" (25 replies) |
Latest news from Riverside, CA collected exclusively by city-data.com from local newspapers, TV, and radio stations
Ancestries: American (2.3%), English (2.2%), German (2.0%), Irish (1.8%), European (1.8%), Italian (1.5%).
Current Local Time: PST time zone
Land area: 78.1 square miles.
Population density: 4,107 people per square mile (average).
72,642 residents are foreign born (15.4% Latin America, 5.2% Asia).
| This city: | 22.6% |
| California: | 26.5% |
Median real estate property taxes paid for housing units with mortgages in 2022: $3,624 (0.6%)
Median real estate property taxes paid for housing units with no mortgage in 2022: $2,341 (0.4%)
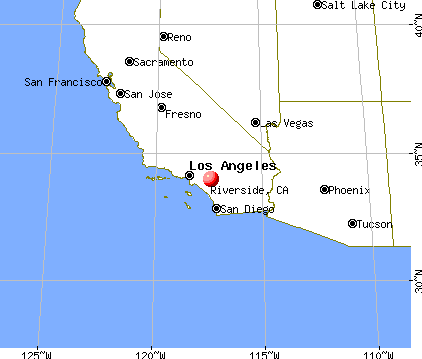
Nearest city with pop. 1,000,000+: Los Angeles, CA  (57.0 miles , pop. 3,694,820).
Nearest cities:
), ), ), ), )Latitude: 33.95 N, Longitude: 117.40 W
Daytime population change due to commuting: +19,821 (+6.2%)
Workers who live and work in this city: 71,631 (46.1%)
Area code: 909
Detailed articles:
- Riverside: Introduction
- Riverside Basic Facts
- Riverside: Communications
- Riverside: Convention Facilities
- Riverside: Economy
- Riverside: Education and Research
- Riverside: Geography and Climate
- Riverside: Health Care
- Riverside: History
- Riverside: Municipal Government
- Riverside: Population Profile
- Riverside: Recreation
- Riverside: Transportation
Riverside, California accommodation & food services, waste management - Economy and Business Data
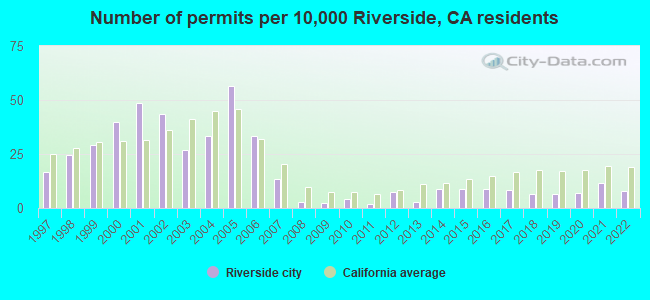
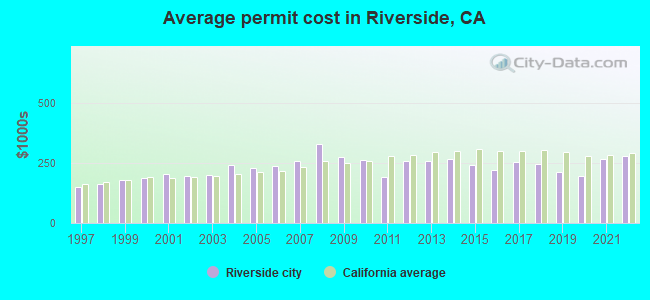
Single-family new house construction building permits:
- 2022: 199 buildings, average cost: $279,700
- 2021: 293 buildings, average cost: $267,400
- 2020: 180 buildings, average cost: $196,500
- 2019: 170 buildings, average cost: $211,100
- 2018: 171 buildings, average cost: $248,000
- 2017: 208 buildings, average cost: $252,900
- 2016: 219 buildings, average cost: $221,300
- 2015: 222 buildings, average cost: $242,300
- 2014: 230 buildings, average cost: $266,200
- 2013: 70 buildings, average cost: $258,700
- 2012: 190 buildings, average cost: $257,000
- 2011: 43 buildings, average cost: $193,300
- 2010: 107 buildings, average cost: $260,600
- 2009: 56 buildings, average cost: $275,400
- 2008: 69 buildings, average cost: $328,500
- 2007: 342 buildings, average cost: $259,600
- 2006: 848 buildings, average cost: $237,000
- 2005: 1441 buildings, average cost: $231,200
- 2004: 847 buildings, average cost: $242,500
- 2003: 689 buildings, average cost: $201,800
- 2002: 1113 buildings, average cost: $196,500
- 2001: 1237 buildings, average cost: $205,700
- 2000: 1017 buildings, average cost: $186,000
- 1999: 749 buildings, average cost: $177,800
- 1998: 630 buildings, average cost: $164,000
- 1997: 421 buildings, average cost: $152,000
| Here: | 4.7% |
| California: | 5.1% |
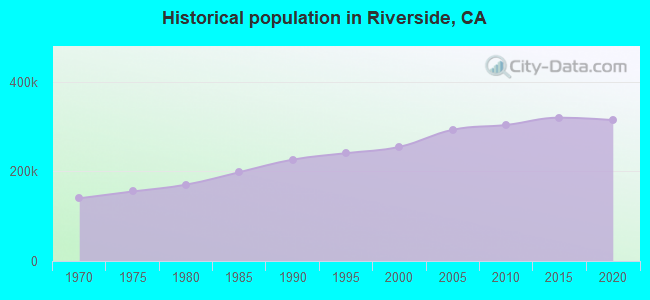
Population change in the 1990s: +24,113 (+10.4%).
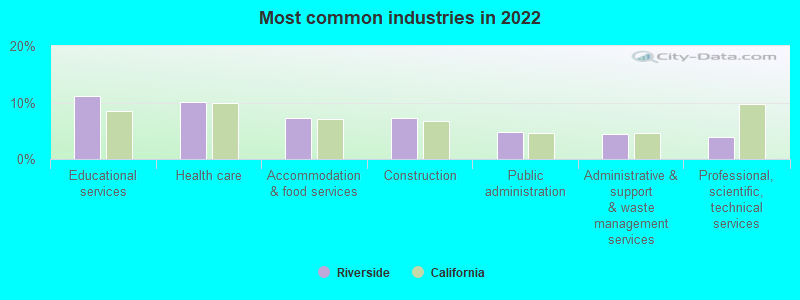
- Educational services (11.1%)
- Health care (10.1%)
- Accommodation & food services (7.3%)
- Construction (7.2%)
- Public administration (4.8%)
- Administrative & support & waste management services (4.4%)
- Professional, scientific, technical services (4.0%)
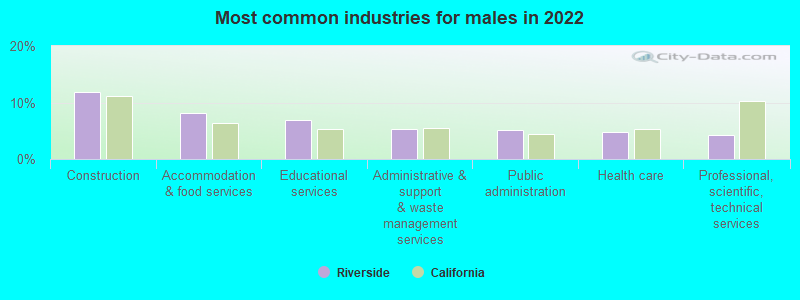
- Construction (11.9%)
- Accommodation & food services (8.1%)
- Educational services (7.0%)
- Administrative & support & waste management services (5.4%)
- Public administration (5.1%)
- Health care (4.7%)
- Professional, scientific, technical services (4.2%)

- Health care (16.5%)
- Educational services (16.1%)
- Accommodation & food services (6.4%)
- Social assistance (5.3%)
- Public administration (4.5%)
- Professional, scientific, technical services (3.7%)
- Personal & laundry services (3.5%)
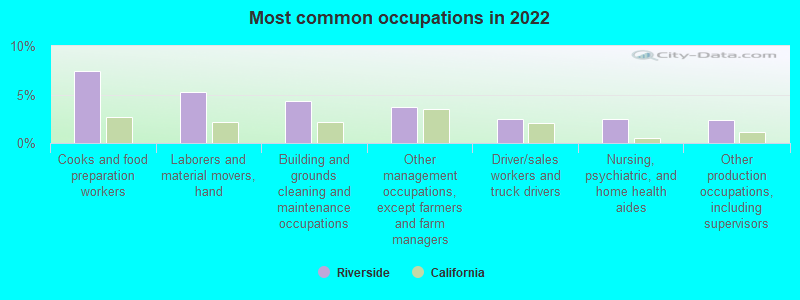
- Cooks and food preparation workers (7.4%)
- Laborers and material movers, hand (5.3%)
- Building and grounds cleaning and maintenance occupations (4.4%)
- Other management occupations, except farmers and farm managers (3.7%)
- Driver/sales workers and truck drivers (2.5%)
- Nursing, psychiatric, and home health aides (2.4%)
- Other production occupations, including supervisors (2.4%)
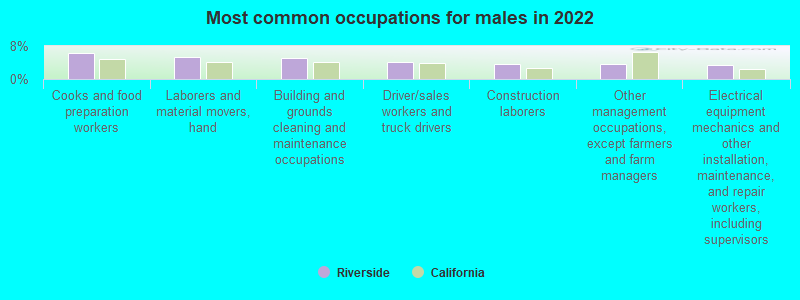
- Cooks and food preparation workers (6.4%)
- Laborers and material movers, hand (5.2%)
- Building and grounds cleaning and maintenance occupations (5.1%)
- Driver/sales workers and truck drivers (4.2%)
- Construction laborers (3.7%)
- Other management occupations, except farmers and farm managers (3.7%)
- Electrical equipment mechanics and other installation, maintenance, and repair workers, including supervisors (3.5%)
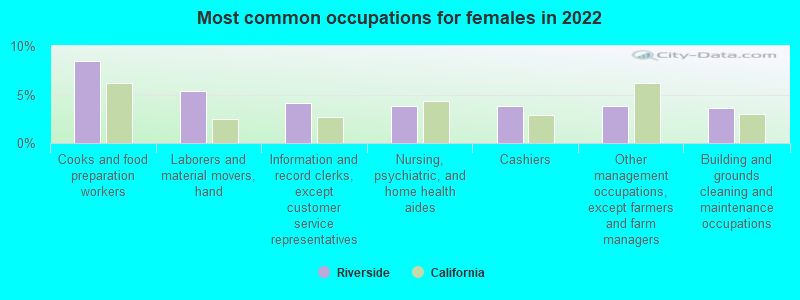
- Cooks and food preparation workers (8.4%)
- Laborers and material movers, hand (5.4%)
- Information and record clerks, except customer service representatives (4.1%)
- Nursing, psychiatric, and home health aides (3.8%)
- Cashiers (3.8%)
- Other management occupations, except farmers and farm managers (3.8%)
- Building and grounds cleaning and maintenance occupations (3.7%)
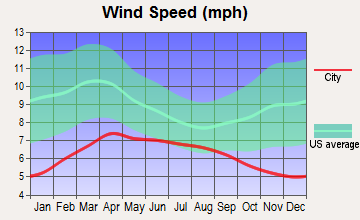
Average climate in Riverside, California
Based on data reported by over 4,000 weather stations


|
|

(lower is better)
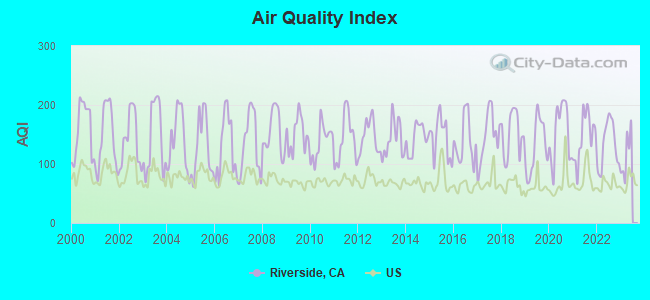
Air Quality Index (AQI) level in 2022 was 133. This is significantly worse than average.
| City: | 133 |
| U.S.: | 73 |
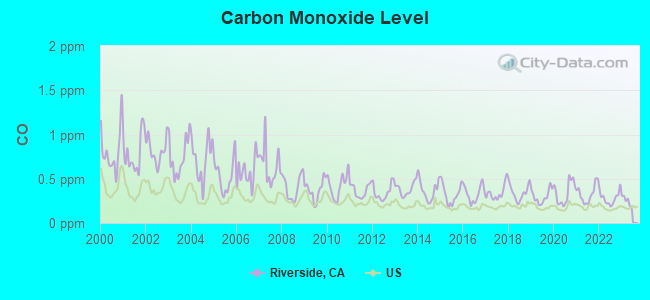
Carbon Monoxide (CO) [ppm] level in 2022 was 0.283. This is about average. Closest monitor was 3.7 miles away from the city center.
| City: | 0.283 |
| U.S.: | 0.251 |
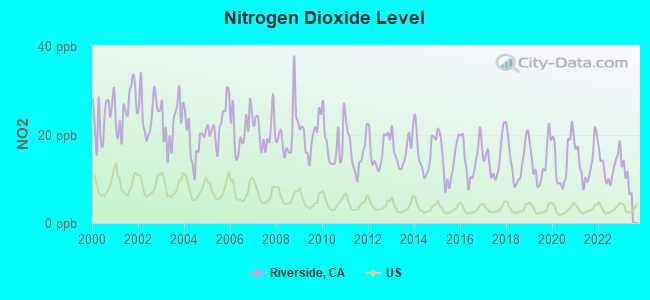
Nitrogen Dioxide (NO2) [ppb] level in 2022 was 13.0. This is significantly worse than average. Closest monitor was 0.3 miles away from the city center.
| City: | 13.0 |
| U.S.: | 5.1 |
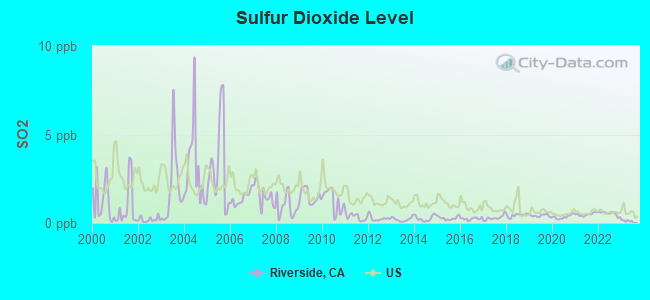
Sulfur Dioxide (SO2) [ppb] level in 2022 was 0.533. This is significantly better than average. Closest monitor was 0.3 miles away from the city center.
| City: | 0.533 |
| U.S.: | 1.515 |
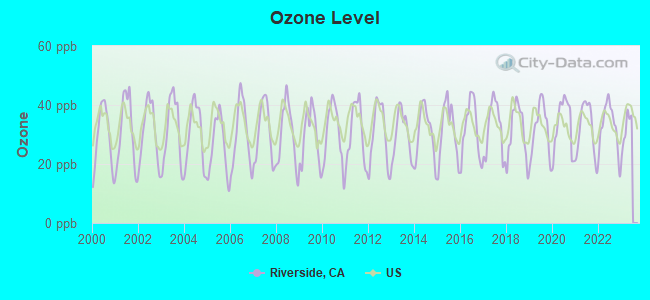
Ozone [ppb] level in 2022 was 32.7. This is about average. Closest monitor was 0.3 miles away from the city center.
| City: | 32.7 |
| U.S.: | 33.3 |
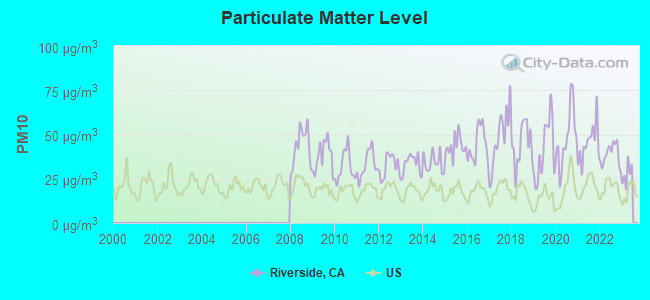
Particulate Matter (PM10) [µg/m3] level in 2022 was 38.7. This is significantly worse than average. Closest monitor was 0.3 miles away from the city center.
| City: | 38.7 |
| U.S.: | 19.2 |
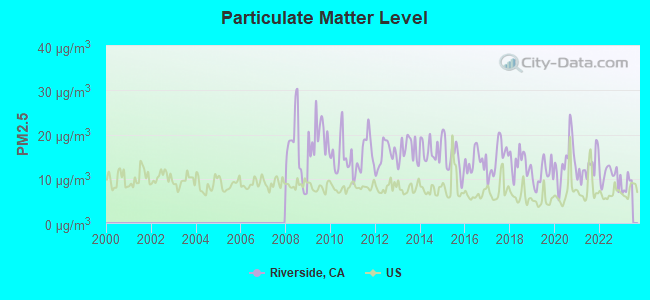
Particulate Matter (PM2.5) [µg/m3] level in 2022 was 10.8. This is worse than average. Closest monitor was 0.3 miles away from the city center.
| City: | 10.8 |
| U.S.: | 8.1 |
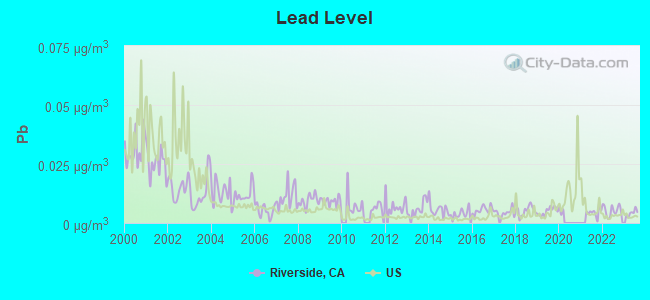
Lead (Pb) [µg/m3] level in 2023 was 0.00426. This is significantly better than average. Closest monitor was 3.7 miles away from the city center.
| City: | 0.00426 |
| U.S.: | 0.00931 |
Earthquake activity:
Riverside-area historical earthquake activity is significantly above California state average. It is 7223% greater than the overall U.S. average.On 6/28/1992 at 11:57:34, a magnitude 7.6 (6.2 MB, 7.6 MS, 7.3 MW, Depth: 0.7 mi, Class: Major, Intensity: VIII - XII) earthquake occurred 52.1 miles away from Riverside center, causing 3 deaths (1 shaking deaths, 2 other deaths) and 400 injuries, causing $100,000,000 total damage and $40,000,000 insured losses
On 7/21/1952 at 11:52:14, a magnitude 7.7 (7.7 UK) earthquake occurred 116.9 miles away from Riverside center, causing $50,000,000 total damage
On 10/16/1999 at 09:46:44, a magnitude 7.4 (6.3 MB, 7.4 MS, 7.2 MW, 7.3 ML) earthquake occurred 67.5 miles away from the city center
On 5/19/1940 at 04:36:40, a magnitude 7.2 (7.2 UK) earthquake occurred 110.0 miles away from the city center, causing $33,000,000 total damage
On 4/21/1918 at 22:32:30, a magnitude 6.8 (6.8 UK, Class: Strong, Intensity: VII - IX) earthquake occurred 9.7 miles away from Riverside center
On 6/28/1992 at 15:05:30, a magnitude 6.9 (6.3 MB, 6.7 MS, 6.5 MW, 6.9 ME, Depth: 3.1 mi) earthquake occurred 40.7 miles away from the city center
Magnitude types: body-wave magnitude (MB), energy magnitude (ME), local magnitude (ML), surface-wave magnitude (MS), moment magnitude (MW)
Natural disasters:
The number of natural disasters in Riverside County (46) is a lot greater than the US average (15).Major Disasters (Presidential) Declared: 27
Emergencies Declared: 1
Causes of natural disasters: Fires: 22, Floods: 20, Storms: 8, Winter Storms: 8, Landslides: 6, Mudslides: 5, Heavy Rains: 2, Earthquake: 1, Flash Flood: 1, Freeze: 1, Hurricane: 1, Tornado: 1, Tropical Storm: 1, Other: 1 (Note: some incidents may be assigned to more than one category).
Main business address for: PROVIDENT FINANCIAL HOLDINGS INC (SAVINGS INSTITUTION, FEDERALLY CHARTERED), FLEETWOOD ENTERPRISES INC/DE/ (MOTOR HOMES).
Hospitals in Riverside:
- BENTLEY HOUSE (11350 BENTLEY STREET)
- CAMI HOUSE (4792 MEADOWLAND)
- CARRICK HOUSE (3980 CARRICK STREET)
- GRAMERCY DIVISION (10466 GRAMERCY PLACE)
- INLAND VALLEY HOSPICE (3770 MYERS STREET)
- KNOLLWOOD PSYCH AND CHEMICAL DEPEND CTR (5900 BROCKTON AVE)
- LINARES DIVISION (7256 LINARES)
- MAVERICK HOUSE (8163 LAUREL PARK CIRCLE)
- RIVERSIDE COMMUNITY HOSPITAL (Government - State, 4445 MAGNOLIA AVENUE)
- VALLEY HOSPICE - VILLA (8965 MAGNOLIA AVE)
Airports and heliports located in Riverside:
- Riverside Municipal Airport (RAL) (Runways: 3, Air Taxi Ops: 2,354, Itinerant Ops: 49,601, Local Ops: 59,720, Military Ops: 587)
- March Arb Airport (RIV) (Runways: 2)
- City Hall Heliport (CA78)
- Johnson Heliport (CA91)
- Riverside Community Hospital Heliport (54CA)
- Riverside Metro Center Heliport (CA81)
Colleges/Universities in Riverside:
- University of California-Riverside (Full-time enrollment: 20,647; Location: 900 University Ave; Public; Website: WWW.UCR.EDU; Offers Doctor's degree)
- Riverside City College (Full-time enrollment: 10,661; Location: 4800 Magnolia Avenue; Public; Website: www.rcc.edu/riverside/)
- California Baptist University (Full-time enrollment: 6,085; Location: 8432 Magnolia Ave; Private, not-for-profit; Website: www.calbaptist.edu; Offers Master's degree)
- La Sierra University (Full-time enrollment: 2,205; Location: 4500 Riverwalk Parkway; Private, not-for-profit; Website: www.lasierra.edu; Offers Doctor's degree)
- American College of Healthcare (Full-time enrollment: 590; Location: 11801 Pierce St., Suite 100; Private, for-profit; Website: www.ach.edu)
- North-West College-Riverside (Full-time enrollment: 551; Location: 4550 La Sierra Ave; Private, for-profit; Website: www.north-westcollege.edu)
- Kaplan College-Riverside (Full-time enrollment: 443; Location: 4040 Vine Street; Private, for-profit; Website: www.kaplancollege.com/riverside-ca/)
- Platt College-Riverside (Full-time enrollment: 285; Location: 6465 Sycamore Canyon Blvd Ste 100; Private, for-profit; Website: www.plattcollege.edu)
- InterCoast Colleges-Riverside (Full-time enrollment: 176; Location: 1989 Atlanta Ave; Private, for-profit; Website: www.intercoast.edu)
- Riverside County Office of Education (Full-time enrollment: 163; Location: 9825 County Farm Road; Public; Website: www.riversidesce.org)
Other colleges/universities with over 2000 students near Riverside:
- Norco College (about 11 miles; Norco, CA; Full-time enrollment: 4,916)
- Loma Linda University (about 11 miles; Loma Linda, CA; FT enrollment: 2,839)
- San Bernardino Valley College (about 11 miles; San Bernardino, CA; FT enrollment: 7,444)
- The Art Institute of California-Argosy University Inland Empire (about 12 miles; San Bernardino, CA; FT enrollment: 2,238)
- Moreno Valley College (about 12 miles; Moreno Valley, CA; FT enrollment: 4,650)
- Universal Technical Institute of California Inc (about 14 miles; Rancho Cucamonga, CA; FT enrollment: 4,158)
- University of Redlands (about 16 miles; Redlands, CA; FT enrollment: 4,854)
Biggest public high schools in Riverside:
- LA SIERRA HIGH (Students: 2,201, Location: 4145 LA SIERRA AVE., Grades: 9-12)
- MARTIN LUTHER KING JR. HIGH (Students: 2,185, Location: 9301 WOOD RD., Grades: 9-12)
- POLYTECHNIC HIGH (Students: 1,993, Location: 5450 VICTORIA AVE., Grades: 9-12)
- JOHN W. NORTH HIGH (Students: 1,677, Location: 1550 W. THIRD ST., Grades: 9-12)
- NORTE VISTA HIGH (Students: 1,553, Location: 6585 CREST AVE., Grades: 9-12)
- ARLINGTON HIGH (Students: 1,547, Location: 2951 JACKSON ST., Grades: 9-12)
- RAMONA HIGH (Students: 1,486, Location: 7675 MAGNOLIA AVE., Grades: 9-12)
- RIVERSIDE COUNTY SPECIAL EDUCATION (Students: 564, Location: 3939 13TH ST., Grades: KG-12)
- CALIFORNIA SCHOOL FOR THE DEAF-RIVERSIDE (Students: 282, Location: 3044 HORACE ST., Grades: KG-12)
- RIVERSIDE COUNTY COMMUNITY (Students: 270, Location: 3939 13TH ST., Grades: 7-12)
Private high schools in Riverside:
- WOODCREST CHRISTIAN SCHOOL SYSTEM (Students: 899, Location: 18401 VAN BUREN BLVD, Grades: KG-12)
- LA SIERRA ACADEMY (Students: 651, Location: 4900 GOLDEN AVE, Grades: KG-12)
- RIVERSIDE CHRISTIAN SCHOOLS (Students: 621, Location: 3532 MONROE ST, Grades: PK-12)
- NOTRE DAME HIGH SCHOOL (Students: 463, Location: 7085 BROCKTON AVE, Grades: 9-12)
- BETHEL CHRISTIAN SCHOOLS (Students: 164, Location: 2425 VAN BUREN BLVD, Grades: KG-12)
- SOMERSET EDUCATIONAL SERVICES (Students: 104, Location: 17241 VAN BUREN BLVD, Grades: KG-12)
- FAITH BAPTIST CHURCH & FAITH CHRISTIAN SCHOOL (Students: 30, Location: 5363 TYLER ST, Grades: KG-12)
- IMMANUEL BAPTIST SCHOOL (Students: 17, Location: 45 MICHIGAN AVE, Grades: 1-9)
Biggest public elementary/middle schools in Riverside:
- AMELIA EARHART MIDDLE (Students: 1,534, Location: 20202 APTOS ST., Grades: 7-8)
- YSMAEL VILLEGAS MIDDLE (Students: 1,230, Location: 3754 HARVILL LN., Grades: 6-8)
- CHEMAWA MIDDLE (Students: 1,166, Location: 8830 MAGNOLIA AVE., Grades: 7-8)
- MATTHEW GAGE MIDDLE (Students: 1,101, Location: 6400 LINCOLN AVE., Grades: 7-8)
- ARIZONA MIDDLE (Students: 1,030, Location: 11045 ARIZONA AVE., Grades: 6-8)
- LOMA VISTA MIDDLE (Students: 992, Location: 11050 ARLINGTON AVE., Grades: 6-8)
- WELLS MIDDLE (Students: 936, Location: 10000 WELLS AVE., Grades: 6-8)
- UNIVERSITY HEIGHTS MIDDLE (Students: 736, Location: 1155 MASSACHUSETTS AVE., Grades: 7-8)
- JOHN F. KENNEDY ELEMENTARY (Students: 698, Location: 19125 SCHHOUSE LN., Grades: KG-6)
- CENTRAL MIDDLE (Students: 677, Location: 4795 MAGNOLIA AVE., Grades: 5-8)
Biggest private elementary/middle schools in Riverside:
- HARVEST CHRISTIAN SCHOOL (Students: 403, Location: 6115 ARLINGTON AVE, Grades: PK-6)
- IMMANUEL LUTHERAN SCHOOLS (Students: 263, Location: 5545 ALESSANDRO BLVD, Grades: PK-6)
- OUR LADY OF PERPETUAL HELP SCHOOL (Students: 257, Location: 6686 STREETER AVE, Grades: PK-8)
- ST FRANCIS DE SALES SCHOOL (Students: 248, Location: 4205 MULBERRY ST, Grades: PK-8)
- ST THOMAS THE APOSTLE SCHOOL (Students: 207, Location: 9136 MAGNOLIA AVE, Grades: KG-8)
- RIVERSIDE MONTESSORI ACADEMY (Students: 87, Location: 7141 INDIANA AVE, Grades: PK-3)
- ALL SAINTS CARDEN ACADEMY (Students: 76, Location: 3847 TERRACINA DR, Grades: KG-6)
- APPLE TREE LEARNING CENTER (Students: 55, Location: 220 W BIG SPRINGS RD, Grades: PK-1)
- ISLAMIC ACADEMY OF RIVERSIDE (Students: 55, Location: 1038 W LINDEN ST # B, Grades: PK-4)
- MONTESSORI CHILDRENS HOUSE (Students: 49, Location: 10493 MAGNOLIA AVE, Grades: PK-2)
Libraries in Riverside:
- RIVERSIDE COUNTY LIBRARY SYSTEM (Operating income: $19,457,629; Location: 4080 LEMON ST, 4TH FLOOR; 1,351,260 books; 47,862 audio materials; 79,635 video materials; 37 local licensed databases; 2,139 print serial subscriptions; 2 electronic serial subscriptions)
- RIVERSIDE PUBLIC LIBRARY (Operating income: $10,110,225; Location: 3581 MISSION INN AVE.; 481,472 books; 1,552 e-books; 15,332 audio materials; 26,442 video materials; 19 other licensed databases; 797 print serial subscriptions; 1 electronic serial subscriptions)
User-submitted facts and corrections:
- Area code also includes 951-
- reggie miller nba player indiana pacers born in riverside ca added by cisco
- reggie miller nba player indiana pacers born in riverside ca added by cisco
- hello there I just thought I would let you know the area code for riverside is no longer 909 but has been changed to 951
- Strongest FM radio stations in Riverside: KWIE 96.1 FM SAN BERNARDINO, CA www.wild96.com Owner: Styles Media
- Queen of Angels School closed at the end of the 2004-2005 school year.
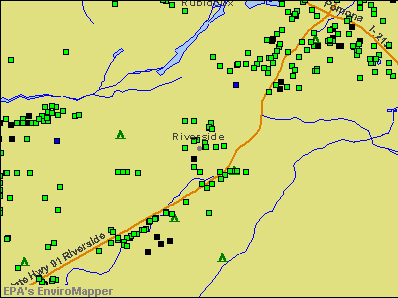
Points of interest:
Notable locations in Riverside: Juvenile Hall (A), Riverside City Sewage Treatment Plant (B), Riverside Water Quality Control Plant (C), Van Buren Drive-In (D), Riverside Plaza (E), Van Buren Golf Center (F), Camp Evans (G), Box Springs (H), Victoria Golf Course (I), Springbrook Golf and Country Club (J), Arlington Plaza (K), Fairmont Park Golf Course (L), Canyon Crest Golf Course (M), Arlington Water Plant Number 2 (N), Mount Rubidoux Manor (O), Robert Presley Detention Center (P), California Tower (Q), Riverside County Building (R), American Medical Response Riverside (S), American Medical Response Sterling (T). Display/hide their locations on the map
Shopping Centers: University Shopping Center (1), University Center Shopping Center (2), Town Square Shopping Center (3), Magnolia Town Center Shopping Center (4), Jurupa Grand Center Shopping Center (5), Brocktown Arcade Shopping Center (6), University Village Shopping Center (7), Victoria Village Shopping Center (8), Madington Square Shopping Center (9). Display/hide their locations on the map
Main business address in Riverside include: PROVIDENT FINANCIAL HOLDINGS INC (A), FLEETWOOD ENTERPRISES INC/DE/ (B). Display/hide their locations on the map
Churches in Riverside include: Bridges Christian Fellowship Church (A), Beth Simcha Messianic Congregation (B), Bahai Faith (C), Arlington Christian Church (D), Arlington Apostolic Church (E), Yeshua Ministry (F), Yahweh House of Worship (G), Wind of the Spirit Worship Center (H), Wesley United Methodist Church (I). Display/hide their locations on the map
Cemeteries: Olivewood Cemetery (1), Crestlawn Memorial Park (2). Display/hide their locations on the map
Lakes and reservoirs: Lake Evans (A), Hole Lake (B), Mockingbird Reservoir (C). Display/hide their locations on the map
Streams, rivers, and creeks: Tequesquito Arroyo (A), Tequesquite Arroyo (B), Spring Brook (C). Display/hide their locations on the map
Parks in Riverside include: Glory of Gods Grace Sculpture (1), Clough Park (2), Bordwell Park (3), Evans Park (4), Fairmount Park (5), Hunt Park (6), Hunter Park (7), Jones Park (8), La Sierra Park (9). Display/hide their locations on the map
Tourist attractions: Coral Sea Tropical Fish (Aquariums; 6709 Indiana Avenue) (1), About Chinese (Cultural Attractions- Events- & Facilities; 12702 Magnolia Avenue) (2), Amf Bowling Centers-Amf Riverside Lanes (Amusement & Theme Parks; 10781 Indiana Avenue) (3), Citinet (8022 Limonite Avenue) (4), California State of Parks & Recreation Department - California Citrus State Historic (Recreational Trips & Guides; 9400 Dufferin Avenue) (5). Display/hide their approximate locations on the map
Hotels: Airport-Inn (6759 Arlington Avenue) (1), Arlington Motor Inn (6843 Arlington Avenue) (2), Best Western of Riverside (10518 Magnolia Avenue) (3), American Inn (11057 Magnolia Avenue) (4), Budget Inn (1911 University Avenue) (5), Budget Inn of Riverside (1911 University Ave) (6), Big L Motel (3870 Ottawa Avenue) (7). Display/hide their approximate locations on the map
Courts: United States Government - Courts- Bankruptcy Court-Central District Of California- Riverside Of (3420 12th Street) (1), Riverside County - Superior Court Of California County Of Riverside (9991 County Farm Road) (2), Courts-Federal - District Court- Clerk's Office (3470 12th Street) (3), California State - Court Of Appeal (3389 12th Street) (4). Display/hide their approximate locations on the map
Birthplace of: J. F. Lawton - Screenwriter, Don Imus - Radio personality, Amy Lee - Evanescence vocalist and pianist, Duncan Hunter - Politician politician, Hakim Akbar - Player of and football, Ken Hubbs - Baseball player, Jesse B. Oldendorf - Recipient of the Purple Heart medal, Adam Kennedy - 2005 Major League Baseball player (Los Angeles Angels, born: Jan 10, 1976), Derrick Johnson - 2005 NFL player (San Francisco 49ers, born: Feb 9, 1982), Tyree Washington - Sprinter.
Drinking water stations with addresses in Riverside that have no violations reported:
| This city: | 3.2 people |
| California: | 2.9 people |
| This city: | 71.4% |
| Whole state: | 68.7% |
| This city: | 7.8% |
| Whole state: | 7.2% |
Likely homosexual households (counted as self-reported same-sex unmarried-partner households)
- Lesbian couples: 0.5% of all households
- Gay men: 0.3% of all households
People in group quarters in Riverside in 2010:
- 7,379 people in college/university student housing
- 1,153 people in nursing facilities/skilled-nursing facilities
- 1,065 people in local jails and other municipal confinement facilities
- 473 people in group homes intended for adults
- 408 people in other noninstitutional facilities
- 403 people in residential treatment centers for adults
- 178 people in emergency and transitional shelters (with sleeping facilities) for people experiencing homelessness
- 162 people in correctional facilities intended for juveniles
- 134 people in residential schools for people with disabilities
- 84 people in workers' group living quarters and job corps centers
- 59 people in state prisons
- 22 people in group homes for juveniles (non-correctional)
- 20 people in residential treatment centers for juveniles (non-correctional)
- 6 people in in-patient hospice facilities
- 3 people in correctional residential facilities
People in group quarters in Riverside in 2000:
- 2,814 people in college dormitories (includes college quarters off campus)
- 1,180 people in nursing homes
- 999 people in local jails and other confinement facilities (including police lockups)
- 603 people in other noninstitutional group quarters
- 424 people in other group homes
- 369 people in homes for the mentally retarded
- 297 people in homes for the mentally ill
- 273 people in unknown juvenile institutions
- 258 people in homes or halfway houses for drug/alcohol abuse
- 175 people in institutions for the deaf
- 121 people in other nonhousehold living situations
- 87 people in other types of correctional institutions
- 65 people in hospitals or wards for drug/alcohol abuse
- 51 people in hospitals/wards and hospices for chronically ill
- 51 people in other hospitals or wards for chronically ill
- 51 people in mental (psychiatric) hospitals or wards
- 29 people in religious group quarters
- 2 people in other workers' dormitories
Banks with most branches in Riverside (2011 data):
- Wells Fargo Bank, National Association: 10 branches. Info updated 2011/04/05: Bank assets: $1,161,490.0 mil, Deposits: $905,653.0 mil, headquarters in Sioux Falls, SD, positive income, 6395 total offices, Holding Company: Wells Fargo & Company
- Bank of America, National Association: 9 branches. Info updated 2009/11/18: Bank assets: $1,451,969.3 mil, Deposits: $1,077,176.8 mil, headquarters in Charlotte, NC, positive income, 5782 total offices, Holding Company: Bank Of America Corporation
- JPMorgan Chase Bank, National Association: 7 branches. Info updated 2011/11/10: Bank assets: $1,811,678.0 mil, Deposits: $1,190,738.0 mil, headquarters in Columbus, OH, positive income, International Specialization, 5577 total offices, Holding Company: Jpmorgan Chase & Co.
- U.S. Bank National Association: Riverside Branch, Riverside El Tapatio Branch, Riverside Ralphs Branch, Riverside - Orangecrest Branch, La Sierra Avenue Ralphs Branch, Riverside & Union Vons Branch. Info updated 2012/01/30: Bank assets: $330,470.8 mil, Deposits: $236,091.5 mil, headquarters in Cincinnati, OH, positive income, 3121 total offices, Holding Company: U.S. Bancorp
- Provident Savings Bank, F.S.B.: Van Buren Blvd Branch, Provident Savings Bank, F.S.b., 4001 Main Street Branch, Riverside Branch, 5225 Canyon Crest Dr Branch. Info updated 2011/07/21: Bank assets: $1,298.6 mil, Deposits: $963.9 mil, local headquarters, positive income, Commercial Lending Specialization, 14 total offices
- Union Bank, National Association: Canyon Springs, Glen Avon Branch, Arlington Branch, Mission Grove Branch, Riverside Downtown. Info updated 2011/09/01: Bank assets: $88,967.5 mil, Deposits: $65,286.4 mil, headquarters in San Francisco, CA, positive income, Commercial Lending Specialization, 403 total offices, Holding Company: Mitsubishi Ufj Financial Group, Inc.
- Compass Bank: Woodcrest Branch, Tyler Branch, Hardman Center Branch, Canyon Crest Branch. Info updated 2011/02/24: Bank assets: $63,107.0 mil, Deposits: $46,232.4 mil, headquarters in Birmingham, AL, negative income in the last year, Commercial Lending Specialization, 720 total offices, Holding Company: Banco Bilbao Vizcaya Argentaria, S.A.
- Citibank, National Association: 3605 Central Ave Branch, 1651 University Avenue Branch, 3580 Tyler Street Branch. Info updated 2012/01/10: Bank assets: $1,288,658.0 mil, Deposits: $882,541.0 mil, headquarters in Sioux Falls, SD, positive income, International Specialization, 1048 total offices, Holding Company: Citigroup Inc.
- Premier Service Bank: Courier Service Branch at 3637 Arlington Avenue, Suite B, branch established on 2001/09/10; at 3637 Arlington Avenue, Suite B, branch established on 2001/09/10. Info updated 2006/11/03: Bank assets: $141.3 mil, Deposits: $111.8 mil, local headquarters, negative income in the last year, Commercial Lending Specialization, 3 total offices
- 9 other banks with 10 local branches
For population 15 years and over in Riverside:
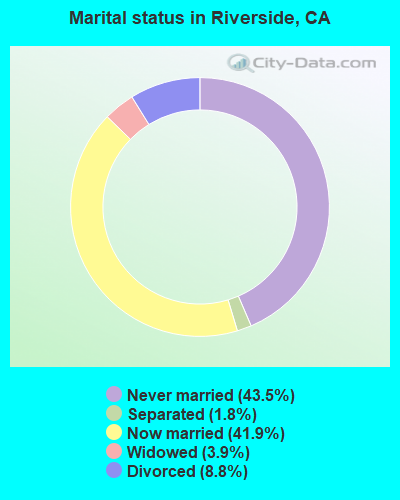
- Never married: 43.5%
- Now married: 41.9%
- Separated: 1.8%
- Widowed: 3.9%
- Divorced: 8.8%
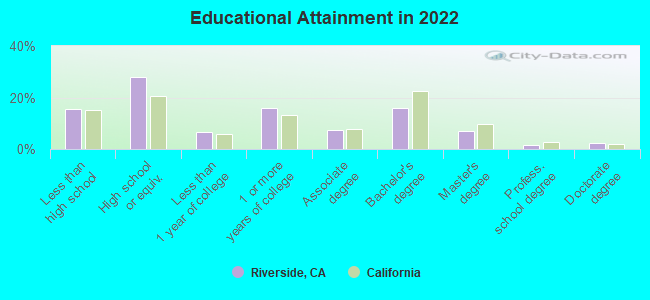
For population 25 years and over in Riverside:
- High school or higher: 84.4%
- Bachelor's degree or higher: 26.7%
- Graduate or professional degree: 10.8%
- Unemployed: 3.7%
- Mean travel time to work (commute): 26.7 minutes
| Here: | 15.0 |
| California average: | 15.5 |


Graphs represent county-level data. Detailed 2008 Election Results
Neighborhoods in Riverside:
(Riverside, California Neighborhood Map)- Airport neighborhood
- Allesandro Heights neighborhood
- Arlanza neighborhood
- Arlington neighborhood
- Arlington Heights neighborhood
- Arlington South neighborhood
- Canyon Crest neighborhood
- Casa Blanca neighborhood
- Downtown neighborhood
- Eastside neighborhood
- Grand neighborhood
- Hawarden Hills neighborhood
- Hunter Industrial Park neighborhood
- La Sierra neighborhood
- La Sierra Acres neighborhood
- La Sierra Hills neighborhood
- La Sierra South neighborhood
- Magnolia Center neighborhood
- Mission Grove neighborhood
- Northside neighborhood
- Orangecrest neighborhood
- Presidential Park neighborhood
- Ramona neighborhood
- Sycamore Canyon (Sycamore Springs) neighborhood
- University neighborhood
- Victoria neighborhood
- Wood Streets neighborhood
Religion statistics for Riverside, CA (based on Riverside County data)


| Religion | Adherents | Congregations |
|---|---|---|
| Catholic | 602,765 | 51 |
| Evangelical Protestant | 240,306 | 741 |
| Other | 77,581 | 194 |
| Mainline Protestant | 29,535 | 103 |
| Black Protestant | 19,170 | 40 |
| Orthodox | 3,647 | 11 |
| None | 1,216,637 | - |
Food Environment Statistics:
| Riverside County: | 1.60 / 10,000 pop. |
| California: | 2.14 / 10,000 pop. |
| This county: | 0.05 / 10,000 pop. |
| California: | 0.04 / 10,000 pop. |
| Here: | 0.44 / 10,000 pop. |
| California: | 0.62 / 10,000 pop. |
| Here: | 1.51 / 10,000 pop. |
| California: | 1.49 / 10,000 pop. |
| Riverside County: | 5.45 / 10,000 pop. |
| California: | 7.42 / 10,000 pop. |
| Here: | 7.7% |
| California: | 7.3% |
| This county: | 24.5% |
| California: | 21.3% |
| Riverside County: | 15.2% |
| California: | 17.9% |
Health and Nutrition:
| Riverside: | 48.0% |
| State: | 49.4% |
| This city: | 47.0% |
| State: | 48.0% |
| This city: | 28.4 |
| California: | 28.1 |
| This city: | 21.1% |
| California: | 20.2% |
| Riverside: | 10.9% |
| State: | 11.2% |
| Here: | 6.8 |
| California: | 6.8 |
| This city: | 32.1% |
| State: | 31.5% |
| This city: | 55.9% |
| California: | 56.4% |
| Riverside: | 81.0% |
| California: | 80.9% |
More about Health and Nutrition of Riverside, CA Residents
| Local government employment and payroll (March 2022) | |||||
| Function | Full-time employees | Monthly full-time payroll | Average yearly full-time wage | Part-time employees | Monthly part-time payroll |
|---|---|---|---|---|---|
| Electric Power | 402 | $4,530,956 | $135,252 | 13 | $36,990 |
| Police Protection - Officers | 370 | $5,944,124 | $192,782 | 0 | $0 |
| Firefighters | 229 | $4,146,423 | $217,280 | 0 | $0 |
| Other and Unallocable | 167 | $1,686,353 | $121,175 | 2 | $4,721 |
| Water Supply | 159 | $1,769,875 | $133,575 | 2 | $2,232 |
| Police - Other | 145 | $1,159,113 | $95,927 | 20 | $55,649 |
| Other Government Administration | 144 | $1,361,483 | $113,457 | 7 | $13,379 |
| Sewerage | 107 | $991,815 | $111,232 | 0 | $0 |
| Parks and Recreation | 68 | $549,645 | $96,996 | 165 | $187,239 |
| Streets and Highways | 64 | $498,885 | $93,541 | 0 | $0 |
| Financial Administration | 57 | $567,278 | $119,427 | 4 | $4,250 |
| Solid Waste Management | 54 | $368,878 | $81,973 | 3 | $2,274 |
| Housing and Community Development (Local) | 54 | $509,999 | $113,333 | 2 | $7,696 |
| Local Libraries | 54 | $369,762 | $82,169 | 8 | $8,219 |
| Welfare | 40 | $184,144 | $55,243 | 4 | $3,794 |
| Judicial and Legal | 39 | $465,612 | $143,265 | 0 | $0 |
| Fire - Other | 12 | $96,170 | $96,170 | 0 | $0 |
| Airports | 6 | $47,486 | $94,972 | 0 | $0 |
| Totals for Government | 2,171 | $25,248,001 | $139,556 | 230 | $326,443 |
Riverside government finances - Expenditure in 2021 (per resident):
- Construction - Regular Highways: $34,201,000 ($106.62)
General - Other: $19,145,000 ($59.69)
Housing and Community Development: $15,239,000 ($47.51)
Police Protection: $490,000 ($1.53)
Parks and Recreation: $175,000 ($0.55)
- Current Operations - Electric Utilities: $304,608,000 ($949.63)
Police Protection: $108,814,000 ($339.23)
Local Fire Protection: $68,769,000 ($214.39)
Water Utilities: $45,662,000 ($142.35)
Central Staff Services: $37,128,000 ($115.75)
Sewerage: $31,597,000 ($98.51)
Solid Waste Management: $26,861,000 ($83.74)
Parks and Recreation: $24,939,000 ($77.75)
Regular Highways: $15,385,000 ($47.96)
Protective Inspection and Regulation - Other: $12,552,000 ($39.13)
Transit Utilities: $8,203,000 ($25.57)
Housing and Community Development: $7,161,000 ($22.32)
Judicial and Legal Services: $6,456,000 ($20.13)
Libraries: $6,140,000 ($19.14)
Health - Other: $3,235,000 ($10.09)
Parking Facilities: $3,210,000 ($10.01)
Air Transportation: $1,588,000 ($4.95)
- Electric Utilities - Interest on Debt: $25,903,000 ($80.75)
- General - Interest on Debt: $66,505,000 ($207.33)
- Transit Utilities - Interest on Debt: $148,000 ($0.46)
- Water Utilities - Interest on Debt: $9,731,000 ($30.34)
Riverside government finances - Revenue in 2021 (per resident):
- Charges - Sewerage: $66,323,000 ($206.77)
Solid Waste Management: $26,468,000 ($82.52)
Other: $15,349,000 ($47.85)
Housing and Community Development: $7,483,000 ($23.33)
Parking Facilities: $2,968,000 ($9.25)
Parks and Recreation: $2,783,000 ($8.68)
Regular Highways: $1,951,000 ($6.08)
Air Transportation: $1,709,000 ($5.33)
- Federal Intergovernmental - Other: $38,511,000 ($120.06)
Transit Utilities: $7,752,000 ($24.17)
Housing and Community Development: $2,936,000 ($9.15)
Air Transportation: $106,000 ($0.33)
- Local Intergovernmental - Other: $3,702,000 ($11.54)
- Miscellaneous - General Revenue - Other: $35,521,000 ($110.74)
Interest Earnings: $11,696,000 ($36.46)
Special Assessments: $8,822,000 ($27.50)
Fines and Forfeits: $2,119,000 ($6.61)
Rents: $1,907,000 ($5.95)
Sale of Property: $333,000 ($1.04)
Donations From Private Sources: $286,000 ($0.89)
- Revenue - Electric Utilities: $367,802,000 ($1146.64)
Water Utilities: $80,249,000 ($250.18)
Transit Utilities: $65,000 ($0.20)
- State Intergovernmental - Other: $23,445,000 ($73.09)
Highways: $13,216,000 ($41.20)
Electric Utilities: $5,059,000 ($15.77)
Transit Utilities: $274,000 ($0.85)
General Local Government Support: $249,000 ($0.78)
- Tax - General Sales and Gross Receipts: $157,880,000 ($492.20)
Property: $70,933,000 ($221.14)
Public Utilities Sales: $36,129,000 ($112.63)
Occupation and Business License - Other: $7,866,000 ($24.52)
Other Selective Sales: $5,801,000 ($18.08)
Documentary and Stock Transfer: $4,544,000 ($14.17)
Other License: $3,920,000 ($12.22)
Other: $1,242,000 ($3.87)
Riverside government finances - Debt in 2021 (per resident):
- Long Term Debt - Beginning Outstanding - Unspecified Public Purpose: $2,247,838,000 ($7007.76)
Outstanding Unspecified Public Purpose: $2,130,526,000 ($6642.04)
Retired Unspecified Public Purpose: $117,312,000 ($365.73)
Beginning Outstanding - Public Debt for Private Purpose: $9,375,000 ($29.23)
Outstanding Nonguaranteed - Industrial Revenue: $9,185,000 ($28.63)
Retired Nonguaranteed - Public Debt for Private Purpose: $190,000 ($0.59)
Riverside government finances - Cash and Securities in 2021 (per resident):
- Bond Funds - Cash and Securities: $52,850,000 ($164.76)
- Other Funds - Cash and Securities: $293,492,000 ($914.98)
- Sinking Funds - Cash and Securities: $44,129,000 ($137.57)
7.19% of this county's 2021 resident taxpayers lived in other counties in 2020 ($71,521 average adjusted gross income)
| Here: | 7.19% |
| California average: | 5.19% |
0.03% of residents moved from foreign countries ($210 average AGI)
Riverside County: 0.03% California average: 0.03%
Top counties from which taxpayers relocated into this county between 2020 and 2021:
| from Los Angeles County, CA | |
| from San Bernardino County, CA | |
| from Orange County, CA |
6.28% of this county's 2020 resident taxpayers moved to other counties in 2021 ($64,593 average adjusted gross income)
| Here: | 6.28% |
| California average: | 6.14% |
0.02% of residents moved to foreign countries ($200 average AGI)
Riverside County: 0.02% California average: 0.02%
Top counties to which taxpayers relocated from this county between 2020 and 2021:
| to San Bernardino County, CA | |
| to Los Angeles County, CA | |
| to Orange County, CA |
| Businesses in Riverside, CA | ||||
| Name | Count | Name | Count | |
|---|---|---|---|---|
| 24 Hour Fitness | 1 | Kincaid | 1 | |
| 7-Eleven | 10 | Kmart | 4 | |
| 99 Cents Only Stores | 5 | Kohl's | 2 | |
| ALDO | 1 | Kroger | 7 | |
| AMF Bowling | 1 | LA Fitness | 3 | |
| AT&T | 4 | La-Z-Boy | 1 | |
| Abercrombie & Fitch | 1 | Lane Bryant | 2 | |
| Ace Hardware | 3 | Lane Furniture | 4 | |
| Aeropostale | 1 | LensCrafters | 1 | |
| Albertsons | 3 | Little Caesars Pizza | 8 | |
| American Eagle Outfitters | 1 | Long John Silver's | 1 | |
| Ann Taylor | 1 | Lowe's | 1 | |
| Applebee's | 1 | Macy's | 1 | |
| Arby's | 1 | Marriott | 2 | |
| Audi | 1 | Marshalls | 1 | |
| AutoZone | 7 | MasterBrand Cabinets | 2 | |
| Avenue | 1 | Mazda | 1 | |
| BMW | 1 | McDonald's | 12 | |
| Bally Total Fitness | 1 | Men's Wearhouse | 1 | |
| Barnes & Noble | 1 | Motel 6 | 2 | |
| Baskin-Robbins | 3 | Motherhood Maternity | 2 | |
| Bath & Body Works | 1 | New Balance | 3 | |
| Bed Bath & Beyond | 2 | New York & Co | 1 | |
| Big O Tires | 2 | Nike | 17 | |
| Blockbuster | 4 | Nissan | 2 | |
| Budget Car Rental | 1 | Nordstrom | 1 | |
| Burger King | 4 | Office Depot | 1 | |
| Burlington Coat Factory | 1 | OfficeMax | 1 | |
| CVS | 8 | Old Navy | 1 | |
| Carl\s Jr. | 12 | Olive Garden | 1 | |
| Casual Male XL | 1 | Pac Sun | 1 | |
| Chevrolet | 1 | Panda Express | 5 | |
| Chick-Fil-A | 1 | Panera Bread | 1 | |
| Chico's | 1 | Papa John's Pizza | 3 | |
| Chipotle | 1 | Payless | 6 | |
| Church's Chicken | 1 | Penske | 3 | |
| Cinnabon | 1 | PetSmart | 1 | |
| Circle K | 12 | Pier 1 Imports | 2 | |
| Cold Stone Creamery | 5 | Pizza Hut | 8 | |
| Comfort Inn | 1 | Popeyes | 1 | |
| Curves | 4 | Quality | 1 | |
| DHL | 1 | Quiznos | 6 | |
| Dairy Queen | 2 | RadioShack | 6 | |
| Days Inn | 1 | Red Lobster | 1 | |
| Decora Cabinetry | 2 | Rite Aid | 7 | |
| Dennys | 3 | Ryder Rental & Truck Leasing | 1 | |
| Discount Tire | 2 | SAS Shoes | 1 | |
| Domino's Pizza | 7 | Safeway | 2 | |
| Econo Lodge | 1 | Sam's Club | 1 | |
| El Pollo Loco | 6 | Sears | 6 | |
| Express | 1 | Sephora | 1 | |
| Famous Footwear | 1 | Skechers USA | 1 | |
| FedEx | 39 | Spencer Gifts | 1 | |
| Firestone Complete Auto Care | 3 | Sprint Nextel | 5 | |
| Foot Locker | 1 | Staples | 3 | |
| Forever 21 | 2 | Starbucks | 18 | |
| Fredericks Of Hollywood | 1 | Subaru | 1 | |
| GNC | 6 | Subway | 27 | |
| GameStop | 5 | T-Mobile | 15 | |
| Goodwill | 1 | T.G.I. Driday's | 1 | |
| Gymboree | 1 | Taco Bell | 5 | |
| H&M | 1 | Target | 3 | |
| H&R Block | 10 | The Cheesecake Factory | 1 | |
| Haworth | 1 | Torrid | 1 | |
| Hilton | 1 | Toyota | 1 | |
| Hollister Co. | 1 | Toys"R"Us | 2 | |
| Home Depot | 1 | Trader Joe's | 1 | |
| Honda | 1 | True Value | 1 | |
| Hot Topic | 1 | U-Haul | 17 | |
| Hyatt | 1 | UPS | 26 | |
| IHOP | 3 | Vans | 8 | |
| JCPenney | 1 | Verizon Wireless | 4 | |
| Jack In The Box | 13 | Victoria's Secret | 1 | |
| Jamba Juice | 1 | Volkswagen | 1 | |
| JoS. A. Bank | 1 | Vons | 2 | |
| Jones New York | 10 | Walgreens | 5 | |
| Journeys | 1 | Walmart | 2 | |
| Justice | 1 | Wendy's | 4 | |
| KFC | 4 | YMCA | 2 | |
Strongest AM radio stations in Riverside:
- KPRO (1570 AM; 5 kW; RIVERSIDE, CA; Owner: OLIVE L. SHERBAN)
- KPLS (830 AM; 50 kW; ORANGE, CA; Owner: CRN LICENSES, LLC)
- KLAC (570 AM; 50 kW; LOS ANGELES, CA; Owner: AMFM RADIO LICENSES, L.L.C.)
- KFI (640 AM; 50 kW; LOS ANGELES, CA; Owner: CAPSTAR TX LIMITED PARTNERSHIP)
- KTNQ (1020 AM; 50 kW; LOS ANGELES, CA; Owner: KTNQ-AM LICENSE CORP.)
- KWRM (1370 AM; 5 kW; CORONA, CA; Owner: MAJOR MARKET STATIONS, INC.)
- KXTA (1150 AM; 50 kW; LOS ANGELES, CA; Owner: CITICASTERS LICENSES, L.P.)
- KHPY (1670 AM; 10 kW; MORENO VALLEY, CA; Owner: DELBERT L. VAN VOORHIS)
- KDIS (1110 AM; 50 kW; PASADENA, CA; Owner: ABC,INC.)
- KRLH (590 AM; 2 kW; SAN BERNARDINO, CA; Owner: CARON BROADCASTING, INC.)
- KTDD (1350 AM; 5 kW; SAN BERNARDINO, CA)
- KSPA (1510 AM; 10 kW; ONTARIO, CA; Owner: ONTARIO BROADCASTING, LLC)
- KFWB (980 AM; 50 kW; LOS ANGELES, CA; Owner: INFINITY BROADCASTING OPERATIONS, INC.)
Strongest FM radio stations in Riverside:
- KOLA (99.9 FM; SAN BERNARDINO, CA; Owner: INLAND EMPIRE BROADCASTING CORP.)
- KUCR (88.3 FM; RIVERSIDE, CA; Owner: THE REGENTS OF THE UNIV. OF CA)
- KVCR (91.9 FM; SAN BERNARDINO, CA; Owner: SAN BERNARDINO COMMUNITY COLLEGE DISTRICT)
- KUOR-FM (89.1 FM; REDLANDS, CA; Owner: UNIVERSITY OF REDLANDS)
- KLRD (90.1 FM; YUCAIPA, CA; Owner: EDUCATIONAL MEDIA FOUNDATION)
- K295AI (106.9 FM; MUSCOY, CA; Owner: ASSOCIATION FOR COMMUNITY EDUCATION, INC.)
- KCXX (103.9 FM; LAKE ARROWHEAD, CA; Owner: ALL-PRO BROADCASTING, INC.)
- K264AF (100.7 FM; GUASTI, CA; Owner: EDUCATIONAL MEDIA FOUNDATION)
- KWVE (107.9 FM; SAN CLEMENTE, CA; Owner: CALVARY CHAPEL OF COSTA MESA)
- KRTM (88.9 FM; TEMECULA, CA; Owner: PENFOLD COMMUNICATIONS, INC.)
- KGGI (99.1 FM; RIVERSIDE, CA; Owner: AMFM RADIO LICENSES, L.L.C.)
- KLYY (97.5 FM; RIVERSIDE, CA; Owner: ENTRAVISION HOLDINGS, LLC)
- K201CD (88.1 FM; VICTORVILLE, CA; Owner: SAN BERNARDINO COMMNTY COLLEGE DIST.)
- K201AR (88.1 FM; BANNING, CA; Owner: KSGN, INC.)
- K232CX (94.3 FM; DESERT HOT SPRINGS, CA; Owner: MCC RADIO, LLC)
- KCBS-FM (93.1 FM; LOS ANGELES, CA; Owner: INFINITY BROADCASTING OPERATIONS, INC.)
- KSCA (101.9 FM; GLENDALE, CA; Owner: HBC LICENSE CORPORATION)
- KLOS (95.5 FM; LOS ANGELES, CA; Owner: KLOS-FM RADIO, INC.)
- K212FA (90.3 FM; TEMPLE CITY, CA; Owner: EDUCATIONAL MEDIA FOUNDATION)
- KOST (103.5 FM; LOS ANGELES, CA; Owner: CAPSTAR TX LIMITED PARTNERSHIP)
TV broadcast stations around Riverside:
- KVCR-TV (Channel 24; SAN BERNARDINO, CA; Owner: SAN BERNARDINO COMMUNITY COLLEGE DISTRICT)
- KTRO-LP (Channel 50; LANCASTER, CA; Owner: ROBERT D. ADELMAN)
- KHIZ (Channel 64; BARSTOW, CA; Owner: SUNBELT TELEVISION, INC.)
- KBLM-LP (Channel 25; RIVERSIDE/PERRIS, CA; Owner: LOUIS MARTINEZ FAMILY GROUP, LLC)
- KSGA-LP (Channel 59; SANTA BARBARA, CA; Owner: KJLA, LLC)
- National Bridge Inventory (NBI) Statistics
- 182Number of bridges
- 3,241ft / 988mTotal length
- $24,173,000Total costs
- 13,074,247Total average daily traffic
- 929,308Total average daily truck traffic
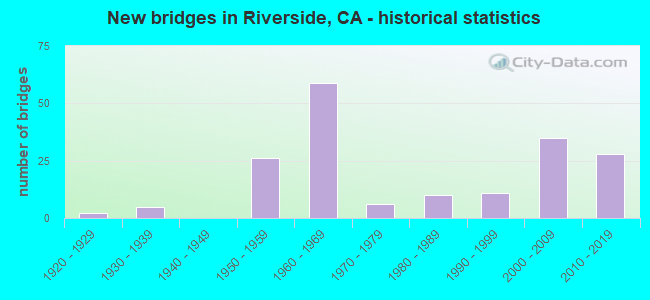
- New bridges - historical statistics
- 21920-1929
- 51930-1939
- 261950-1959
- 591960-1969
- 61970-1979
- 101980-1989
- 111990-1999
- 352000-2009
- 282010-2019
FCC Registered Antenna Towers: 1,372 (See the full list of FCC Registered Antenna Towers)
FCC Registered Commercial Land Mobile Towers: 6 (See the full list of FCC Registered Commercial Land Mobile Towers in Riverside, CA)
FCC Registered Private Land Mobile Towers: 4 (See the full list of FCC Registered Private Land Mobile Towers)
FCC Registered Broadcast Land Mobile Towers: 230 (See the full list of FCC Registered Broadcast Land Mobile Towers)
FCC Registered Microwave Towers: 212 (See the full list of FCC Registered Microwave Towers in this town)
FCC Registered Paging Towers: 4 (See the full list of FCC Registered Paging Towers)
FCC Registered Maritime Coast & Aviation Ground Towers: 8 (See the full list of FCC Registered Maritime Coast & Aviation Ground Towers)
FCC Registered Amateur Radio Licenses: 1,957 (See the full list of FCC Registered Amateur Radio Licenses in Riverside)
FAA Registered Aircraft Manufacturers and Dealers: 15 (See the full list of FAA Registered Manufacturers and Dealers in Riverside)
FAA Registered Aircraft: 307 (See the full list of FAA Registered Aircraft)
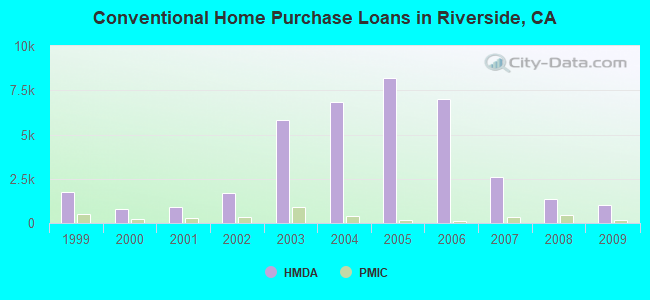
| Home Mortgage Disclosure Act Aggregated Statistics For Year 2009 (Based on 52 full and 8 partial tracts) | ||||||||||||||
| A) FHA, FSA/RHS & VA Home Purchase Loans | B) Conventional Home Purchase Loans | C) Refinancings | D) Home Improvement Loans | E) Loans on Dwellings For 5+ Families | F) Non-occupant Loans on < 5 Family Dwellings (A B C & D) | G) Loans On Manufactured Home Dwelling (A B C & D) | ||||||||
|---|---|---|---|---|---|---|---|---|---|---|---|---|---|---|
| Number | Average Value | Number | Average Value | Number | Average Value | Number | Average Value | Number | Average Value | Number | Average Value | Number | Average Value | |
| LOANS ORIGINATED | 1,647 | $191,076 | 1,011 | $184,019 | 2,110 | $212,125 | 137 | $122,297 | 7 | $5,496,593 | 455 | $131,564 | 7 | $137,490 |
| APPLICATIONS APPROVED, NOT ACCEPTED | 163 | $189,145 | 156 | $168,914 | 289 | $214,726 | 39 | $79,252 | 0 | $0 | 77 | $142,989 | 6 | $90,570 |
| APPLICATIONS DENIED | 314 | $193,562 | 285 | $177,589 | 1,141 | $232,978 | 107 | $74,917 | 2 | $410,000 | 207 | $147,046 | 17 | $96,986 |
| APPLICATIONS WITHDRAWN | 260 | $194,103 | 187 | $178,689 | 622 | $230,461 | 41 | $152,464 | 2 | $3,196,580 | 122 | $146,956 | 1 | $178,000 |
| FILES CLOSED FOR INCOMPLETENESS | 68 | $196,101 | 42 | $189,896 | 198 | $228,196 | 13 | $181,134 | 0 | $0 | 31 | $150,043 | 1 | $36,000 |
Detailed mortgage data for all 60 tracts in Riverside, CA
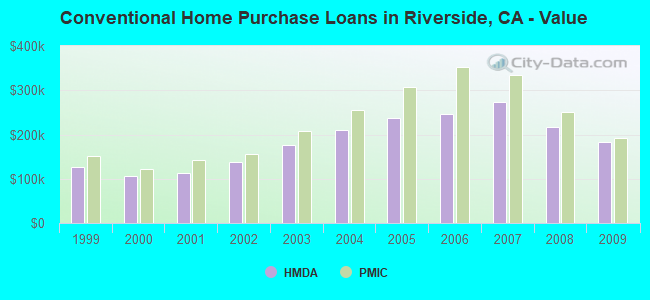
| Private Mortgage Insurance Companies Aggregated Statistics For Year 2009 (Based on 47 full and 7 partial tracts) | ||||||
| A) Conventional Home Purchase Loans | B) Refinancings | C) Non-occupant Loans on < 5 Family Dwellings (A & B) | ||||
|---|---|---|---|---|---|---|
| Number | Average Value | Number | Average Value | Number | Average Value | |
| LOANS ORIGINATED | 146 | $191,701 | 21 | $230,674 | 2 | $139,240 |
| APPLICATIONS APPROVED, NOT ACCEPTED | 76 | $198,254 | 16 | $297,171 | 1 | $187,000 |
| APPLICATIONS DENIED | 29 | $202,888 | 9 | $214,937 | 1 | $326,000 |
| APPLICATIONS WITHDRAWN | 15 | $228,227 | 4 | $295,405 | 0 | $0 |
| FILES CLOSED FOR INCOMPLETENESS | 5 | $325,572 | 4 | $289,392 | 0 | $0 |
2005 - 2018 National Fire Incident Reporting System (NFIRS) incidents
- Fire incident types reported to NFIRS in Riverside, CA
- 4,62652.0%Outside Fires
- 2,24725.2%Structure Fires
- 1,91821.6%Mobile Property/Vehicle Fires
- 1091.2%Other
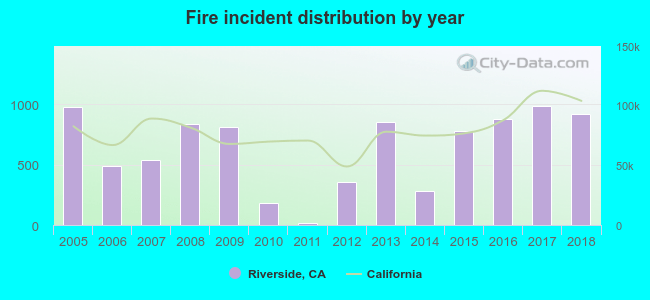 Based on the data from the years 2005 - 2018 the average number of fires per year is 636. The highest number of fire incidents - 988 took place in 2017, and the least - 15 in 2011. The data has a dropping trend.
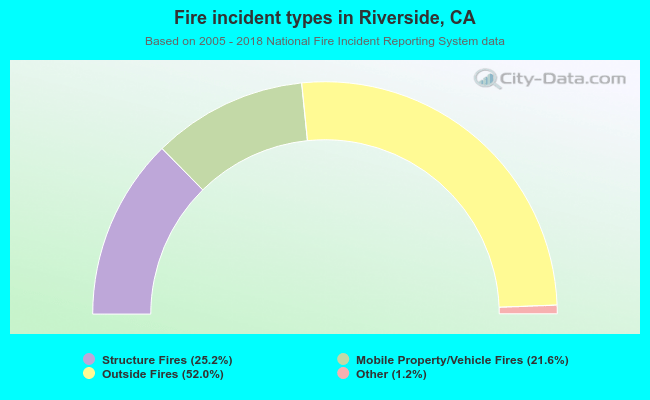 When looking into fire subcategories, the most reports belonged to: Outside Fires (52.0%), and Structure Fires (25.2%).
Fire-safe hotels and motels in Riverside, California:
- Riverside Marriott, 3400 Market St, Riverside, California 92501 , Phone: (951) 784-8000, Fax: (951) 781-3722
- Courtyard By Marriott, Riverside, 1510 University Ave, Riverside, California 92507 , Phone: (951) 276-1200, Fax: (951) 787-6783
- Dynasty Suites Hotel, 3735 Iowa Ave, Riverside, California 92507 , Phone: (951) 369-8200, Fax: (951) 341-6486
- Quality Inn & Suites, 11043 Magnolia Ave, Riverside, California 92505 , Phone: (951) 688-5000, Fax: (951) 785-5655
- Econo Lodge, 10705 Magnolia Ave, Riverside, California 92505 , Phone: (951) 351-2424, Fax: (951) 687-5070
- Comfort Inn of Riverside, 1590 University Ave, Riverside, California 92507 , Phone: (951) 683-6000, Fax: (951) 782-8052
- Hampton Inn Norco, 1530 Hamner Ave, Riverside, California 92503 , Phone: (951) 279-1111, Fax: (951) 279-1511
- Americas Best Value Inn Riverside Hotel, 4045 University Ave, Riverside, California 92501 , Phone: (951) 686-6666, Fax: (951) 784-4825
- 5 other hotels and motels
| Most common first names in Riverside, CA among deceased individuals | ||
| Name | Count | Lived (average) |
|---|---|---|
| John | 1,384 | 73.7 years |
| Mary | 1,235 | 79.1 years |
| William | 1,205 | 74.1 years |
| Robert | 1,083 | 70.4 years |
| James | 1,005 | 70.5 years |
| Charles | 701 | 73.7 years |
| George | 699 | 75.8 years |
| Helen | 594 | 80.8 years |
| Dorothy | 579 | 78.0 years |
| Margaret | 549 | 79.0 years |
| Most common last names in Riverside, CA among deceased individuals | ||
| Last name | Count | Lived (average) |
|---|---|---|
| Smith | 545 | 75.7 years |
| Johnson | 426 | 75.1 years |
| Brown | 336 | 74.9 years |
| Jones | 321 | 74.6 years |
| Miller | 304 | 75.6 years |
| Williams | 281 | 72.8 years |
| Davis | 236 | 73.7 years |
| Wilson | 219 | 78.8 years |
| Moore | 207 | 75.7 years |
| Anderson | 205 | 77.4 years |
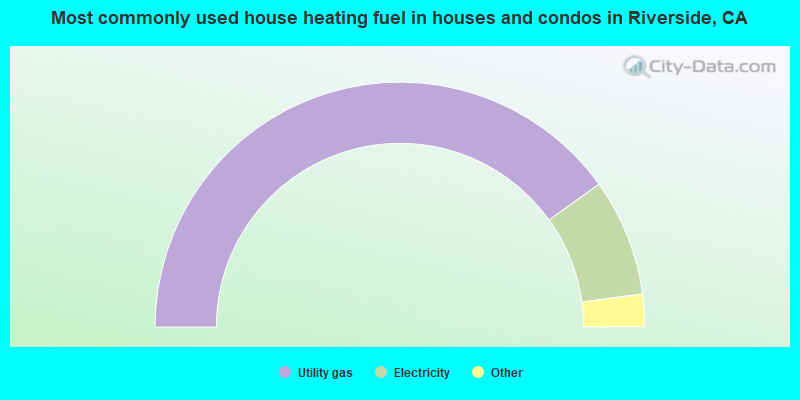
- 80.2%Utility gas
- 15.5%Electricity
- 2.1%No fuel used
- 0.9%Bottled, tank, or LP gas
- 0.6%Other fuel
- 0.5%Solar energy
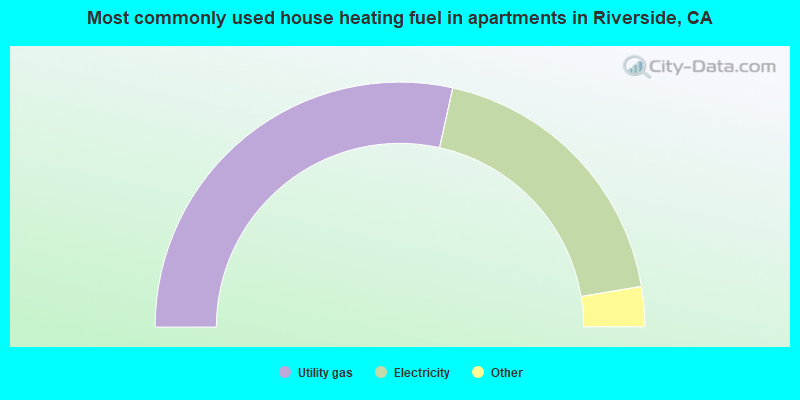
- 57.0%Utility gas
- 37.8%Electricity
- 3.0%No fuel used
- 1.7%Bottled, tank, or LP gas
- 0.3%Wood
- 0.2%Other fuel
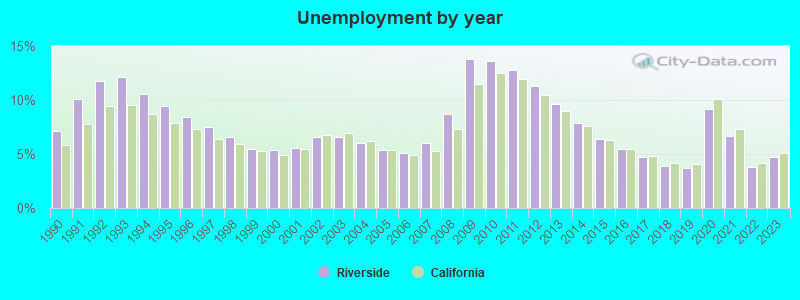
Riverside compared to California state average:
- Unemployed percentage significantly below state average.
- Hispanic race population percentage above state average.
Riverside, CA compared to other similar cities:
Riverside on our top lists:
- #21 on the list of "Top 101 cities with the largest percentage of people in institutions for the deaf (population 1,000+)"
- #50 on the list of "Top 101 cities with the lowest average yearly precipitation (population 50,000+)"
- #67 on the list of "Top 101 cities with largest percentage of females in industries: wholesale trade (population 50,000+)"
- #76 on the list of "Top 101 biggest cities in 2013"
- #76 on the list of "Top 100 biggest cities"
- #84 on the list of "Top 101 cities with the most cars per house, population 50,000+"
- #85 on the list of "Top 101 cities with largest percentage of females in occupations: construction and extraction occupations (population 50,000+)"
- #88 on the list of "Top 101 cities with largest percentage of females in occupations: architecture and engineering occupations (population 50,000+)"
- #91 on the list of "Top 101 cities with the largest differences between daily high and daily low temperatures (population 50,000+)"
- #96 on the list of "Top 101 cities with largest percentage of males in occupations: education, training, and library occupations (population 50,000+)"
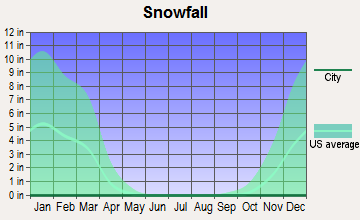
- #98 on the list of "Top 101 cities with the lowest average snowfall in a year (population 50,000+)"
- #3 on the list of "Top 101 counties with the highest lead air pollution readings in 2012 (µg/m3)"
- #4 on the list of "Top 101 counties with the highest ground withdrawal of fresh water for public supply"
- #11 on the list of "Top 101 counties with the most Catholic adherents"
- #11 on the list of "Top 101 counties with the highest total withdrawal of fresh water for public supply"
- #12 on the list of "Top 101 counties with the highest carbon monoxide air pollution readings in 2012 (ppm)"

|
|
Total of 1017 patent applications in 2008-2024.