Moreno Valley, California Submit your own pictures of this city and show them to the world
OSM Map
General Map
Google Map
MSN Map
OSM Map
General Map
Google Map
MSN Map
OSM Map
General Map
Google Map
MSN Map
OSM Map
General Map
Google Map
MSN Map
Please wait while loading the map...
Population in 2022: 211,924 (99% urban, 1% rural). Population change since 2000: +48.8%Males: 109,257 Females: 102,667
March 2022 cost of living index in Moreno Valley: 82.5 (low, U.S. average is 100) Percentage of residents living in poverty in 2022: 12.1%for White Non-Hispanic residents , 13.9% for Black residents , 12.6% for Hispanic or Latino residents , 19.4% for American Indian residents , 27.5% for Native Hawaiian and other Pacific Islander residents , 10.8% for other race residents , 13.3% for two or more races residents )
Profiles of local businesses
Business Search - 14 Million verified businesses
Data:
Median household income ($)
Median household income (% change since 2000)
Household income diversity
Ratio of average income to average house value (%)
Ratio of average income to average rent
Median household income ($) - White
Median household income ($) - Black or African American
Median household income ($) - Asian
Median household income ($) - Hispanic or Latino
Median household income ($) - American Indian and Alaska Native
Median household income ($) - Multirace
Median household income ($) - Other Race
Median household income for houses/condos with a mortgage ($)
Median household income for apartments without a mortgage ($)
Races - White alone (%)
Races - White alone (% change since 2000)
Races - Black alone (%)
Races - Black alone (% change since 2000)
Races - American Indian alone (%)
Races - American Indian alone (% change since 2000)
Races - Asian alone (%)
Races - Asian alone (% change since 2000)
Races - Hispanic (%)
Races - Hispanic (% change since 2000)
Races - Native Hawaiian and Other Pacific Islander alone (%)
Races - Native Hawaiian and Other Pacific Islander alone (% change since 2000)
Races - Two or more races (%)
Races - Two or more races (% change since 2000)
Races - Other race alone (%)
Races - Other race alone (% change since 2000)
Racial diversity
Unemployment (%)
Unemployment (% change since 2000)
Unemployment (%) - White
Unemployment (%) - Black or African American
Unemployment (%) - Asian
Unemployment (%) - Hispanic or Latino
Unemployment (%) - American Indian and Alaska Native
Unemployment (%) - Multirace
Unemployment (%) - Other Race
Population density (people per square mile)
Population - Males (%)
Population - Females (%)
Population - Males (%) - White
Population - Males (%) - Black or African American
Population - Males (%) - Asian
Population - Males (%) - Hispanic or Latino
Population - Males (%) - American Indian and Alaska Native
Population - Males (%) - Multirace
Population - Males (%) - Other Race
Population - Females (%) - White
Population - Females (%) - Black or African American
Population - Females (%) - Asian
Population - Females (%) - Hispanic or Latino
Population - Females (%) - American Indian and Alaska Native
Population - Females (%) - Multirace
Population - Females (%) - Other Race
Coronavirus confirmed cases (Apr 26, 2024)
Deaths caused by coronavirus (Apr 26, 2024)
Coronavirus confirmed cases (per 100k population) (Apr 26, 2024)
Deaths caused by coronavirus (per 100k population) (Apr 26, 2024)
Daily increase in number of cases (Apr 26, 2024)
Weekly increase in number of cases (Apr 26, 2024)
Cases doubled (in days) (Apr 26, 2024)
Hospitalized patients (Apr 18, 2022)
Negative test results (Apr 18, 2022)
Total test results (Apr 18, 2022)
COVID Vaccine doses distributed (per 100k population) (Sep 19, 2023)
COVID Vaccine doses administered (per 100k population) (Sep 19, 2023)
COVID Vaccine doses distributed (Sep 19, 2023)
COVID Vaccine doses administered (Sep 19, 2023)
Likely homosexual households (%)
Likely homosexual households (% change since 2000)
Likely homosexual households - Lesbian couples (%)
Likely homosexual households - Lesbian couples (% change since 2000)
Likely homosexual households - Gay men (%)
Likely homosexual households - Gay men (% change since 2000)
Cost of living index
Median gross rent ($)
Median contract rent ($)
Median monthly housing costs ($)
Median house or condo value ($)
Median house or condo value ($ change since 2000)
Mean house or condo value by units in structure - 1, detached ($)
Mean house or condo value by units in structure - 1, attached ($)
Mean house or condo value by units in structure - 2 ($)
Mean house or condo value by units in structure by units in structure - 3 or 4 ($)
Mean house or condo value by units in structure - 5 or more ($)
Mean house or condo value by units in structure - Boat, RV, van, etc. ($)
Mean house or condo value by units in structure - Mobile home ($)
Median house or condo value ($) - White
Median house or condo value ($) - Black or African American
Median house or condo value ($) - Asian
Median house or condo value ($) - Hispanic or Latino
Median house or condo value ($) - American Indian and Alaska Native
Median house or condo value ($) - Multirace
Median house or condo value ($) - Other Race
Median resident age
Resident age diversity
Median resident age - Males
Median resident age - Females
Median resident age - White
Median resident age - Black or African American
Median resident age - Asian
Median resident age - Hispanic or Latino
Median resident age - American Indian and Alaska Native
Median resident age - Multirace
Median resident age - Other Race
Median resident age - Males - White
Median resident age - Males - Black or African American
Median resident age - Males - Asian
Median resident age - Males - Hispanic or Latino
Median resident age - Males - American Indian and Alaska Native
Median resident age - Males - Multirace
Median resident age - Males - Other Race
Median resident age - Females - White
Median resident age - Females - Black or African American
Median resident age - Females - Asian
Median resident age - Females - Hispanic or Latino
Median resident age - Females - American Indian and Alaska Native
Median resident age - Females - Multirace
Median resident age - Females - Other Race
Commute - mean travel time to work (minutes)
Travel time to work - Less than 5 minutes (%)
Travel time to work - Less than 5 minutes (% change since 2000)
Travel time to work - 5 to 9 minutes (%)
Travel time to work - 5 to 9 minutes (% change since 2000)
Travel time to work - 10 to 19 minutes (%)
Travel time to work - 10 to 19 minutes (% change since 2000)
Travel time to work - 20 to 29 minutes (%)
Travel time to work - 20 to 29 minutes (% change since 2000)
Travel time to work - 30 to 39 minutes (%)
Travel time to work - 30 to 39 minutes (% change since 2000)
Travel time to work - 40 to 59 minutes (%)
Travel time to work - 40 to 59 minutes (% change since 2000)
Travel time to work - 60 to 89 minutes (%)
Travel time to work - 60 to 89 minutes (% change since 2000)
Travel time to work - 90 or more minutes (%)
Travel time to work - 90 or more minutes (% change since 2000)
Marital status - Never married (%)
Marital status - Now married (%)
Marital status - Separated (%)
Marital status - Widowed (%)
Marital status - Divorced (%)
Median family income ($)
Median family income (% change since 2000)
Median non-family income ($)
Median non-family income (% change since 2000)
Median per capita income ($)
Median per capita income (% change since 2000)
Median family income ($) - White
Median family income ($) - Black or African American
Median family income ($) - Asian
Median family income ($) - Hispanic or Latino
Median family income ($) - American Indian and Alaska Native
Median family income ($) - Multirace
Median family income ($) - Other Race
Median year house/condo built
Median year apartment built
Year house built - Built 2005 or later (%)
Year house built - Built 2000 to 2004 (%)
Year house built - Built 1990 to 1999 (%)
Year house built - Built 1980 to 1989 (%)
Year house built - Built 1970 to 1979 (%)
Year house built - Built 1960 to 1969 (%)
Year house built - Built 1950 to 1959 (%)
Year house built - Built 1940 to 1949 (%)
Year house built - Built 1939 or earlier (%)
Average household size
Household density (households per square mile)
Average household size - White
Average household size - Black or African American
Average household size - Asian
Average household size - Hispanic or Latino
Average household size - American Indian and Alaska Native
Average household size - Multirace
Average household size - Other Race
Occupied housing units (%)
Vacant housing units (%)
Owner occupied housing units (%)
Renter occupied housing units (%)
Vacancy status - For rent (%)
Vacancy status - For sale only (%)
Vacancy status - Rented or sold, not occupied (%)
Vacancy status - For seasonal, recreational, or occasional use (%)
Vacancy status - For migrant workers (%)
Vacancy status - Other vacant (%)
Residents with income below the poverty level (%)
Residents with income below 50% of the poverty level (%)
Children below poverty level (%)
Poor families by family type - Married-couple family (%)
Poor families by family type - Male, no wife present (%)
Poor families by family type - Female, no husband present (%)
Poverty status for native-born residents (%)
Poverty status for foreign-born residents (%)
Poverty among high school graduates not in families (%)
Poverty among people who did not graduate high school not in families (%)
Residents with income below the poverty level (%) - White
Residents with income below the poverty level (%) - Black or African American
Residents with income below the poverty level (%) - Asian
Residents with income below the poverty level (%) - Hispanic or Latino
Residents with income below the poverty level (%) - American Indian and Alaska Native
Residents with income below the poverty level (%) - Multirace
Residents with income below the poverty level (%) - Other Race
Air pollution - Air Quality Index (AQI)
Air pollution - CO
Air pollution - NO2
Air pollution - SO2
Air pollution - Ozone
Air pollution - PM10
Air pollution - PM25
Air pollution - Pb
Crime - Murders per 100,000 population
Crime - Rapes per 100,000 population
Crime - Robberies per 100,000 population
Crime - Assaults per 100,000 population
Crime - Burglaries per 100,000 population
Crime - Thefts per 100,000 population
Crime - Auto thefts per 100,000 population
Crime - Arson per 100,000 population
Crime - City-data.com crime index
Crime - Violent crime index
Crime - Property crime index
Crime - Murders per 100,000 population (5 year average)
Crime - Rapes per 100,000 population (5 year average)
Crime - Robberies per 100,000 population (5 year average)
Crime - Assaults per 100,000 population (5 year average)
Crime - Burglaries per 100,000 population (5 year average)
Crime - Thefts per 100,000 population (5 year average)
Crime - Auto thefts per 100,000 population (5 year average)
Crime - Arson per 100,000 population (5 year average)
Crime - City-data.com crime index (5 year average)
Crime - Violent crime index (5 year average)
Crime - Property crime index (5 year average)
1996 Presidential Elections Results (%) - Democratic Party (Clinton)
1996 Presidential Elections Results (%) - Republican Party (Dole)
1996 Presidential Elections Results (%) - Other
2000 Presidential Elections Results (%) - Democratic Party (Gore)
2000 Presidential Elections Results (%) - Republican Party (Bush)
2000 Presidential Elections Results (%) - Other
2004 Presidential Elections Results (%) - Democratic Party (Kerry)
2004 Presidential Elections Results (%) - Republican Party (Bush)
2004 Presidential Elections Results (%) - Other
2008 Presidential Elections Results (%) - Democratic Party (Obama)
2008 Presidential Elections Results (%) - Republican Party (McCain)
2008 Presidential Elections Results (%) - Other
2012 Presidential Elections Results (%) - Democratic Party (Obama)
2012 Presidential Elections Results (%) - Republican Party (Romney)
2012 Presidential Elections Results (%) - Other
2016 Presidential Elections Results (%) - Democratic Party (Clinton)
2016 Presidential Elections Results (%) - Republican Party (Trump)
2016 Presidential Elections Results (%) - Other
2020 Presidential Elections Results (%) - Democratic Party (Biden)
2020 Presidential Elections Results (%) - Republican Party (Trump)
2020 Presidential Elections Results (%) - Other
Ancestries Reported - Arab (%)
Ancestries Reported - Czech (%)
Ancestries Reported - Danish (%)
Ancestries Reported - Dutch (%)
Ancestries Reported - English (%)
Ancestries Reported - French (%)
Ancestries Reported - French Canadian (%)
Ancestries Reported - German (%)
Ancestries Reported - Greek (%)
Ancestries Reported - Hungarian (%)
Ancestries Reported - Irish (%)
Ancestries Reported - Italian (%)
Ancestries Reported - Lithuanian (%)
Ancestries Reported - Norwegian (%)
Ancestries Reported - Polish (%)
Ancestries Reported - Portuguese (%)
Ancestries Reported - Russian (%)
Ancestries Reported - Scotch-Irish (%)
Ancestries Reported - Scottish (%)
Ancestries Reported - Slovak (%)
Ancestries Reported - Subsaharan African (%)
Ancestries Reported - Swedish (%)
Ancestries Reported - Swiss (%)
Ancestries Reported - Ukrainian (%)
Ancestries Reported - United States (%)
Ancestries Reported - Welsh (%)
Ancestries Reported - West Indian (%)
Ancestries Reported - Other (%)
Educational Attainment - No schooling completed (%)
Educational Attainment - Less than high school (%)
Educational Attainment - High school or equivalent (%)
Educational Attainment - Less than 1 year of college (%)
Educational Attainment - 1 or more years of college (%)
Educational Attainment - Associate degree (%)
Educational Attainment - Bachelor's degree (%)
Educational Attainment - Master's degree (%)
Educational Attainment - Professional school degree (%)
Educational Attainment - Doctorate degree (%)
School Enrollment - Nursery, preschool (%)
School Enrollment - Kindergarten (%)
School Enrollment - Grade 1 to 4 (%)
School Enrollment - Grade 5 to 8 (%)
School Enrollment - Grade 9 to 12 (%)
School Enrollment - College undergrad (%)
School Enrollment - Graduate or professional (%)
School Enrollment - Not enrolled in school (%)
School enrollment - Public schools (%)
School enrollment - Private schools (%)
School enrollment - Not enrolled (%)
Median number of rooms in houses and condos
Median number of rooms in apartments
Housing units lacking complete plumbing facilities (%)
Housing units lacking complete kitchen facilities (%)
Density of houses
Urban houses (%)
Rural houses (%)
Households with people 60 years and over (%)
Households with people 65 years and over (%)
Households with people 75 years and over (%)
Households with one or more nonrelatives (%)
Households with no nonrelatives (%)
Population in households (%)
Family households (%)
Nonfamily households (%)
Population in families (%)
Family households with own children (%)
Median number of bedrooms in owner occupied houses
Mean number of bedrooms in owner occupied houses
Median number of bedrooms in renter occupied houses
Mean number of bedrooms in renter occupied houses
Median number of vehichles in owner occupied houses
Mean number of vehichles in owner occupied houses
Median number of vehichles in renter occupied houses
Mean number of vehichles in renter occupied houses
Mortgage status - with mortgage (%)
Mortgage status - with second mortgage (%)
Mortgage status - with home equity loan (%)
Mortgage status - with both second mortgage and home equity loan (%)
Mortgage status - without a mortgage (%)
Average family size
Average family size - White
Average family size - Black or African American
Average family size - Asian
Average family size - Hispanic or Latino
Average family size - American Indian and Alaska Native
Average family size - Multirace
Average family size - Other Race
Geographical mobility - Same house 1 year ago (%)
Geographical mobility - Moved within same county (%)
Geographical mobility - Moved from different county within same state (%)
Geographical mobility - Moved from different state (%)
Geographical mobility - Moved from abroad (%)
Place of birth - Born in state of residence (%)
Place of birth - Born in other state (%)
Place of birth - Native, outside of US (%)
Place of birth - Foreign born (%)
Housing units in structures - 1, detached (%)
Housing units in structures - 1, attached (%)
Housing units in structures - 2 (%)
Housing units in structures - 3 or 4 (%)
Housing units in structures - 5 to 9 (%)
Housing units in structures - 10 to 19 (%)
Housing units in structures - 20 to 49 (%)
Housing units in structures - 50 or more (%)
Housing units in structures - Mobile home (%)
Housing units in structures - Boat, RV, van, etc. (%)
House/condo owner moved in on average (years ago)
Renter moved in on average (years ago)
Year householder moved into unit - Moved in 1999 to March 2000 (%)
Year householder moved into unit - Moved in 1995 to 1998 (%)
Year householder moved into unit - Moved in 1990 to 1994 (%)
Year householder moved into unit - Moved in 1980 to 1989 (%)
Year householder moved into unit - Moved in 1970 to 1979 (%)
Year householder moved into unit - Moved in 1969 or earlier (%)
Means of transportation to work - Drove car alone (%)
Means of transportation to work - Carpooled (%)
Means of transportation to work - Public transportation (%)
Means of transportation to work - Bus or trolley bus (%)
Means of transportation to work - Streetcar or trolley car (%)
Means of transportation to work - Subway or elevated (%)
Means of transportation to work - Railroad (%)
Means of transportation to work - Ferryboat (%)
Means of transportation to work - Taxicab (%)
Means of transportation to work - Motorcycle (%)
Means of transportation to work - Bicycle (%)
Means of transportation to work - Walked (%)
Means of transportation to work - Other means (%)
Working at home (%)
Industry diversity
Most Common Industries - Agriculture, forestry, fishing and hunting, and mining (%)
Most Common Industries - Agriculture, forestry, fishing and hunting (%)
Most Common Industries - Mining, quarrying, and oil and gas extraction (%)
Most Common Industries - Construction (%)
Most Common Industries - Manufacturing (%)
Most Common Industries - Wholesale trade (%)
Most Common Industries - Retail trade (%)
Most Common Industries - Transportation and warehousing, and utilities (%)
Most Common Industries - Transportation and warehousing (%)
Most Common Industries - Utilities (%)
Most Common Industries - Information (%)
Most Common Industries - Finance and insurance, and real estate and rental and leasing (%)
Most Common Industries - Finance and insurance (%)
Most Common Industries - Real estate and rental and leasing (%)
Most Common Industries - Professional, scientific, and management, and administrative and waste management services (%)
Most Common Industries - Professional, scientific, and technical services (%)
Most Common Industries - Management of companies and enterprises (%)
Most Common Industries - Administrative and support and waste management services (%)
Most Common Industries - Educational services, and health care and social assistance (%)
Most Common Industries - Educational services (%)
Most Common Industries - Health care and social assistance (%)
Most Common Industries - Arts, entertainment, and recreation, and accommodation and food services (%)
Most Common Industries - Arts, entertainment, and recreation (%)
Most Common Industries - Accommodation and food services (%)
Most Common Industries - Other services, except public administration (%)
Most Common Industries - Public administration (%)
Occupation diversity
Most Common Occupations - Management, business, science, and arts occupations (%)
Most Common Occupations - Management, business, and financial occupations (%)
Most Common Occupations - Management occupations (%)
Most Common Occupations - Business and financial operations occupations (%)
Most Common Occupations - Computer, engineering, and science occupations (%)
Most Common Occupations - Computer and mathematical occupations (%)
Most Common Occupations - Architecture and engineering occupations (%)
Most Common Occupations - Life, physical, and social science occupations (%)
Most Common Occupations - Education, legal, community service, arts, and media occupations (%)
Most Common Occupations - Community and social service occupations (%)
Most Common Occupations - Legal occupations (%)
Most Common Occupations - Education, training, and library occupations (%)
Most Common Occupations - Arts, design, entertainment, sports, and media occupations (%)
Most Common Occupations - Healthcare practitioners and technical occupations (%)
Most Common Occupations - Health diagnosing and treating practitioners and other technical occupations (%)
Most Common Occupations - Health technologists and technicians (%)
Most Common Occupations - Service occupations (%)
Most Common Occupations - Healthcare support occupations (%)
Most Common Occupations - Protective service occupations (%)
Most Common Occupations - Fire fighting and prevention, and other protective service workers including supervisors (%)
Most Common Occupations - Law enforcement workers including supervisors (%)
Most Common Occupations - Food preparation and serving related occupations (%)
Most Common Occupations - Building and grounds cleaning and maintenance occupations (%)
Most Common Occupations - Personal care and service occupations (%)
Most Common Occupations - Sales and office occupations (%)
Most Common Occupations - Sales and related occupations (%)
Most Common Occupations - Office and administrative support occupations (%)
Most Common Occupations - Natural resources, construction, and maintenance occupations (%)
Most Common Occupations - Farming, fishing, and forestry occupations (%)
Most Common Occupations - Construction and extraction occupations (%)
Most Common Occupations - Installation, maintenance, and repair occupations (%)
Most Common Occupations - Production, transportation, and material moving occupations (%)
Most Common Occupations - Production occupations (%)
Most Common Occupations - Transportation occupations (%)
Most Common Occupations - Material moving occupations (%)
People in Group quarters - Institutionalized population (%)
People in Group quarters - Correctional institutions (%)
People in Group quarters - Federal prisons and detention centers (%)
People in Group quarters - Halfway houses (%)
People in Group quarters - Local jails and other confinement facilities (including police lockups) (%)
People in Group quarters - Military disciplinary barracks (%)
People in Group quarters - State prisons (%)
People in Group quarters - Other types of correctional institutions (%)
People in Group quarters - Nursing homes (%)
People in Group quarters - Hospitals/wards, hospices, and schools for the handicapped (%)
People in Group quarters - Hospitals/wards and hospices for chronically ill (%)
People in Group quarters - Hospices or homes for chronically ill (%)
People in Group quarters - Military hospitals or wards for chronically ill (%)
People in Group quarters - Other hospitals or wards for chronically ill (%)
People in Group quarters - Hospitals or wards for drug/alcohol abuse (%)
People in Group quarters - Mental (Psychiatric) hospitals or wards (%)
People in Group quarters - Schools, hospitals, or wards for the mentally retarded (%)
People in Group quarters - Schools, hospitals, or wards for the physically handicapped (%)
People in Group quarters - Institutions for the deaf (%)
People in Group quarters - Institutions for the blind (%)
People in Group quarters - Orthopedic wards and institutions for the physically handicapped (%)
People in Group quarters - Wards in general hospitals for patients who have no usual home elsewhere (%)
People in Group quarters - Wards in military hospitals for patients who have no usual home elsewhere (%)
People in Group quarters - Juvenile institutions (%)
People in Group quarters - Long-term care (%)
People in Group quarters - Homes for abused, dependent, and neglected children (%)
People in Group quarters - Residential treatment centers for emotionally disturbed children (%)
People in Group quarters - Training schools for juvenile delinquents (%)
People in Group quarters - Short-term care, detention or diagnostic centers for delinquent children (%)
People in Group quarters - Type of juvenile institution unknown (%)
People in Group quarters - Noninstitutionalized population (%)
People in Group quarters - College dormitories (includes college quarters off campus) (%)
People in Group quarters - Military quarters (%)
People in Group quarters - On base (%)
People in Group quarters - Barracks, unaccompanied personnel housing (UPH), (Enlisted/Officer), ;and similar group living quarters for military personnel (%)
People in Group quarters - Transient quarters for temporary residents (%)
People in Group quarters - Military ships (%)
People in Group quarters - Group homes (%)
People in Group quarters - Homes or halfway houses for drug/alcohol abuse (%)
People in Group quarters - Homes for the mentally ill (%)
People in Group quarters - Homes for the mentally retarded (%)
People in Group quarters - Homes for the physically handicapped (%)
People in Group quarters - Other group homes (%)
People in Group quarters - Religious group quarters (%)
People in Group quarters - Dormitories (%)
People in Group quarters - Agriculture workers' dormitories on farms (%)
People in Group quarters - Job Corps and vocational training facilities (%)
People in Group quarters - Other workers' dormitories (%)
People in Group quarters - Crews of maritime vessels (%)
People in Group quarters - Other nonhousehold living situations (%)
People in Group quarters - Other noninstitutional group quarters (%)
Residents speaking English at home (%)
Residents speaking English at home - Born in the United States (%)
Residents speaking English at home - Native, born elsewhere (%)
Residents speaking English at home - Foreign born (%)
Residents speaking Spanish at home (%)
Residents speaking Spanish at home - Born in the United States (%)
Residents speaking Spanish at home - Native, born elsewhere (%)
Residents speaking Spanish at home - Foreign born (%)
Residents speaking other language at home (%)
Residents speaking other language at home - Born in the United States (%)
Residents speaking other language at home - Native, born elsewhere (%)
Residents speaking other language at home - Foreign born (%)
Class of Workers - Employee of private company (%)
Class of Workers - Self-employed in own incorporated business (%)
Class of Workers - Private not-for-profit wage and salary workers (%)
Class of Workers - Local government workers (%)
Class of Workers - State government workers (%)
Class of Workers - Federal government workers (%)
Class of Workers - Self-employed workers in own not incorporated business and Unpaid family workers (%)
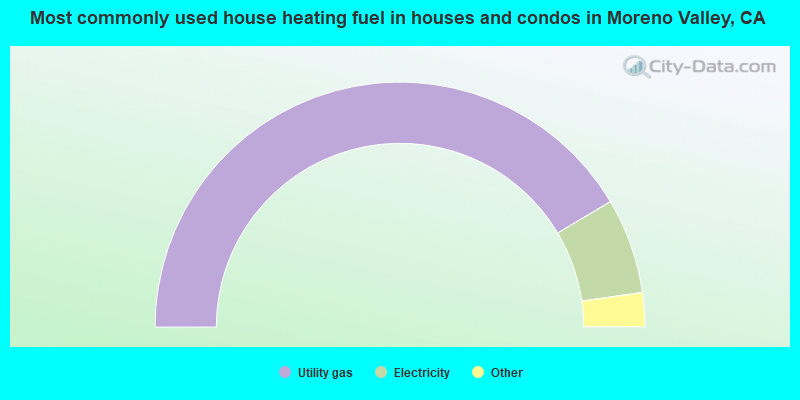
House heating fuel used in houses and condos - Utility gas (%)
House heating fuel used in houses and condos - Bottled, tank, or LP gas (%)
House heating fuel used in houses and condos - Electricity (%)
House heating fuel used in houses and condos - Fuel oil, kerosene, etc. (%)
House heating fuel used in houses and condos - Coal or coke (%)
House heating fuel used in houses and condos - Wood (%)
House heating fuel used in houses and condos - Solar energy (%)
House heating fuel used in houses and condos - Other fuel (%)
House heating fuel used in houses and condos - No fuel used (%)
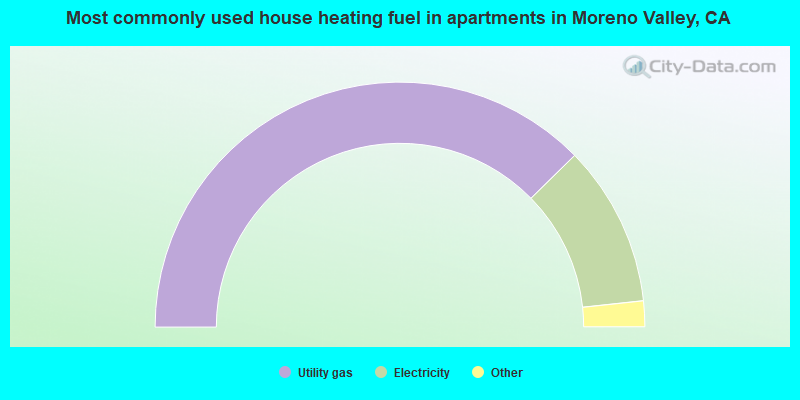
House heating fuel used in apartments - Utility gas (%)
House heating fuel used in apartments - Bottled, tank, or LP gas (%)
House heating fuel used in apartments - Electricity (%)
House heating fuel used in apartments - Fuel oil, kerosene, etc. (%)
House heating fuel used in apartments - Coal or coke (%)
House heating fuel used in apartments - Wood (%)
House heating fuel used in apartments - Solar energy (%)
House heating fuel used in apartments - Other fuel (%)
House heating fuel used in apartments - No fuel used (%)
Armed forces status - In Armed Forces (%)
Armed forces status - Civilian (%)
Armed forces status - Civilian - Veteran (%)
Armed forces status - Civilian - Nonveteran (%)
Fatal accidents locations in years 2005-2021
Fatal accidents locations in 2005
Fatal accidents locations in 2006
Fatal accidents locations in 2007
Fatal accidents locations in 2008
Fatal accidents locations in 2009
Fatal accidents locations in 2010
Fatal accidents locations in 2011
Fatal accidents locations in 2012
Fatal accidents locations in 2013
Fatal accidents locations in 2014
Fatal accidents locations in 2015
Fatal accidents locations in 2016
Fatal accidents locations in 2017
Fatal accidents locations in 2018
Fatal accidents locations in 2019
Fatal accidents locations in 2020
Fatal accidents locations in 2021
Alcohol use - People drinking some alcohol every month (%)
Alcohol use - People not drinking at all (%)
Alcohol use - Average days/month drinking alcohol
Alcohol use - Average drinks/week
Alcohol use - Average days/year people drink much
Audiometry - Average condition of hearing (%)
Audiometry - People that can hear a whisper from across a quiet room (%)
Audiometry - People that can hear normal voice from across a quiet room (%)
Audiometry - Ears ringing, roaring, buzzing (%)
Audiometry - Had a job exposure to loud noise (%)
Audiometry - Had off-work exposure to loud noise (%)
Blood Pressure & Cholesterol - Has high blood pressure (%)
Blood Pressure & Cholesterol - Checking blood pressure at home (%)
Blood Pressure & Cholesterol - Frequently checking blood cholesterol (%)
Blood Pressure & Cholesterol - Has high cholesterol level (%)
Consumer Behavior - Money monthly spent on food at supermarket/grocery store
Consumer Behavior - Money monthly spent on food at other stores
Consumer Behavior - Money monthly spent on eating out
Consumer Behavior - Money monthly spent on carryout/delivered foods
Consumer Behavior - Income spent on food at supermarket/grocery store (%)
Consumer Behavior - Income spent on food at other stores (%)
Consumer Behavior - Income spent on eating out (%)
Consumer Behavior - Income spent on carryout/delivered foods (%)
Current Health Status - General health condition (%)
Current Health Status - Blood donors (%)
Current Health Status - Has blood ever tested for HIV virus (%)
Current Health Status - Left-handed people (%)
Dermatology - People using sunscreen (%)
Diabetes - Diabetics (%)
Diabetes - Had a blood test for high blood sugar (%)
Diabetes - People taking insulin (%)
Diet Behavior & Nutrition - Diet health (%)
Diet Behavior & Nutrition - Milk product consumption (# of products/month)
Diet Behavior & Nutrition - Meals not home prepared (#/week)
Diet Behavior & Nutrition - Meals from fast food or pizza place (#/week)
Diet Behavior & Nutrition - Ready-to-eat foods (#/month)
Diet Behavior & Nutrition - Frozen meals/pizza (#/month)
Drug Use - People that ever used marijuana or hashish (%)
Drug Use - Ever used hard drugs (%)
Drug Use - Ever used any form of cocaine (%)
Drug Use - Ever used heroin (%)
Drug Use - Ever used methamphetamine (%)
Health Insurance - People covered by health insurance (%)
Kidney Conditions-Urology - Avg. # of times urinating at night
Medical Conditions - People with asthma (%)
Medical Conditions - People with anemia (%)
Medical Conditions - People with psoriasis (%)
Medical Conditions - People with overweight (%)
Medical Conditions - Elderly people having difficulties in thinking or remembering (%)
Medical Conditions - People who ever received blood transfusion (%)
Medical Conditions - People having trouble seeing even with glass/contacts (%)
Medical Conditions - People with arthritis (%)
Medical Conditions - People with gout (%)
Medical Conditions - People with congestive heart failure (%)
Medical Conditions - People with coronary heart disease (%)
Medical Conditions - People with angina pectoris (%)
Medical Conditions - People who ever had heart attack (%)
Medical Conditions - People who ever had stroke (%)
Medical Conditions - People with emphysema (%)
Medical Conditions - People with thyroid problem (%)
Medical Conditions - People with chronic bronchitis (%)
Medical Conditions - People with any liver condition (%)
Medical Conditions - People who ever had cancer or malignancy (%)
Mental Health - People who have little interest in doing things (%)
Mental Health - People feeling down, depressed, or hopeless (%)
Mental Health - People who have trouble sleeping or sleeping too much (%)
Mental Health - People feeling tired or having little energy (%)
Mental Health - People with poor appetite or overeating (%)
Mental Health - People feeling bad about themself (%)
Mental Health - People who have trouble concentrating on things (%)
Mental Health - People moving or speaking slowly or too fast (%)
Mental Health - People having thoughts they would be better off dead (%)
Oral Health - Average years since last visit a dentist
Oral Health - People embarrassed because of mouth (%)
Oral Health - People with gum disease (%)
Oral Health - General health of teeth and gums (%)
Oral Health - Average days a week using dental floss/device
Oral Health - Average days a week using mouthwash for dental problem
Oral Health - Average number of teeth
Pesticide Use - Households using pesticides to control insects (%)
Pesticide Use - Households using pesticides to kill weeds (%)
Physical Activity - People doing vigorous-intensity work activities (%)
Physical Activity - People doing moderate-intensity work activities (%)
Physical Activity - People walking or bicycling (%)
Physical Activity - People doing vigorous-intensity recreational activities (%)
Physical Activity - People doing moderate-intensity recreational activities (%)
Physical Activity - Average hours a day doing sedentary activities
Physical Activity - Average hours a day watching TV or videos
Physical Activity - Average hours a day using computer
Physical Functioning - People having limitations keeping them from working (%)
Physical Functioning - People limited in amount of work they can do (%)
Physical Functioning - People that need special equipment to walk (%)
Physical Functioning - People experiencing confusion/memory problems (%)
Physical Functioning - People requiring special healthcare equipment (%)
Prescription Medications - Average number of prescription medicines taking
Preventive Aspirin Use - Adults 40+ taking low-dose aspirin (%)
Reproductive Health - Vaginal deliveries (%)
Reproductive Health - Cesarean deliveries (%)
Reproductive Health - Deliveries resulted in a live birth (%)
Reproductive Health - Pregnancies resulted in a delivery (%)
Reproductive Health - Women breastfeeding newborns (%)
Reproductive Health - Women that had a hysterectomy (%)
Reproductive Health - Women that had both ovaries removed (%)
Reproductive Health - Women that have ever taken birth control pills (%)
Reproductive Health - Women taking birth control pills (%)
Reproductive Health - Women that have ever used Depo-Provera or injectables (%)
Reproductive Health - Women that have ever used female hormones (%)
Sexual Behavior - People 18+ that ever had sex (vaginal, anal, or oral) (%)
Sexual Behavior - Males 18+ that ever had vaginal sex with a woman (%)
Sexual Behavior - Males 18+ that ever performed oral sex on a woman (%)
Sexual Behavior - Males 18+ that ever had anal sex with a woman (%)
Sexual Behavior - Males 18+ that ever had any sex with a man (%)
Sexual Behavior - Females 18+ that ever had vaginal sex with a man (%)
Sexual Behavior - Females 18+ that ever performed oral sex on a man (%)
Sexual Behavior - Females 18+ that ever had anal sex with a man (%)
Sexual Behavior - Females 18+ that ever had any kind of sex with a woman (%)
Sexual Behavior - Average age people first had sex
Sexual Behavior - Average number of female sex partners in lifetime (males 18+)
Sexual Behavior - Average number of female vaginal sex partners in lifetime (males 18+)
Sexual Behavior - Average age people first performed oral sex on a woman (18+)
Sexual Behavior - Average number of woman performed oral sex on in lifetime (18+)
Sexual Behavior - Average number of male sex partners in lifetime (males 18+)
Sexual Behavior - Average number of male anal sex partners in lifetime (males 18+)
Sexual Behavior - Average age people first performed oral sex on a man (18+)
Sexual Behavior - Average number of male oral sex partners in lifetime (18+)
Sexual Behavior - People using protection when performing oral sex (%)
Sexual Behavior - Average number of times people have vaginal or anal sex a year
Sexual Behavior - People having sex without condom (%)
Sexual Behavior - Average number of male sex partners in lifetime (females 18+)
Sexual Behavior - Average number of male vaginal sex partners in lifetime (females 18+)
Sexual Behavior - Average number of female sex partners in lifetime (females 18+)
Sexual Behavior - Circumcised males 18+ (%)
Sleep Disorders - Average hours sleeping at night
Sleep Disorders - People that has trouble sleeping (%)
Smoking-Cigarette Use - People smoking cigarettes (%)
Taste & Smell - People 40+ having problems with smell (%)
Taste & Smell - People 40+ having problems with taste (%)
Taste & Smell - People 40+ that ever had wisdom teeth removed (%)
Taste & Smell - People 40+ that ever had tonsils teeth removed (%)
Taste & Smell - People 40+ that ever had a loss of consciousness because of a head injury (%)
Taste & Smell - People 40+ that ever had a broken nose or other serious injury to face or skull (%)
Taste & Smell - People 40+ that ever had two or more sinus infections (%)
Weight - Average height (inches)
Weight - Average weight (pounds)
Weight - Average BMI
Weight - People that are obese (%)
Weight - People that ever were obese (%)
Weight - People trying to lose weight (%)
132,071 62.3% Hispanic 29,496 13.9% White alone 25,805 12.2% Black alone 14,986 7.1% Asian alone 5,273 2.5% Two or more races 3,149 1.5% Native Hawaiian and Other 1,135 0.5% Other race alone
The City-Data.com crime index weighs serious crimes and violent crimes more heavily. Higher means more crime, U.S. average is 246.1. It adjusts for the number of visitors and daily workers commuting into cities.
- means the value is smaller than the state average.
- means the value is about the same as the state average.
- means the value is bigger than the state average.
- means the value is much bigger than the state average.
Crime rate in Moreno Valley detailed stats: murders, rapes, robberies, assaults, burglaries, thefts, arson Officers per 1,000 residents here:
0.00California average:
1.98
Latest news from Moreno Valley, CA collected exclusively by city-data.com from local newspapers, TV, and radio stations
Ancestries: American (1.4%), Nigerian (1.1%).
Current Local Time:
Land area: 51.2 square miles.
Population density: 4,137 people per square mile (average).
53,903 residents are foreign born (19.4% Latin America , 3.8% Asia ).
This city:
25.3%California:
26.5%
Median real estate property taxes paid for housing units with mortgages in 2022: $3,017 (0.6%)Median real estate property taxes paid for housing units with no mortgage in 2022: $2,866 (0.6%)
Nearest city with pop. 200,000+: Riverside, CA
Nearest city with pop. 1,000,000+: Los Angeles, CA
Nearest cities:
Latitude: 33.93 N, Longitude: 117.23 W
Daytime population change due to commuting: -40,973 (-19.3%)Workers who live and work in this city: 25,532 (25.4%)
Area code commonly used in this area: 909
Single-family new house construction building permits:
2022: 198 buildings , average cost: $280,3002021: 377 buildings , average cost: $263,3002020: 186 buildings , average cost: $231,8002019: 315 buildings , average cost: $253,9002018: 854 buildings , average cost: $302,1002017: 451 buildings , average cost: $331,4002016: 100 buildings , average cost: $378,6002015: 132 buildings , average cost: $330,6002014: 46 buildings , average cost: $275,7002013: 133 buildings , average cost: $326,0002012: 12 buildings , average cost: $168,4002011: 23 buildings , average cost: $287,2002010: 91 buildings , average cost: $304,0002009: 114 buildings , average cost: $264,7002008: 132 buildings , average cost: $225,5002007: 392 buildings , average cost: $236,1002006: 933 buildings , average cost: $223,4002005: 1086 buildings , average cost: $213,9002004: 2108 buildings , average cost: $195,5002003: 1987 buildings , average cost: $189,2002002: 1136 buildings , average cost: $152,1002001: 602 buildings , average cost: $153,5002000: 323 buildings , average cost: $165,6001999: 259 buildings , average cost: $163,3001998: 244 buildings , average cost: $127,1001997: 234 buildings , average cost: $144,400Unemployment in December 2023: Population change in the 1990s: +21,218 (+17.5%).
Most common occupations in Moreno Valley, CA (%)
Both Males Females
Laborers and material movers, hand (5.0%)
Cooks and food preparation workers (4.5%)
Material recording, scheduling, dispatching, and distributing workers (4.5%)
Building and grounds cleaning and maintenance occupations (4.4%)
Driver/sales workers and truck drivers (4.1%)
Retail sales workers, except cashiers (3.8%)
Other management occupations, except farmers and farm managers (3.7%)
Driver/sales workers and truck drivers (7.8%)
Laborers and material movers, hand (6.8%)
Building and grounds cleaning and maintenance occupations (5.9%)
Material recording, scheduling, dispatching, and distributing workers (5.0%)
Construction laborers (4.2%)
Other management occupations, except farmers and farm managers (4.1%)
Electrical equipment mechanics and other installation, maintenance, and repair workers, including supervisors (4.0%)
Cooks and food preparation workers (6.0%)
Supervisors and other personal care and service workers, except child care workers (5.0%)
Retail sales workers, except cashiers (4.6%)
Other office and administrative support workers, including supervisors (4.3%)
Cashiers (4.1%)
Information and record clerks, except customer service representatives (4.0%)
Secretaries and administrative assistants (4.0%)
Earthquake activity:
Moreno Valley-area historical earthquake activity is significantly above California state average. It is 7227% greater than the overall U.S. average. On 6/28/1992 at 11:57:34, a magnitude 7.6 (6.2 MB, 7.6 MS, 7.3 MW, Depth: 0.7 mi, Class: Major, Intensity: VIII - XII) earthquake occurred 43.7 miles away from the city center, causing 3 deaths ( 1 shaking deaths, 2 other deaths) and 400 injuries, causing $100,000,000 total damage and $40,000,000 insured lossesOn 7/21/1952 at 11:52:14, a magnitude 7.7 (7.7 UK) earthquake occurred 125.4 miles away from Moreno Valley center, causing $50,000,000 total damage On 10/16/1999 at 09:46:44, a magnitude 7.4 (6.3 MB, 7.4 MS, 7.2 MW, 7.3 ML) earthquake occurred 61.0 miles away from Moreno Valley center On 5/19/1940 at 04:36:40, a magnitude 7.2 (7.2 UK) earthquake occurred 100.8 miles away from the city center, causing $33,000,000 total damage On 6/28/1992 at 15:05:30, a magnitude 6.9 (6.3 MB, 6.7 MS, 6.5 MW, 6.9 ME, Depth: 3.1 mi, Class: Strong, Intensity: VII - IX) earthquake occurred 34.4 miles away from the city center On 4/21/1918 at 22:32:30, a magnitude 6.8 (6.8 UK) earthquake occurred 14.5 miles away from Moreno Valley center Magnitude types: body-wave magnitude (MB), energy magnitude (ME), local magnitude (ML), surface-wave magnitude (MS), moment magnitude (MW) Natural disasters: The number of natural disasters in Riverside County (46) is a lot greater than the US average (15).Major Disasters (Presidential) Declared: 27Emergencies Declared: 1Fires: 22, Floods: 20, Storms: 8, Winter Storms: 8, Landslides: 6, Mudslides: 5, Heavy Rains: 2, Earthquake: 1, Flash Flood: 1, Freeze: 1, Hurricane: 1, Tornado: 1, Tropical Storm: 1, Other: 1 (Note: some incidents may be assigned to more than one category). Hospitals in Moreno Valley: DAVIS HOUSE (11751 DAVIS STREET) HEIL HOUSE (24888 HEIL DRIVE) KAISER FOUNDATION HOSPITAL-MORENO VALLEY (Government - Hospital District or Authority, provides emergency services, 27300 IRIS AVENUE) LINDLEY LANE HOUSE (11315 LINDLEY LANE) MAGGIE MARSH HOUSE (10467 MORNING RIDGE DRIVE) MORENO VALLEY AMBULATORY SURGERY CTR (24384 SUNNYMEAD BLVD) RIVERSIDE COUNTY REGIONAL MEDICAL CENTER (Government - Local, 26520 CACTUS AVENUE) SHEILA MARIE HOUSE (25654 SIERRA LEONE COURT) Dialysis Facilities in Moreno Valley: DAVITA-CANYON SPRINGS DIALYSIS (22555 ALESSANDRO BLVD., SUITE A) DAVITA-VALLEY VIEW DIALYSIS (26900 CACTUS AVENUE) MORENO VALLEY REGIONAL DIALYSIS CENTER, LLC (22620 GOLDENCREST DRIVE, SUITE 101-103) Home Health Centers in Moreno Valley: BETHANY HOME CARE (PARENT) (11481 HEACOCK STREET, SUITE 130) DESTINY HOME HEALTH AGENCY, INC (12370 PERRIS BLVD) VICTORY HOME HEALTH AGENCY (24490 SUNNYMEAD BOULEVARD, SUITE 108) Heliports located in Moreno Valley: Amtrak station: MORENO VALLEY (ARCO MINI MART, 2624 E. ALESSANDRO BLVD.) - Bus Station
.
Services: public payphones.
Colleges/Universities in Moreno Valley: Moreno Valley College Full-time enrollment: 4,650; Location: 16130 Lasselle St; Public; Website: www.mvc.edu/)
Marinello Schools of Beauty-Moreno Valley Full-time enrollment: 473; Location: 24741 Alessandro Blvd; Private, for-profit; Website: www.marinello.com)
Sage College Full-time enrollment: 303; Location: 12125 Day Street, Bldg. L; Private, for-profit; Website: sagecollege.edu)
Other colleges/universities with over 2000 students near Moreno Valley:
University of California-Riverside (about 7 miles; Riverside, CA ; Full-time enrollment: 20,647)
Loma Linda University (about 9 miles; Loma Linda, CA ; FT enrollment: 2,839)
Riverside City College (about 10 miles; Riverside, CA ; FT enrollment: 10,661)
University of Redlands (about 11 miles; Redlands, CA ; FT enrollment: 4,854)
The Art Institute of California-Argosy University Inland Empire (about 11 miles; San Bernardino, CA ; FT enrollment: 2,238)
Crafton Hills College (about 11 miles; Yucaipa, CA ; FT enrollment: 3,222)
California Baptist University (about 12 miles; Riverside, CA ; FT enrollment: 6,085)
Biggest public high schools in Moreno Valley: RANCHO VERDE HIGH Students: 2,168, Location: 17750 LASSELLE ST., Grades: 9-12)VALLEY VIEW HIGH Students: 1,932, Location: 13135 NASON ST., Grades: 9-12)CANYON SPRINGS HIGH Students: 1,759, Location: 23100 COUGAR CANYON DR., Grades: 9-12)VISTA DEL LAGO HIGH Students: 1,731, Location: 15150 LASSELLE ST., Grades: 9-12)MARCH MOUNTAIN HIGH Students: 149, Location: 24551 DRACAEA AVE., Grades: 7-12)MARCH VALLEY Students: 65, Location: 24551 DRACAEA AVE., Grades: 9-12)ALESSANDRO Students: 37, Location: 23311 DRACAEA AVE., Grades: KG-12)BAYSIDE COMMUNITY DAY Students: 29, Location: 24975 BAY AVE., Grades: 9-12)MORENO VALLEY COMMUNITY LEARNING CENTER Students: 25, Location: 13911 PERRIS BLVD., Grades: 7-12, Charter school )MORENO VALLEY ONLINE ACADEMY Location: 24551 DRACAEA AVE., Grades: KG-12)Private high schools in Moreno Valley: CALVARY CHAPEL CHRISTIAN SCHOOL Students: 268, Location: 11960 PETTIT ST, Grades: KG-12)
COUNTRY DAY SCHOOL Students: 25, Location: 11001 OLD PERRIS BLVD, Grades: 1-12)
Biggest public elementary/middle schools in Moreno Valley: SUNNYMEAD MIDDLE Students: 1,400, Location: 23996 EUCALYPTUS AVE., Grades: 6-8)VISTA HEIGHTS MIDDLE Students: 1,327, Location: 23049 OLD LAKE DR., Grades: 6-8)LANDMARK MIDDLE Students: 1,246, Location: 15261 LEGENDARY DR., Grades: 6-8)PALM MIDDLE Students: 1,181, Location: 11900 SLAWSON AVE., Grades: 6-8)BADGER SPRINGS MIDDLE Students: 1,166, Location: 24750 DELPHINIUM AVE., Grades: 6-8)MOUNTAIN VIEW MIDDLE Students: 1,163, Location: 13130 MORRISON ST., Grades: 6-8)VISTA VERDE MIDDLE Students: 938, Location: 25777 KRAMERIA ST., Grades: 6-8)MARCH MIDDLE Students: 796, Location: 15800 INDIAN AVE., Grades: 6-8)CLOVERDALE ELEMENTARY Students: 498, Location: 12050 KITCHING ST., Grades: KG-5)BEAR VALLEY ELEMENTARY Students: 481, Location: 26125 FIR AVE., Grades: KG-5)Private elementary/middle schools in Moreno Valley: VALLEY CHRISTIAN ACADEMY Students: 151, Location: 26755 ALESSANDRO BLVD, Grades: PK-8)
MORENO VALLEY CHRISTIAN SCHOOL Students: 82, Location: 25560 ALESSANDRO BLVD, Grades: KG-8)BIG SPRINGS CENTER & SCHOOL Students: 14, Location: 11650 PERRIS BLVD, Grades: 2-6)
See full list of schools located in Moreno Valley Library in Moreno Valley: MORENO VALLEY PUBLIC LIBRARY Operating income: $2,275,770; Location: 25480 ALESSANDRO BLVD; 124,271 books ; 2 e-books ; 3,518 audio materials ; 5,114 video materials ; 8 local licensed databases ; 34 other licensed databases ; 107 print serial subscriptions ; 16 electronic serial subscriptions )
Notable locations in Moreno Valley: (A) , Riverside International Raceway (B) , Moreno Valley Golf Course (C) , Moreno Valley Ranch Golf Club (D) , American Medical Response Unit 391 (E) , American Medical Response Unit 348 (F) , American Medical Response Cactus (G) , American Medical Response Moreno Valley (H) , Sunnymead Community Center (I) , Sunnymead Chamber of Commerce (J) , Riverside County Fire Department Station 91 College Park (K) , Riverside County Fire Department Station 65 Kennedy Park (L) , Riverside County Fire Department Station 48 Sunnymead Ranch (M) , Riverside County Fire Department Station 6 Towngate (N) , Riverside County Fire Department Station 2 Sunnymead (O) , Riverside County Fire Department Station 58 - Moreno Beach (P) , Moreno Valley Branch Riverside City and County Public Library (Q) . Display/hide their locations on the map
Shopping Centers: (1) , Plaza del Sol Shopping Center (2) , Moreno Valley Mall at Towngate Shopping Center (3) , Canyon Springs Plaza Shopping Center (4) , The Festival at Moreno Valley Shopping Center (5) , Sunnymead Plaza Shopping Center (6) , North Ridge Shopping Center (7) , Lakeshore Village Shopping Center (8) , Woodboro Avenue Shopping Center (9) . Display/hide their locations on the map
Churches in Moreno Valley include: (A) , Highland Baptist Church (B) , Lord of Life Lutheran Church (C) , Saint Christophers Catholic Church (D) , First Baptist Church (E) , Foothill Baptist Church of Moreno Valley (F) , Islamic Development Center (G) , Moreno Valley Church of Christ (H) , Moreno Valley Congregational Church (I) . Display/hide their locations on the map
Reservoir: (A) . Display/hide its location on the map
Parks in Moreno Valley include: (1) , Morrison Park (2) , Pedrorena Park (3) , Victoriano Park (4) , Woodland Park (5) , Gateway Park (6) , Sunnymead Park (7) , Hidden Springs Community Park (8) , Moreno Valley Community Park (9) . Display/hide their locations on the map
Hotels: (1) , Best Western Image Inn & Suites (24840 Elder Avenue) (2) . Display/hide their approximate locations on the map
Birthplace of: Kyle Turley - 2005 NFL player (St. Louis Rams, born : Sep 24, 1975), Andre McGee - College basketball player (Louisville Cardinals), Antoine McGee - College basketball player (Colorado Buffaloes), J.S. Nash - College basketball player (Oregon State Beavers), Jason Braxton - College basketball player (Arizona State Sun Devils), Marcel Jones - College basketball player (Oregon State Beavers), Othaniel Yanez - Soccer player, Randy Adams - College basketball player (Sacramento State Hornets), Solomon Bates - Football player.
Riverside County has a predicted average indoor radon screening level between 2 and 4 pCi/L (pico curies per liter) - Moderate Potential Drinking water stations with addresses in Moreno Valley and their reported violations in the past:
BOX SPRINGS MUTUAL WC (Population served: 3,000, Purch surface water):
Past monitoring violations:
Monitoring and Reporting (DBP) - Between JUL-2012 and SEP-2012, Contaminant: TTHM. Follow-up actions: St Compliance achieved (OCT-22-2012), St Formal NOV issued (NOV-20-2012)
Monitoring and Reporting (DBP) - Between JUL-2012 and SEP-2012, Contaminant: Total Haloacetic Acids (HAA5). Follow-up actions: St Compliance achieved (OCT-22-2012), St Formal NOV issued (NOV-20-2012)
4 minor monitoring violations
Drinking water stations with addresses in Moreno Valley that have no violations reported:
VICTORY RANCH (Population served: 75, Primary Water Source Type: Groundwater)
Average household size: This city:
3.7 peopleCalifornia:
2.9 people
Percentage of family households: This city:
83.7%Whole state:
68.7%
Percentage of households with unmarried partners: This city:
7.8%Whole state:
7.2%
Likely homosexual households (counted as self-reported same-sex unmarried-partner households)
Lesbian couples: 0.5% of all households Gay men: 0.3% of all households
People in group quarters in Moreno Valley in 2010:
349 people in group homes intended for adults
52 people in workers' group living quarters and job corps centers
38 people in residential treatment centers for adults
32 people in group homes for juveniles (non-correctional)
32 people in other noninstitutional facilities
27 people in nursing facilities/skilled-nursing facilities
18 people in correctional residential facilities
6 people in residential treatment centers for juveniles (non-correctional)
People in group quarters in Moreno Valley in 2000:
326 people in other group homes
230 people in homes for the mentally retarded
106 people in other noninstitutional group quarters
14 people in homes or halfway houses for drug/alcohol abuse
12 people in homes for the physically handicapped
6 people in unknown juvenile institutions
3 people in religious group quarters
Banks with branches in Moreno Valley (2011 data):
JPMorgan Chase Bank, National Association: Moreno Valley Beach State Bros. Bank, Moreno Valley Ranch, Moreno Valley Branch, Stoneridge Towne Center Banking Cent. Info updated 2011/11/10: Bank assets: $1,811,678.0 mil, Deposits: $1,190,738.0 mil, headquarters in Columbus, OH, positive income , International Specialization, 5577 total offices , Holding Company: Jpmorgan Chase & Co.
Bank of America, National Association: Moreno Valley Branch, South Moreno Valley Branch, Towngate Plaza Branch. Info updated 2009/11/18: Bank assets: $1,451,969.3 mil, Deposits: $1,077,176.8 mil, headquarters in Charlotte, NC, positive income , 5782 total offices , Holding Company: Bank Of America Corporation
U.S. Bank National Association: Moreno Valley Stater Bros Branch at 25900 Iris Avenue, branch established on 2010/11/29; Moreno Valley Branch at 27020 Fir Ave, branch established on 2007/10/01. Info updated 2012/01/30: Bank assets: $330,470.8 mil, Deposits: $236,091.5 mil, headquarters in Cincinnati, OH, positive income , 3121 total offices , Holding Company: U.S. Bancorp
Wells Fargo Bank, National Association: Moreno Marketplace Branch at 14395 Moreno Beach Drive, branch established on 2008/11/10; Towngate Branch at 12625 Frederick Street, Ste U, branch established on 1989/06/30. Info updated 2011/04/05: Bank assets: $1,161,490.0 mil, Deposits: $905,653.0 mil, headquarters in Sioux Falls, SD, positive income , 6395 total offices , Holding Company: Wells Fargo & Company
Provident Savings Bank, F.S.B.: Moreno Valley Branch at 16110 Perris Blvd Ste K, branch established on 2008/09/18; 12460 Heacock St Branch at 12460 Heacock St, branch established on 1956/07/02. Info updated 2011/07/21: Bank assets: $1,298.6 mil, Deposits: $963.9 mil, headquarters in Riverside, CA, positive income , Commercial Lending Specialization, 14 total offices
California Bank & Trust: Moreno Valley Branch at 12625 Frederick Street, Spc V-1, branch established on 1982/12/06. Info updated 2009/07/20: Bank assets: $10,894.1 mil, Deposits: $9,193.9 mil, headquarters in San Diego, CA, positive income , Commercial Lending Specialization, 109 total offices , Holding Company: Zions Bancorporation
Compass Bank: Moreno Branch at 24010 Sunnymead Boulevard, branch established on 2009/09/11. Info updated 2011/02/24: Bank assets: $63,107.0 mil, Deposits: $46,232.4 mil, headquarters in Birmingham, AL, negative income in the last year , Commercial Lending Specialization, 720 total offices , Holding Company: Banco Bilbao Vizcaya Argentaria, S.A.
For population 15 years and over in Moreno Valley:
Never married: 43.5%Now married: 44.2%Separated: 2.1%Widowed: 3.8%Divorced: 6.4% For population 25 years and over in Moreno Valley:
High school or higher: 80.8%Bachelor's degree or higher: 17.3%Graduate or professional degree: 5.6%Unemployed: 8.5%Mean travel time to work (commute): 32.3 minutes
Education Gini index (Inequality in education) Here:
13.9California average:
15.5
Religion statistics for Moreno Valley, CA (based on Riverside County data)
Religion Adherents Congregations Catholic 602,765 51 Evangelical Protestant 240,306 741 Other 77,581 194 Mainline Protestant 29,535 103 Black Protestant 19,170 40 Orthodox 3,647 11 None 1,216,637 -
Source: Clifford Grammich, Kirk Hadaway, Richard Houseal, Dale E.Jones, Alexei Krindatch, Richie Stanley and Richard H.Taylor. 2012. 2010 U.S.Religion Census: Religious Congregations & Membership Study. Association of Statisticians of American Religious Bodies. Jones, Dale E., et al. 2002. Congregations and Membership in the United States 2000. Nashville, TN: Glenmary Research Center. Graphs represent county-level data
Food Environment Statistics: Number of grocery stores : 330Here :
1.60 / 10,000 pop.California :
2.14 / 10,000 pop.
Number of supercenters and club stores : 11Riverside County :
0.05 / 10,000 pop.California :
0.04 / 10,000 pop.
Number of convenience stores (no gas) : 91Riverside County :
0.44 / 10,000 pop.State :
0.62 / 10,000 pop.
Number of convenience stores (with gas) : 311Here :
1.51 / 10,000 pop.California :
1.49 / 10,000 pop.
Number of full-service restaurants : 1,125Riverside County :
5.45 / 10,000 pop.California :
7.42 / 10,000 pop.
Adult diabetes rate : Riverside County :
7.7%State :
7.3%
Adult obesity rate : Riverside County :
24.5%California :
21.3%
Low-income preschool obesity rate : Riverside County :
15.2%California :
17.9%
Health and Nutrition: Healthy diet rate : This city:
47.1%California:
49.4%
Average overall health of teeth and gums : This city:
45.8%California:
48.0%
Average BMI : This city:
28.7California:
28.1
People feeling badly about themselves : Moreno Valley:
21.7%California:
20.2%
People not drinking alcohol at all : Moreno Valley:
11.5%California:
11.2%
Average hours sleeping at night : This city:
6.7California:
6.8
Overweight people : Moreno Valley:
32.5%State:
31.5%
General health condition : Moreno Valley:
54.7%California:
56.4%
Average condition of hearing : This city:
81.9%California:
80.9%
More about Health and Nutrition of Moreno Valley, CA Residents
Local government employment and payroll (March 2022)
Function
Full-time employees
Monthly full-time payroll
Average yearly full-time wage
Part-time employees
Monthly part-time payroll
Parks and Recreation
103 $514,316 $59,920 64 $117,410 Streets and Highways
52 $371,672 $85,770 7 $14,648 Financial Administration
50 $520,349 $124,884 7 $19,592 Other and Unallocable
27 $137,813 $61,250 1 $3,445 Other Government Administration
18 $159,990 $106,660 4 $13,859 Health
17 $81,182 $57,305 5 $10,099 Local Libraries
11 $62,910 $68,629 12 $20,786 Electric Power
10 $116,440 $139,728 0 $0 Housing and Community Development (Local)
7 $55,723 $95,525 17 $36,119 Fire - Other
6 $28,688 $57,376 0 $0 Police - Other
5 $23,238 $55,771 46 $65,045 Sewerage
5 $49,128 $117,907 0 $0 Natural Resources
4 $19,393 $58,179 0 $0 Solid Waste Management
4 $27,862 $83,586 4 $3,408 Welfare
2 $9,889 $59,334 4 $8,089 Judicial and Legal
1 $8,621 $103,452 0 $0
Totals for Government
322 $2,187,216 $81,511 171 $312,500
Moreno Valley government finances - Expenditure in 2021 (per resident):
Construction - Regular Highways: $15,255,000 ($71.98)
Housing and Community Development: $10,383,000 ($48.99)Parks and Recreation: $6,148,000 ($29.01)Health - Other: $3,105,000 ($14.65)Electric Utilities: $2,773,000 ($13.08)Police Protection: $1,902,000 ($8.97)General - Other: $1,337,000 ($6.31)Libraries: $550,000 ($2.60)Current Operations - Judicial and Legal Services: $48,518,000 ($228.94)
Police Protection: $45,411,000 ($214.28)Regular Highways: $23,281,000 ($109.86)Electric Utilities: $22,518,000 ($106.26)Central Staff Services: $19,506,000 ($92.04)Local Fire Protection: $19,366,000 ($91.38)General - Other: $16,795,000 ($79.25)Financial Administration: $14,407,000 ($67.98)Parks and Recreation: $12,286,000 ($57.97)Housing and Community Development: $8,183,000 ($38.61)Health - Other: $2,862,000 ($13.50)Protective Inspection and Regulation - Other: $1,310,000 ($6.18)Libraries: $15,000 ($0.07)Electric Utilities - Interest on Debt: $2,464,000 ($11.63)
General - Interest on Debt: $3,002,000 ($14.17)
Other Capital Outlay - Local Fire Protection: $1,310,000 ($6.18)
General - Other: $678,000 ($3.20)Police Protection: $152,000 ($0.72)
Moreno Valley government finances - Revenue in 2021 (per resident):
Charges - Other: $9,788,000 ($46.19)
Housing and Community Development: $1,802,000 ($8.50)Parks and Recreation: $1,366,000 ($6.45)Solid Waste Management: $39,000 ($0.18)Federal Intergovernmental - Other: $10,912,000 ($51.49)
Housing and Community Development: $1,886,000 ($8.90)Miscellaneous - General Revenue - Other: $31,919,000 ($150.62)
Special Assessments: $11,457,000 ($54.06)Interest Earnings: $2,417,000 ($11.41)Donations From Private Sources: $2,108,000 ($9.95)Fines and Forfeits: $751,000 ($3.54)Rents: $574,000 ($2.71)Revenue - Electric Utilities: $39,774,000 ($187.68)
State Intergovernmental - Other: $18,272,000 ($86.22)
Highways: $8,427,000 ($39.76)Electric Utilities: $3,831,000 ($18.08)General Local Government Support: $157,000 ($0.74)Tax - Property: $48,252,000 ($227.69)
General Sales and Gross Receipts: $31,232,000 ($147.37)Public Utilities Sales: $23,538,000 ($111.07)Other: $19,628,000 ($92.62)Occupation and Business License - Other: $4,363,000 ($20.59)Other License: $3,897,000 ($18.39)Other Selective Sales: $3,639,000 ($17.17)Documentary and Stock Transfer: $739,000 ($3.49)
Moreno Valley government finances - Debt in 2021 (per resident):
Long Term Debt - Beginning Outstanding - Unspecified Public Purpose: $121,238,000 ($572.08)
Outstanding Unspecified Public Purpose: $112,493,000 ($530.82)Retired Unspecified Public Purpose: $11,934,000 ($56.31)Issue, Unspecified Public Purpose: $3,188,000 ($15.04)
Moreno Valley government finances - Cash and Securities in 2021 (per resident):
Bond Funds - Cash and Securities: $19,494,000 ($91.99)
Other Funds - Cash and Securities: $312,733,000 ($1475.68)
Sinking Funds - Cash and Securities: $8,642,000 ($40.78)
7.19% of this county's 2021 resident taxpayers lived in other counties in 2020 ($71,521 average adjusted gross income )
Here:
7.19%California average:
5.19%
0.03% of residents moved from foreign countries ($210 average AGI )Riverside County:
0.03%California average:
0.03%
Top counties from which taxpayers relocated into this county between 2020 and 2021:
6.28% of this county's 2020 resident taxpayers moved to other counties in 2021 ($64,593 average adjusted gross income )
Here:
6.28%California average:
6.14%
0.02% of residents moved to foreign countries ($200 average AGI )Riverside County:
0.02%California average:
0.02%
Top counties to which taxpayers relocated from this county between 2020 and 2021:
Businesses in Moreno Valley, CA
Name Count Name Count
24 Hour Fitness 1 JCPenney 1 7-Eleven 3 Jamba Juice 1 99 Cents Only Stores 2 Jones New York 1 AT&T 3 Journeys 1 Ace Hardware 1 Just Tires 1 Aeropostale 1 Justice 1 Albertsons 1 KFC 3 Applebee's 1 Kohl's 1 Arby's 2 Kroger 3 AutoZone 4 La Quinta 1 Baja Fresh Mexican Grill 1 Lane Furniture 2 Baskin-Robbins 1 LensCrafters 1 Bath & Body Works 1 Little Caesars Pizza 3 Best Western 1 Lowe's 1 Blockbuster 2 Macy's 1 Brunswick Bowling & Billiards 1 McDonald's 3 Buffalo Wild Wings 1 Motherhood Maternity 2 Burger King 1 New York & Co 1 Burlington Coat Factory 1 Nike 17 CVS 4 Office Depot 1 Carl\s Jr. 5 OfficeMax 1 Catherines 1 Olive Garden 1 Charlotte Russe 1 Outback 1 Chevrolet 1 Outback Steakhouse 1 Chuck E. Cheese's 1 Pac Sun 1 Church's Chicken 1 Panda Express 3 Cinnabon 1 Papa John's Pizza 1 Circle K 6 Payless 4 Cold Stone Creamery 2 Penske 1 Comfort Inn 1 Pizza Hut 3 Costco 1 Popeyes 1 Curves 1 Qdoba Mexican Grill 1 DHL 2 Quiznos 1 Dairy Queen 2 RadioShack 2 Dennys 1 Rite Aid 2 Discount Tire 1 Sears 2 Domino's Pizza 2 Skechers USA 1 DressBarn 1 Spencer Gifts 1 Dressbarn 1 Sprint Nextel 1 Econo Lodge 1 Starbucks 5 El Pollo Loco 1 Subway 2 Express 1 T-Mobile 7 Famous Footwear 1 Taco Bell 3 Fashion Bug 1 Target 1 FedEx 8 Torrid 1 Firestone Complete Auto Care 1 Toyota 1 Foot Locker 1 Toys"R"Us 1 Forever 21 1 U-Haul 3 GNC 2 UPS 9 GameStop 3 Vans 3 Goodwill 2 Verizon Wireless 2 H&R Block 6 Victoria's Secret 1 Holiday Inn 1 Volkswagen 1 Hollister Co. 1 Walgreens 3 Home Depot 2 Walmart 1 HomeTown Buffet 1 Wendy's 2 Honda 1 Wet Seal 1 IHOP 1
Strongest AM radio stations in Moreno Valley:
KHPY (1670 AM; 10 kW; MORENO VALLEY, CA; Owner: DELBERT L. VAN VOORHIS)
KPLS (830 AM; 50 kW; ORANGE, CA; Owner: CRN LICENSES, LLC)
KLAC (570 AM; 50 kW; LOS ANGELES, CA; Owner: AMFM RADIO LICENSES, L.L.C.)
KCAL (1410 AM; 5 kW; REDLANDS, CA; Owner: LAZER BROADCASTING CORPORATION)
KFI (640 AM; 50 kW; LOS ANGELES, CA; Owner: CAPSTAR TX LIMITED PARTNERSHIP)
KPRO (1570 AM; 5 kW; RIVERSIDE, CA; Owner: OLIVE L. SHERBAN)
KRLH (590 AM; 2 kW; SAN BERNARDINO, CA; Owner: CARON BROADCASTING, INC.)
KTNQ (1020 AM; 50 kW; LOS ANGELES, CA; Owner: KTNQ-AM LICENSE CORP.)
KTDD (1350 AM; 5 kW; SAN BERNARDINO, CA)
KXTA (1150 AM; 50 kW; LOS ANGELES, CA; Owner: CITICASTERS LICENSES, L.P.)
KDIS (1110 AM; 50 kW; PASADENA, CA; Owner: ABC,INC.)
KKDD (1290 AM; 5 kW; SAN BERNARDINO, CA; Owner: AMFM RADIO LICENSES, L.L.C.)
KFWB (980 AM; 50 kW; LOS ANGELES, CA; Owner: INFINITY BROADCASTING OPERATIONS, INC.)
Strongest FM radio stations in Moreno Valley:
KVCR (91.9 FM; SAN BERNARDINO, CA; Owner: SAN BERNARDINO COMMUNITY COLLEGE DISTRICT)
KOLA (99.9 FM; SAN BERNARDINO, CA; Owner: INLAND EMPIRE BROADCASTING CORP.)
KUCR (88.3 FM; RIVERSIDE, CA; Owner: THE REGENTS OF THE UNIV. OF CA)
KUOR-FM (89.1 FM; REDLANDS, CA; Owner: UNIVERSITY OF REDLANDS)
KLRD (90.1 FM; YUCAIPA, CA; Owner: EDUCATIONAL MEDIA FOUNDATION)
KCXX (103.9 FM; LAKE ARROWHEAD, CA; Owner: ALL-PRO BROADCASTING, INC.)
KWRP (96.1 FM; SAN JACINTO, CA; Owner: MAGIC BROADCASTING, INC.)
K201AR (88.1 FM; BANNING, CA; Owner: KSGN, INC.)
K232CX (94.3 FM; DESERT HOT SPRINGS, CA; Owner: MCC RADIO, LLC)
K295AI (106.9 FM; MUSCOY, CA; Owner: ASSOCIATION FOR COMMUNITY EDUCATION, INC.)
KPLM-FM2 (106.1 FM; SAN JACINTO, CA; Owner: RM BROADCASTING L.L.C.)
KRTM (88.9 FM; TEMECULA, CA; Owner: PENFOLD COMMUNICATIONS, INC.)
KGGI (99.1 FM; RIVERSIDE, CA; Owner: AMFM RADIO LICENSES, L.L.C.)
KLYY (97.5 FM; RIVERSIDE, CA; Owner: ENTRAVISION HOLDINGS, LLC)
K201CD (88.1 FM; VICTORVILLE, CA; Owner: SAN BERNARDINO COMMNTY COLLEGE DIST.)
KWVE (107.9 FM; SAN CLEMENTE, CA; Owner: CALVARY CHAPEL OF COSTA MESA)
K264AF (100.7 FM; GUASTI, CA; Owner: EDUCATIONAL MEDIA FOUNDATION)
KATY-FM (101.3 FM; IDYLLWILD, CA; Owner: ALL PRO BROADCASTING, INC.)
KCBS-FM (93.1 FM; LOS ANGELES, CA; Owner: INFINITY BROADCASTING OPERATIONS, INC.)
KAEH (100.9 FM; BEAUMONT, CA; Owner: MOON BROADCASTING RIVERSIDE, LLC)
TV broadcast stations around Moreno Valley:
KVCR-TV (Channel 24; SAN BERNARDINO, CA; Owner: SAN BERNARDINO COMMUNITY COLLEGE DISTRICT)
KTRO-LP (Channel 50; LANCASTER, CA; Owner: ROBERT D. ADELMAN)
KHIZ (Channel 64; BARSTOW, CA; Owner: SUNBELT TELEVISION, INC.)
KBLM-LP (Channel 25; RIVERSIDE/PERRIS, CA; Owner: LOUIS MARTINEZ FAMILY GROUP, LLC)
KSGA-LP (Channel 59; SANTA BARBARA, CA; Owner: KJLA, LLC)
Home Mortgage Disclosure Act Aggregated Statistics For Year 2009(Based on 29 full and 8 partial tracts) A) FHA, FSA/RHS & VA B) Conventional C) Refinancings D) Home Improvement Loans E) Loans on Dwellings For 5+ Families F) Non-occupant Loans on G) Loans On Manufactured Number Average Value Number Average Value Number Average Value Number Average Value Number Average Value Number Average Value Number Average Value
LOANS ORIGINATED 1,894 $160,406 840 $117,858 911 $173,412 43 $75,438 2 $21,339,950 451 $101,112 4 $146,355 APPLICATIONS APPROVED, NOT ACCEPTED 195 $153,924 145 $119,758 171 $182,408 16 $44,929 0 $0 72 $107,473 2 $62,570 APPLICATIONS DENIED 444 $159,864 269 $120,287 655 $184,314 70 $59,949 2 $443,500 177 $111,250 18 $66,037 APPLICATIONS WITHDRAWN 300 $178,522 179 $120,775 313 $190,562 20 $74,343 0 $0 101 $110,422 1 $150,000 FILES CLOSED FOR INCOMPLETENESS 87 $153,993 40 $128,134 106 $189,116 10 $161,635 0 $0 25 $121,522 0 $0
Aggregated Statistics For Year 2008(Based on 29 full and 8 partial tracts) A) FHA, FSA/RHS & VA B) Conventional C) Refinancings D) Home Improvement Loans E) Loans on Dwellings For 5+ Families F) Non-occupant Loans on G) Loans On Manufactured Number Average Value Number Average Value Number Average Value Number Average Value Number Average Value Number Average Value Number Average Value
LOANS ORIGINATED 1,522 $199,198 1,192 $161,275 889 $205,984 162 $75,202 5 $6,698,826 462 $143,965 15 $73,148 APPLICATIONS APPROVED, NOT ACCEPTED 162 $209,594 320 $193,619 370 $240,947 44 $78,474 0 $0 86 $170,799 16 $127,212 APPLICATIONS DENIED 371 $215,539 599 $193,452 1,706 $262,887 312 $93,356 4 $569,890 231 $180,419 31 $107,536 APPLICATIONS WITHDRAWN 250 $213,635 292 $184,298 498 $241,196 50 $128,654 2 $257,500 94 $157,013 4 $85,698 FILES CLOSED FOR INCOMPLETENESS 70 $220,507 95 $222,712 144 $255,514 19 $114,411 0 $0 28 $222,473 0 $0
Aggregated Statistics For Year 2007(Based on 29 full and 8 partial tracts) A) FHA, FSA/RHS & VA B) Conventional C) Refinancings D) Home Improvement Loans E) Loans on Dwellings For 5+ Families F) Non-occupant Loans on G) Loans On Manufactured Number Average Value Number Average Value Number Average Value Number Average Value Number Average Value Number Average Value Number Average Value
LOANS ORIGINATED 50 $273,640 1,738 $244,891 4,469 $254,188 664 $158,191 9 $13,933,430 521 $240,102 31 $120,251 APPLICATIONS APPROVED, NOT ACCEPTED 5 $282,390 667 $245,436 1,579 $269,092 185 $154,678 0 $0 160 $262,758 21 $83,145 APPLICATIONS DENIED 16 $280,438 1,542 $278,336 4,843 $289,249 916 $158,373 4 $1,462,922 405 $280,835 40 $120,158 APPLICATIONS WITHDRAWN 17 $249,203 569 $260,733 1,769 $285,455 237 $203,807 4 $3,378,948 177 $257,295 7 $75,356 FILES CLOSED FOR INCOMPLETENESS 3 $193,837 200 $279,914 792 $294,073 49 $186,594 0 $0 60 $237,195 5 $134,600
Aggregated Statistics For Year 2006(Based on 29 full and 8 partial tracts) A) FHA, FSA/RHS & VA B) Conventional C) Refinancings D) Home Improvement Loans E) Loans on Dwellings For 5+ Families F) Non-occupant Loans on G) Loans On Manufactured Number Average Value Number Average Value Number Average Value Number Average Value Number Average Value Number Average Value Number Average Value
LOANS ORIGINATED 14 $215,019 6,284 $218,199 8,783 $258,411 1,270 $163,801 14 $1,337,154 1,051 $229,894 40 $91,668 APPLICATIONS APPROVED, NOT ACCEPTED 2 $249,325 1,290 $229,959 1,966 $266,107 257 $148,488 0 $0 284 $224,401 26 $83,554 APPLICATIONS DENIED 5 $240,302 2,993 $231,784 5,382 $282,183 1,129 $149,645 7 $3,137,596 451 $261,188 53 $123,344 APPLICATIONS WITHDRAWN 6 $290,592 1,645 $227,199 3,560 $275,029 401 $188,049 2 $272,320 346 $224,217 13 $132,648 FILES CLOSED FOR INCOMPLETENESS 3 $146,333 334 $227,288 841 $270,257 66 $201,845 3 $480,000 62 $263,697 1 $150,000
Aggregated Statistics For Year 2005(Based on 29 full and 8 partial tracts) A) FHA, FSA/RHS & VA B) Conventional C) Refinancings D) Home Improvement Loans E) Loans on Dwellings For 5+ Families F) Non-occupant Loans on G) Loans On Manufactured Number Average Value Number Average Value Number Average Value Number Average Value Number Average Value Number Average Value Number Average Value
LOANS ORIGINATED 37 $214,386 8,095 $202,447 10,532 $229,204 1,314 $152,922 13 $4,537,373 1,354 $214,391 54 $104,202 APPLICATIONS APPROVED, NOT ACCEPTED 5 $238,788 1,444 $201,551 1,851 $228,292 248 $119,975 0 $0 283 $212,581 66 $76,025 APPLICATIONS DENIED 10 $234,579 2,705 $205,731 4,610 $240,558 952 $113,166 0 $0 478 $225,756 75 $89,887 APPLICATIONS WITHDRAWN 13 $241,630 2,022 $212,373 3,916 $235,365 508 $169,668 1 $430,500 373 $219,811 20 $123,593 FILES CLOSED FOR INCOMPLETENESS 5 $211,600 322 $213,421 1,223 $228,840 79 $143,119 1 $750,790 73 $213,544 7 $154,487
Aggregated Statistics For Year 2004(Based on 29 full and 8 partial tracts) A) FHA, FSA/RHS & VA B) Conventional C) Refinancings D) Home Improvement Loans E) Loans on Dwellings For 5+ Families F) Non-occupant Loans on G) Loans On Manufactured Number Average Value Number Average Value Number Average Value Number Average Value Number Average Value Number Average Value Number Average Value
LOANS ORIGINATED 154 $198,979 6,971 $175,831 10,600 $182,417 1,217 $127,128 13 $1,589,249 1,298 $173,622 39 $95,270 APPLICATIONS APPROVED, NOT ACCEPTED 17 $188,838 1,341 $180,248 2,104 $180,247 190 $96,780 0 $0 225 $174,794 38 $77,842 APPLICATIONS DENIED 35 $198,853 1,936 $172,935 4,132 $182,212 958 $86,094 3 $243,133 377 $162,921 76 $73,172 APPLICATIONS WITHDRAWN 37 $199,099 1,414 $192,519 3,294 $178,542 437 $124,309 3 $1,184,960 254 $181,189 9 $94,230 FILES CLOSED FOR INCOMPLETENESS 6 $189,345 271 $185,321 1,049 $181,769 94 $110,432 0 $0 53 $163,553 0 $0
Aggregated Statistics For Year 2003(Based on 29 full and 8 partial tracts) A) FHA, FSA/RHS & VA B) Conventional C) Refinancings D) Home Improvement Loans E) Loans on Dwellings For 5+ Families F) Non-occupant Loans on Number Average Value Number Average Value Number Average Value Number Average Value Number Average Value Number Average Value
LOANS ORIGINATED 809 $163,637 4,391 $141,322 10,740 $135,412 318 $52,199 10 $1,076,109 1,000 $122,825 APPLICATIONS APPROVED, NOT ACCEPTED 53 $169,195 807 $138,557 1,907 $140,605 126 $54,069 0 $0 246 $138,705 APPLICATIONS DENIED 122 $160,065 1,150 $134,636 4,038 $137,439 427 $40,140 3 $683,280 313 $133,507 APPLICATIONS WITHDRAWN 89 $160,632 688 $142,363 2,992 $137,941 101 $56,344 0 $0 169 $119,864 FILES CLOSED FOR INCOMPLETENESS 34 $153,585 150 $142,513 635 $134,849 28 $53,868 1 $3,010,000 54 $114,060
Aggregated Statistics For Year 1999(Based on 2 full and 4 partial tracts) A) FHA, FSA/RHS & VA B) Conventional C) Refinancings D) Home Improvement Loans E) Loans on Dwellings For 5+ Families F) Non-occupant Loans on Number Average Value Number Average Value Number Average Value Number Average Value Number Average Value Number Average Value
LOANS ORIGINATED 1,215 $96,513 546 $82,518 1,200 $92,613 211 $25,747 27 $282,333 204 $70,812 APPLICATIONS APPROVED, NOT ACCEPTED 66 $95,295 92 $88,435 324 $88,471 177 $25,006 5 $211,548 34 $81,853 APPLICATIONS DENIED 140 $103,506 253 $88,044 1,115 $74,435 432 $21,018 9 $190,178 88 $80,008 APPLICATIONS WITHDRAWN 135 $93,931 172 $91,278 570 $86,213 31 $26,566 7 $114,669 44 $92,958 FILES CLOSED FOR INCOMPLETENESS 26 $95,950 35 $74,051 206 $93,741 4 $20,100 3 $89,057 19 $82,548
Detailed mortgage data for all 37 tracts in Moreno Valley, CA
Private Mortgage Insurance Companies Aggregated Statistics For Year 2009(Based on 26 full and 7 partial tracts) A) Conventional B) Refinancings C) Non-occupant Loans on Number Average Value Number Average Value Number Average Value
LOANS ORIGINATED 108 $152,476 2 $173,465 3 $136,147 APPLICATIONS APPROVED, NOT ACCEPTED 96 $186,141 8 $286,902 0 $0 APPLICATIONS DENIED 24 $162,651 8 $215,039 0 $0 APPLICATIONS WITHDRAWN 7 $153,159 1 $239,130 0 $0 FILES CLOSED FOR INCOMPLETENESS 15 $237,208 0 $0 1 $185,860
Aggregated Statistics For Year 2008(Based on 29 full and 8 partial tracts) A) Conventional B) Refinancings C) Non-occupant Loans on D) Loans On Manufactured Number Average Value Number Average Value Number Average Value Number Average Value
LOANS ORIGINATED 585 $219,816 112 $314,282 39 $205,365 0 $0 APPLICATIONS APPROVED, NOT ACCEPTED 363 $286,297 245 $343,035 23 $248,584 0 $0 APPLICATIONS DENIED 122 $210,045 24 $297,922 26 $202,918 0 $0 APPLICATIONS WITHDRAWN 36 $213,433 12 $297,298 6 $212,490 2 $173,000 FILES CLOSED FOR INCOMPLETENESS 22 $289,147 8 $338,842 10 $331,894 0 $0
Aggregated Statistics For Year 2007(Based on 29 full and 8 partial tracts) A) Conventional B) Refinancings C) Non-occupant Loans on Number Average Value Number Average Value Number Average Value
LOANS ORIGINATED 346 $318,979 322 $348,141 22 $283,670 APPLICATIONS APPROVED, NOT ACCEPTED 55 $329,796 126 $359,320 4 $339,750 APPLICATIONS DENIED 26 $332,836 49 $362,439 10 $337,465 APPLICATIONS WITHDRAWN 28 $328,748 51 $374,675 3 $334,733 FILES CLOSED FOR INCOMPLETENESS 0 $0 2 $324,435 0 $0
Aggregated Statistics For Year 2006(Based on 29 full and 8 partial tracts) A) Conventional B) Refinancings C) Non-occupant Loans on D) Loans On Manufactured Number Average Value Number Average Value Number Average Value Number Average Value
LOANS ORIGINATED 100 $348,186 188 $346,475 8 $347,641 1 $144,000 APPLICATIONS APPROVED, NOT ACCEPTED 45 $342,366 82 $327,981 6 $325,252 0 $0 APPLICATIONS DENIED 3 $400,497 24 $372,214 2 $325,790 0 $0 APPLICATIONS WITHDRAWN 10 $373,326 25 $359,623 3 $382,260 0 $0 FILES CLOSED FOR INCOMPLETENESS 1 $271,780 1 $289,000 0 $0 0 $0
Aggregated Statistics For Year 2005(Based on 28 full and 8 partial tracts) A) Conventional B) Refinancings C) Non-occupant Loans on D) Loans On Manufactured Number Average Value Number Average Value Number Average Value Number Average Value
LOANS ORIGINATED 180 $302,958 178 $297,344 21 $270,963 1 $158,000 APPLICATIONS APPROVED, NOT ACCEPTED 55 $280,667 58 $265,265 8 $252,229 0 $0 APPLICATIONS DENIED 6 $300,755 7 $303,646 4 $263,778 0 $0 APPLICATIONS WITHDRAWN 11 $275,914 25 $291,295 3 $286,667 0 $0 FILES CLOSED FOR INCOMPLETENESS 3 $250,987 5 $290,212 0 $0 0 $0
Aggregated Statistics For Year 2004(Based on 29 full and 8 partial tracts) A) Conventional B) Refinancings C) Non-occupant Loans on D) Loans On Manufactured Number Average Value Number Average Value Number Average Value Number Average Value
LOANS ORIGINATED 488 $245,754 268 $216,225 64 $210,497 0 $0 APPLICATIONS APPROVED, NOT ACCEPTED 165 $227,653 127 $187,037 29 $219,449 0 $0 APPLICATIONS DENIED 17 $258,435 6 $173,853 3 $182,400 2 $134,685 APPLICATIONS WITHDRAWN 27 $240,240 22 $195,630 4 $227,232 0 $0 FILES CLOSED FOR INCOMPLETENESS 10 $251,881 14 $188,089 2 $183,205 0 $0
Aggregated Statistics For Year 2003(Based on 29 full and 8 partial tracts) A) Conventional B) Refinancings C) Non-occupant Loans on Number Average Value Number Average Value Number Average Value
LOANS ORIGINATED 772 $181,995 615 $159,315 64 $161,232 APPLICATIONS APPROVED, NOT ACCEPTED 162 $167,180 188 $157,196 14 $145,199 APPLICATIONS DENIED 16 $181,806 14 $165,165 4 $149,852 APPLICATIONS WITHDRAWN 47 $183,894 34 $167,593 5 $170,964 FILES CLOSED FOR INCOMPLETENESS 6 $185,903 0 $0 1 $162,000
Aggregated Statistics For Year 1999(Based on 2 full and 4 partial tracts) A) Conventional B) Refinancings C) Non-occupant Loans on Number Average Value Number Average Value Number Average Value
LOANS ORIGINATED 137 $113,050 180 $115,446 21 $88,459 APPLICATIONS APPROVED, NOT ACCEPTED 20 $122,936 36 $119,343 2 $103,350 APPLICATIONS DENIED 18 $113,074 13 $113,058 5 $75,570 APPLICATIONS WITHDRAWN 4 $121,112 8 $114,999 1 $88,520 FILES CLOSED FOR INCOMPLETENESS 1 $108,380 1 $157,750 0 $0
Fire-safe hotels and motels in Moreno Valley, California:
Comfort Inn In Moreno Valley, 23330 Sunnymead Blvd, Moreno Valley, California 92553 Phone: (951) 242-0699, Fax: (951) 243-8635
Best Western Image Suites, 24840 Elder Ave, Moreno Valley, California 92557 Phone: (909) 924-4546, Fax: (909) 247-9337
Motel 7, 23581 Alessandro Blvd, Moreno Valley, California 92553 Phone: (951) 656-4451
Econo Lodge, 24412 Sunnymead Blvd, Moreno Valley, California 92553 Phone: (951) 247-6699, Fax: (951) 243-0735
Hampton Inn & Suites Moreno Valley, 12611 Memorial Way, Moreno Valley, California 92551 Phone: (951) 571-7788, Fax: (951) 571-7789
Ayres Hotel & Spa Moreno Valley, 12631 Memorial Way, Moreno Valley, California 92553 Phone: (951) 571-4141, Fax: (951) 571-4143
La Quinta Inn & Suites, 23090 Sunnymead Blvd, Moreno Valley, California 92553 Phone: (951) 486-9000, Fax: (951) 486-9001
Fairfield Inn & Suites, 22100 Eucalyptus Ave, Moreno valley, California 92553 Phone: (888) 236-2427
All 8 fire-safe hotels and motels in Moreno Valley, California
Most common first names in Moreno Valley, CA among deceased individuals Name Count Lived (average)
James 157 69.1 years John 151 72.5 years Mary 148 77.7 years Robert 148 70.0 years William 137 71.8 years Maria 93 76.1 years George 82 71.4 years Charles 73 72.4 years Richard 70 65.3 years Dorothy 69 76.3 years
Most common last names in Moreno Valley, CA among deceased individuals Last name Count Lived (average)
Smith 74 75.1 years Williams 68 73.3 years Johnson 54 68.4 years Jones 53 70.8 years Brown 50 69.0 years Anderson 35 77.0 years Lopez 34 70.2 years Garcia 33 68.2 years Davis 33 70.3 years Rodriguez 32 69.7 years
Moreno Valley compared to California state average:
Unemployed percentage below state average. Black race population percentage significantly above state average. Hispanic race population percentage above state average. House age below state average. Moreno Valley, CA compared to other similar cities: Moreno Valley on our top lists :
#7 on the list of "Top 101 cities with the highest percentage of family households, population 100,000+"
#13 on the list of "Top 101 cities with largest percentage of females in industries: retail trade (population 50,000+)"
#18 on the list of "Top 101 cities with the largest percentage of one, detached housing units in structures (20,000+ housing units)"
#19 on the list of "Top 101 cities with largest percentage of males in industries: transportation and warehousing (population 50,000+)"
#23 on the list of "Top 101 cities with largest percentage of males in occupations: material moving occupations (population 50,000+)"
#30 on the list of "Top 101 cities with largest percentage of males in occupations: transportation occupations (population 50,000+)"
#34 on the list of "Top 100 low-educated but high-earning cities (pop. 50,000+)"
#55 on the list of "Top 101 cities with the least people having Master's or Doctorate degrees (population 50,000+)"
#58 on the list of "Top 100 cities with longest commuting times (pop. 50,000+)"
#61 on the list of "Top 100 cities with youngest residents (pop. 50,000+)"
#67 on the list of "Top 101 cities with the lowest average yearly precipitation (population 50,000+)"
#67 on the list of "Top 101 cities with the smallest percentage of high school students in private schools (3,000+ students)"
#69 on the list of "Top 101 cities with largest percentage of females in occupations: sales and related occupations (population 50,000+)"
#70 on the list of "Top 100 least-educated cities (pop. 50,000+)"
#77 on the list of "Top 101 cities with largest percentage of females in occupations: material moving occupations (population 50,000+)"
#79 on the list of "Top 101 cities with the largest differences between daily high and daily low temperatures (population 50,000+)"
#86 on the list of "Top 101 cities that people commute from (largest negative percentage daily daytime population change due to commuting) (population 50,000+)"
#87 on the list of "Top 101 cities with the lowest number of arson incidents per 100,000 residents (population 50,000+)"
#90 on the list of "Top 101 cities with the lowest percentage of English-only speaking households, population 50,000+"
#94 on the list of "Top 101 cities with fewest building permits per 10,000 residents (population 50,000+)"
#81 (92551) on the list of "Top 101 zip codes with the lowest 2012 average taxable interest for individuals (pop 5,000+)"
#3 on the list of "Top 101 counties with the highest lead air pollution readings in 2012 (µg/m3 )"
#4 on the list of "Top 101 counties with the highest ground withdrawal of fresh water for public supply"
#11 on the list of "Top 101 counties with the most Catholic adherents"
#11 on the list of "Top 101 counties with the highest total withdrawal of fresh water for public supply"
#12 on the list of "Top 101 counties with the highest carbon monoxide air pollution readings in 2012 (ppm)"
Top Patent Applicants
James T. Wright, Iii (7)
Jorge Mena (6)
Don Hair (5)
Raymond C. Torres (5)
Neftali Fernandez (5)
Nissim Amos (4)
Rousseau Kazi (4)
Joseph Gelb (3)
Cornel Gleason (3)
Gene Stauffer (2)
Total of 139 patent applications in 2008-2024.
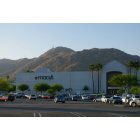
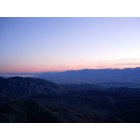
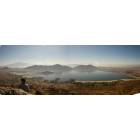

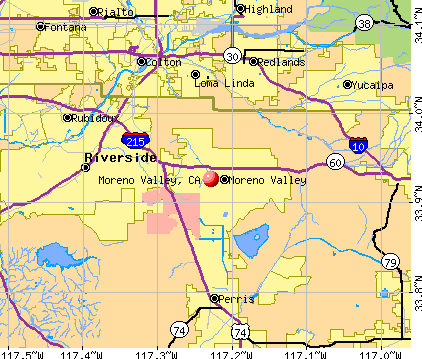


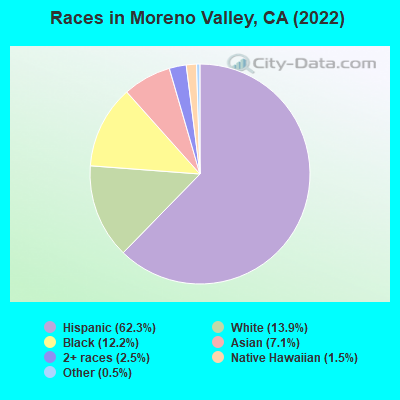
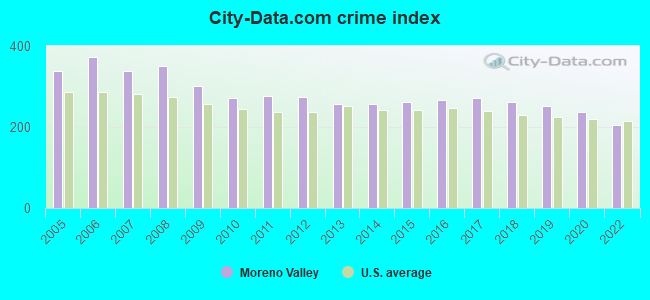
 Recent articles from our blog. Our writers, many of them Ph.D. graduates or candidates, create easy-to-read articles on a wide variety of topics.

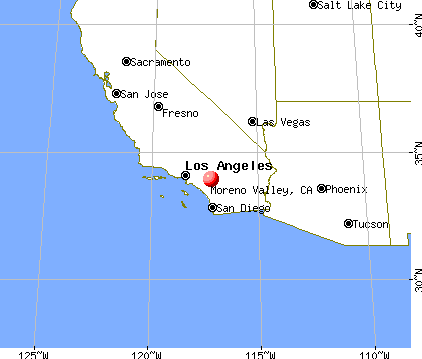
 (9.7 miles
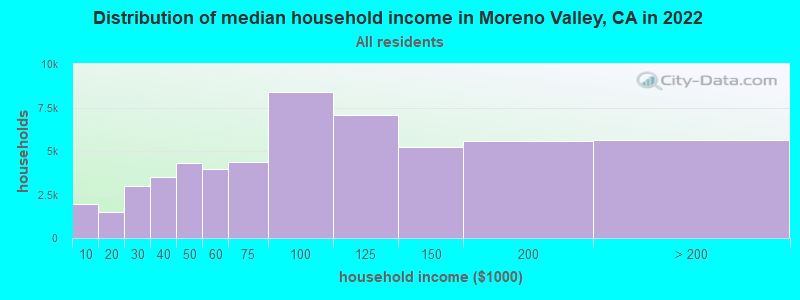
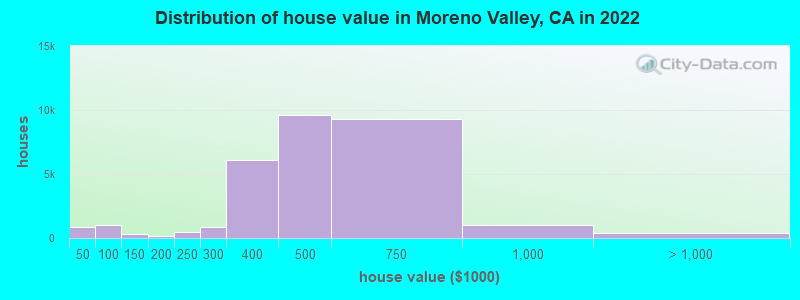
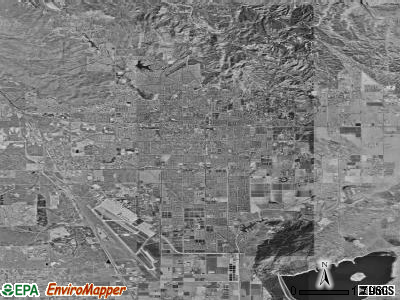
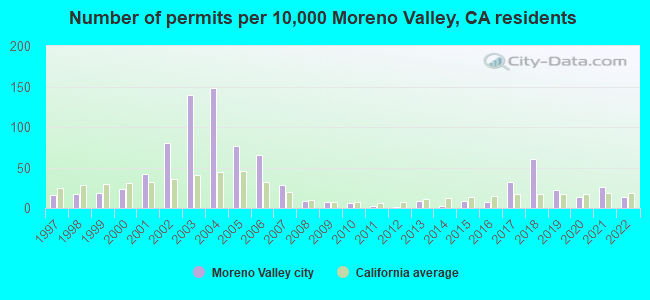
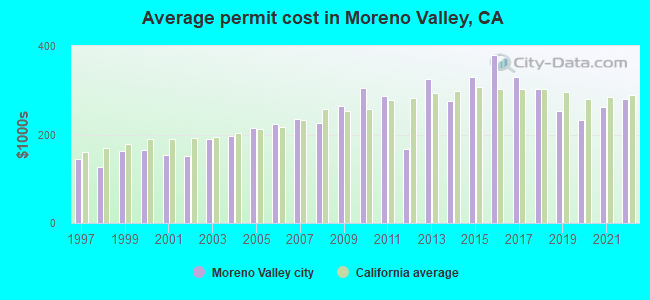
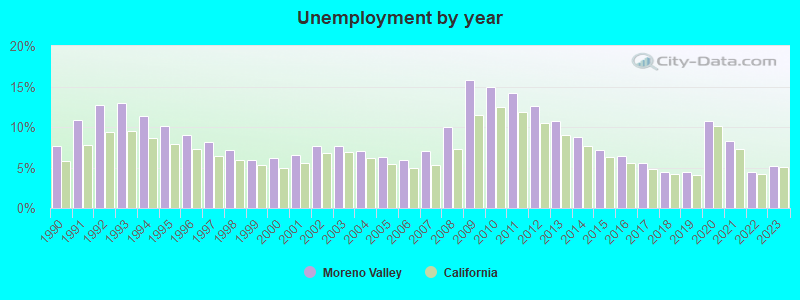
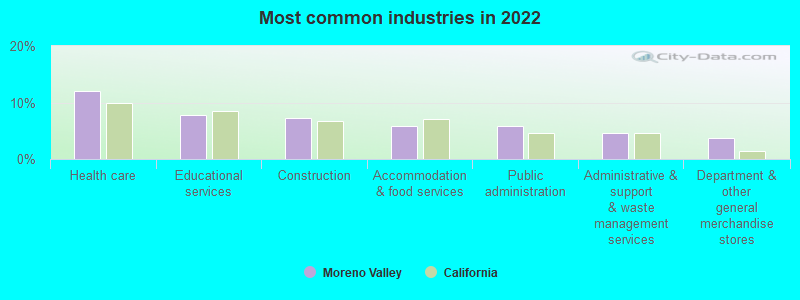
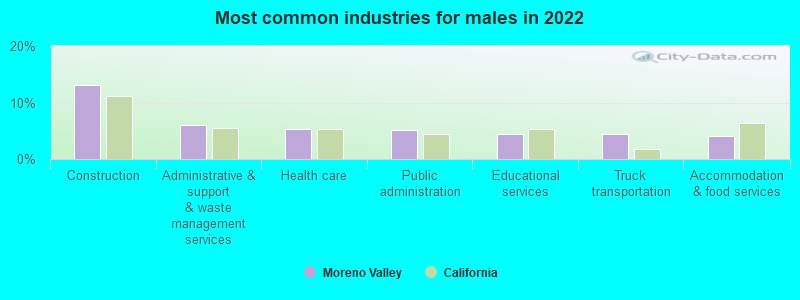
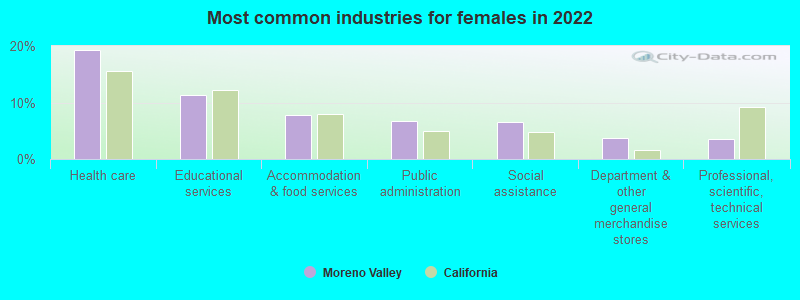
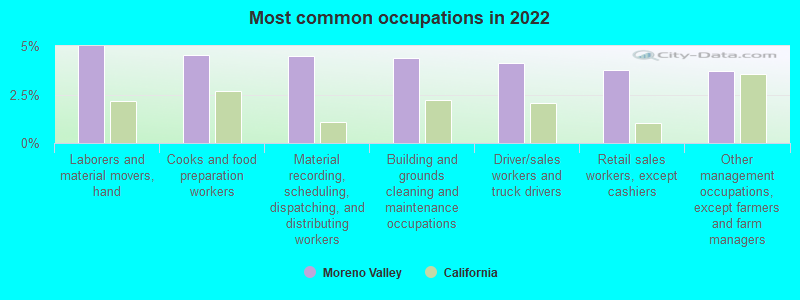
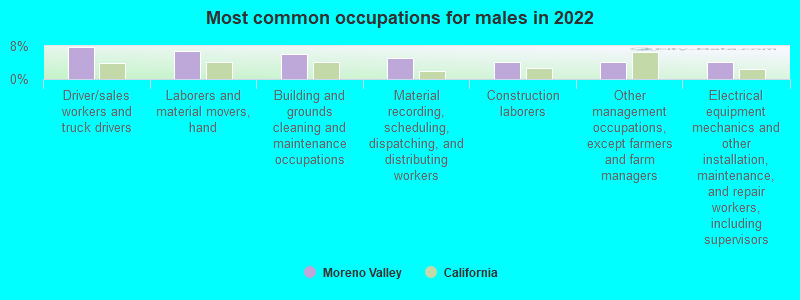
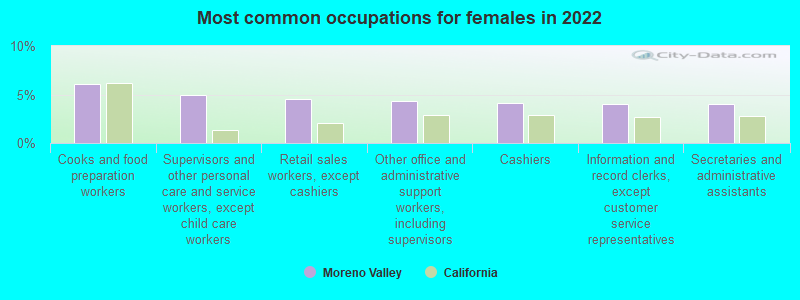
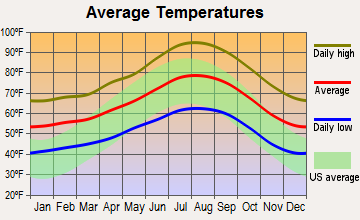

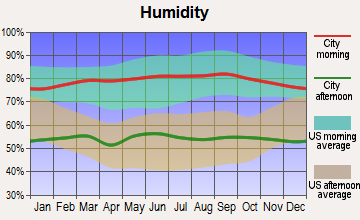
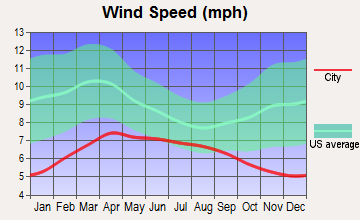
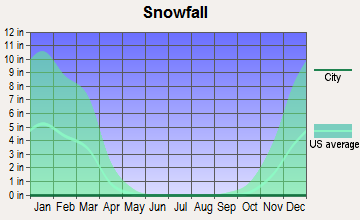
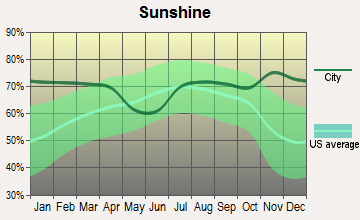
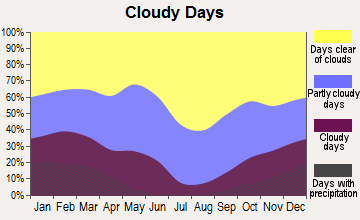
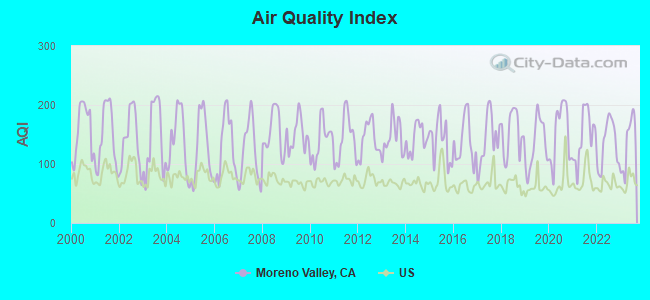
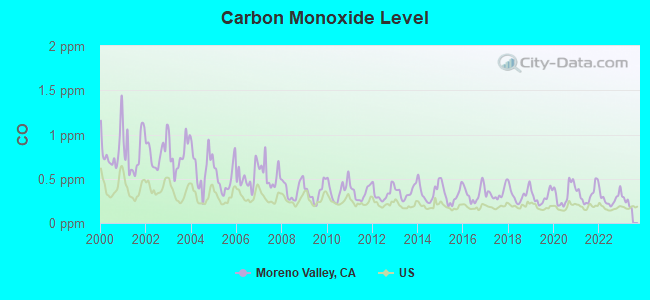
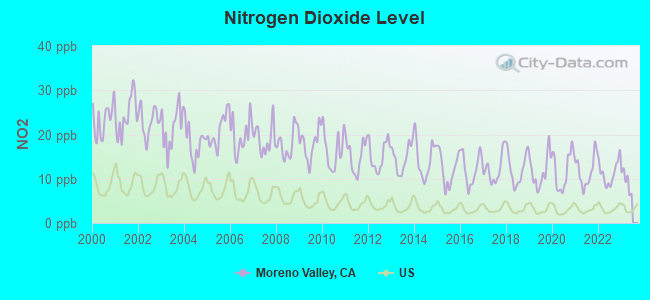
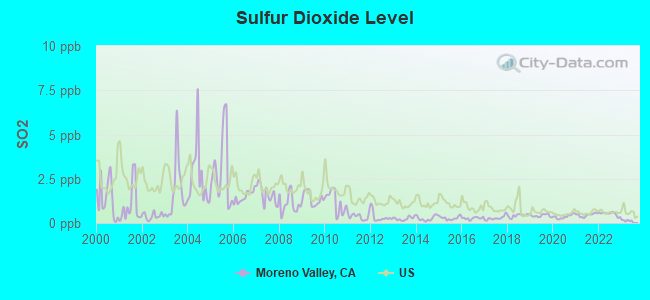
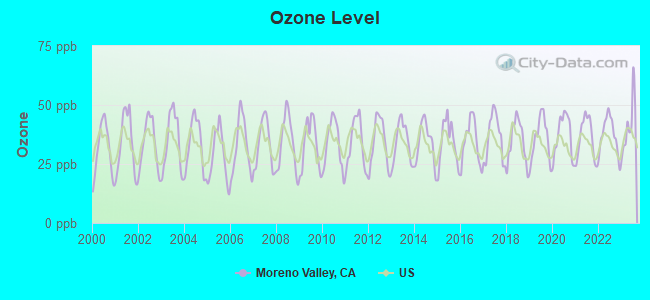
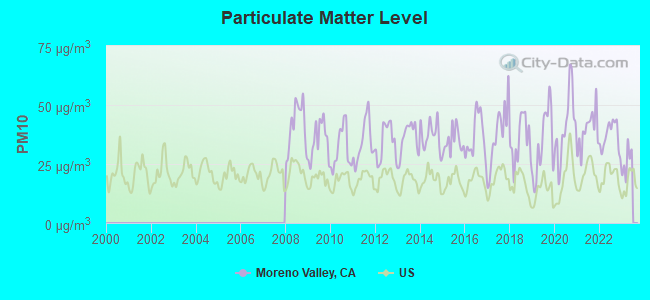
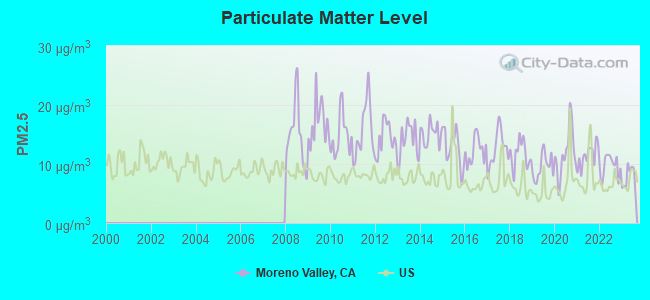
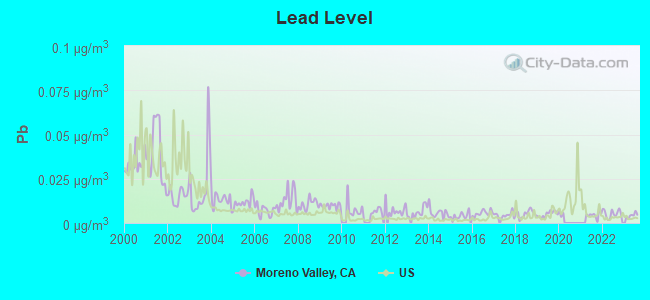
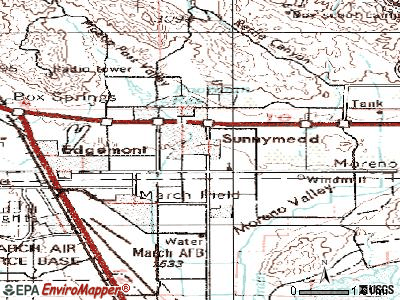
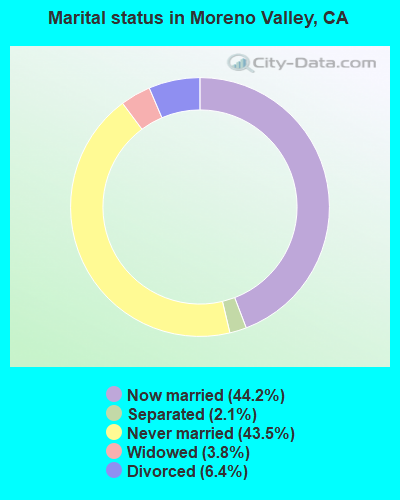
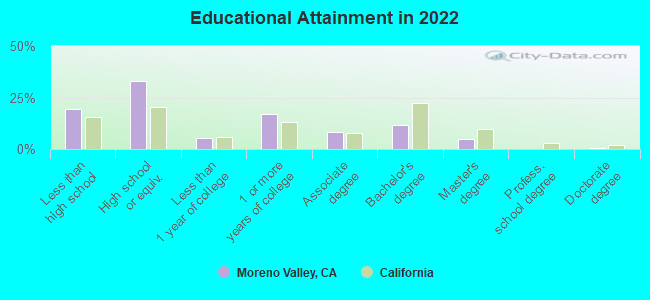
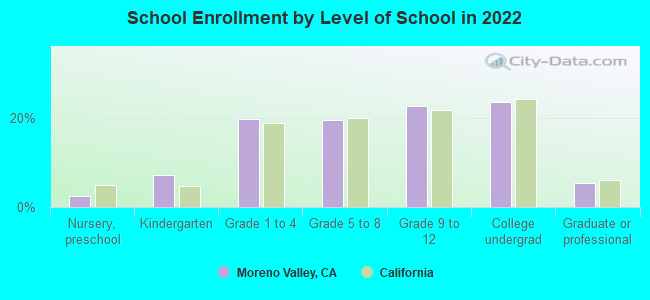
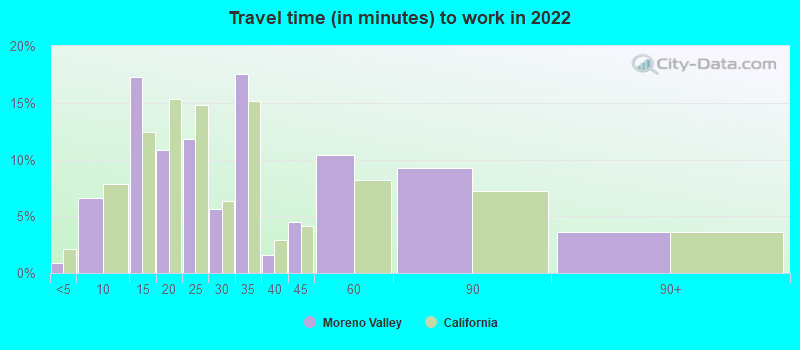
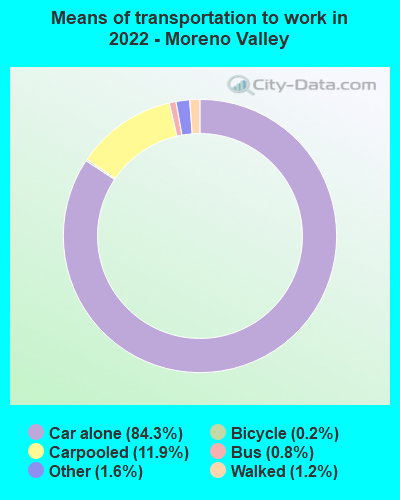


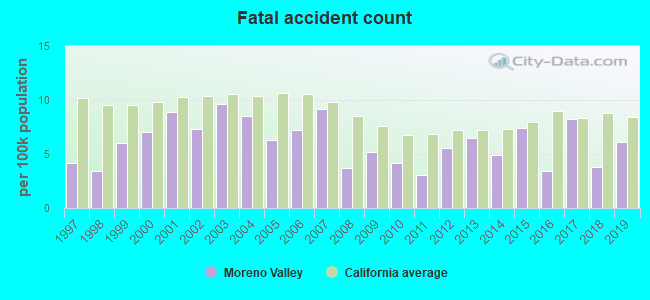
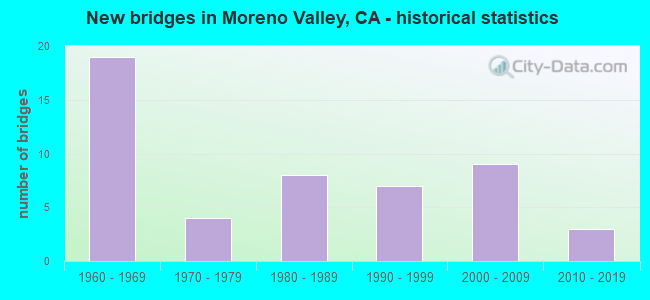
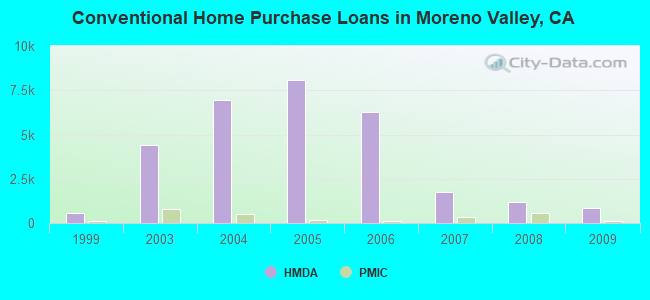
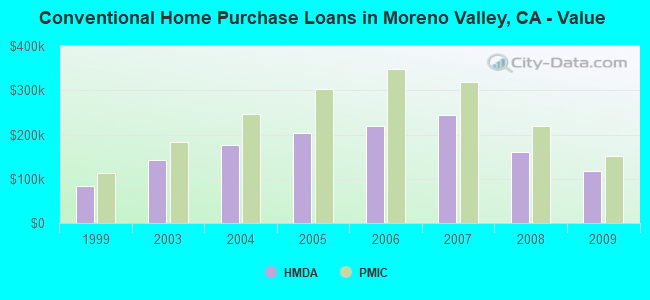
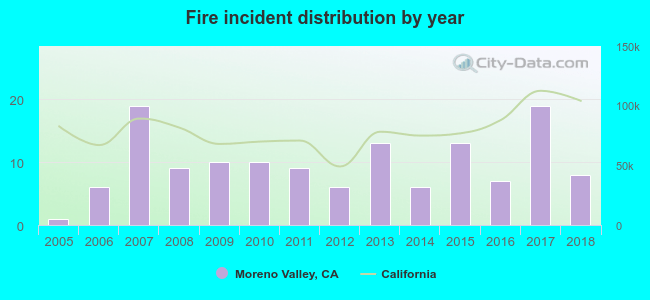 According to the data from the years 2005 - 2018 the average number of fire incidents per year is 10. The highest number of reported fires - 19 took place in 2007, and the least - 1 in 2005. The data has a rising trend.
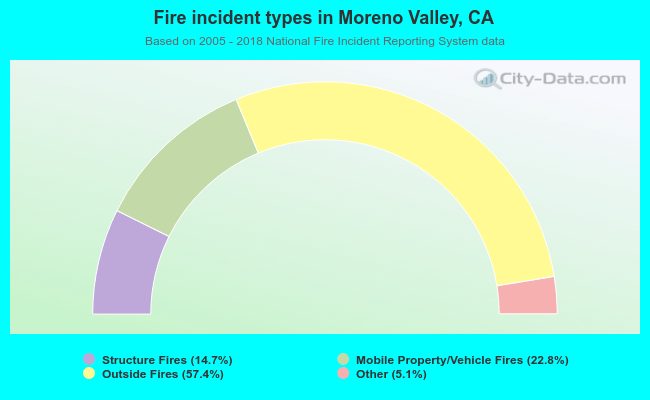 When looking into fire subcategories, the most incidents belonged to: Outside Fires (57.4%), and Mobile Property/Vehicle Fires (22.8%).