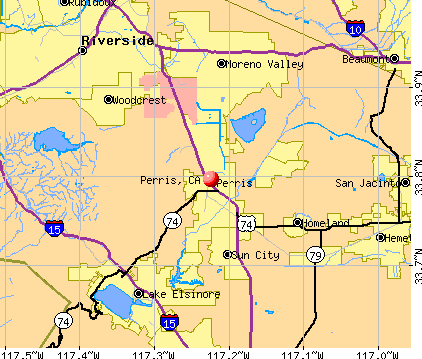
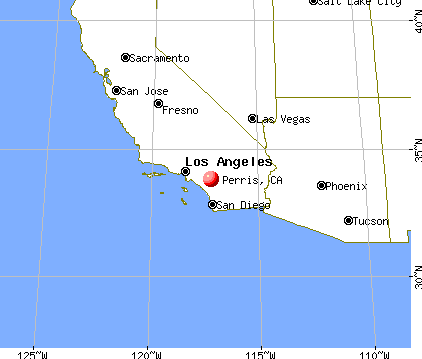
Perris, California
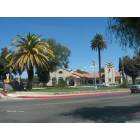
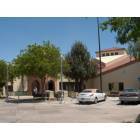
Perris: Perris City Office Building
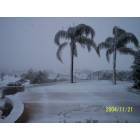
Perris: Palm Trees and Snow?
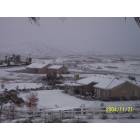
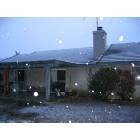
Perris: Sunday Morning Heavy Snow
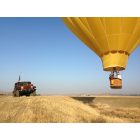
Perris: Hot Air Ballooning in Perris, CA
Perris: View from parking lot of Perris Library
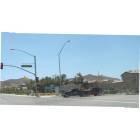
Perris: Monument Ranch Subdivision - Goetz RD & Monument
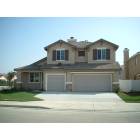
Perris: lake perris home
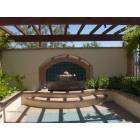
Perris: Perris Library Court yard area
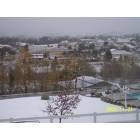
Perris: Weird weather! Snow in Perris 11/2004
Perris: Gavilan Hills
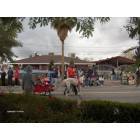
Perris: Christmas Parade - Two Great Danes with antlers
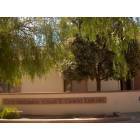
Perris: Perris Library at Perris Blvd & San Jacinto Ave
- add
your
Submit your own pictures of this city and show them to the world
- OSM Map
- General Map
- Google Map
- MSN Map
Population change since 2000: +121.8%
| Males: 40,521 | |
| Females: 39,742 |
| Median resident age: | 30.5 years |
| California median age: | 37.9 years |
Zip codes: 92571.
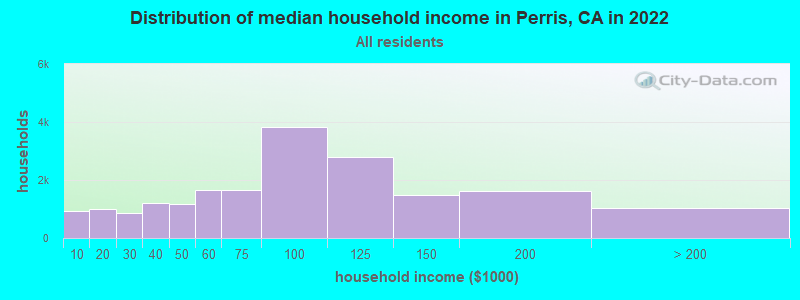
| Perris: | $80,234 |
| CA: | $91,551 |
Estimated per capita income in 2022: $22,294 (it was $11,425 in 2000)
Perris city income, earnings, and wages data
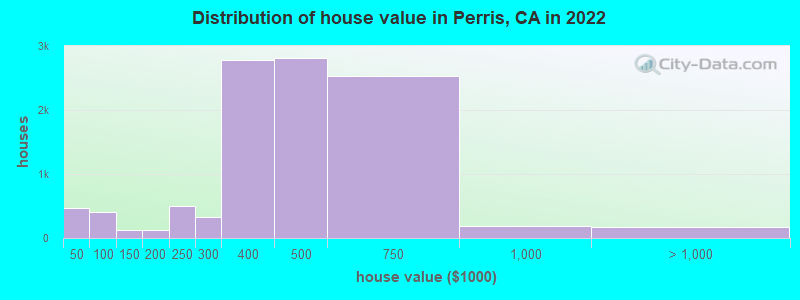
Estimated median house or condo value in 2022: $476,400 (it was $87,100 in 2000)
| Perris: | $476,400 |
| CA: | $715,900 |
Mean prices in 2022: all housing units: $388,700; detached houses: $407,482; townhouses or other attached units: $288,140; mobile homes: $204,845
Median gross rent in 2022: $1,760.
(10.8% for White Non-Hispanic residents, 17.9% for Black residents, 17.8% for Hispanic or Latino residents, 47.5% for American Indian residents, 8.1% for Native Hawaiian and other Pacific Islander residents, 21.1% for other race residents, 5.4% for two or more races residents)
Detailed information about poverty and poor residents in Perris, CA

Compare current foreclosures in Perris, CA:
| Photo | Address | Area | Beds / Baths | Price | Details |
|---|---|---|---|---|---|

|
#1
Red Maple Pl
Perris, CA 92570
|
1,049 sq. feet
|
2 baths 2 beds |
$24,292
|
show details |

|
#2
Murrieta Rd
Perris, CA 92571
|
1,344 sq. feet
|
2 baths 2 beds |
$16,636
|
show details |

|
#3
Almond Dr
Perris, CA 92571
|
1,516 sq. feet
|
2 baths 3 beds |
show details | |

|
#4
Mcguire Rd
Perris, CA 92570
|
6,347 sq. feet
|
4 baths 5 beds |
show details | |

|
#5
Whieldon Dr
Perris, CA 92571
|
2,177 sq. feet
|
2 baths 4 beds |
show details | |

|
#6
Serrana Rd
Perris, CA 92570
|
1,300 sq. feet
|
2 baths 3 beds |
show details | |

|
#7
Fortuna St
Perris, CA 92571
|
- sq. feet
|
2 baths 3 beds |
show details | |

|
#8
Gloriosa Ave
Perris, CA 92571
|
2,314 sq. feet
|
2 baths 4 beds |
show details | |

|
#9
Park Ave
Perris, CA 92570
|
1,368 sq. feet
|
1 baths 3 beds |
show details | |

|
#10
Veranda Ct
Perris, CA 92571
|
2,000 sq. feet
|
2 baths 3 beds |
show details |
| Photo | Address | Area | Beds / Baths | Price | Details |
|---|---|---|---|---|---|

|
#11
Moore St
Perris, CA 92570
|
784 sq. feet
|
1 baths 1 beds |
show details | |

|
#12
Gazania Dr
Perris, CA 92571
|
2,516 sq. feet
|
2 baths 4 beds |
show details | |

|
#13
Clear Lake St
Perris, CA 92571
|
1,210 sq. feet
|
2 baths 3 beds |
show details | |

|
#14
E San Jacinto Ave Spc 190
Perris, CA 92571
|
1,552 sq. feet
|
2 baths 3 beds |
show details | |

|
#15
Serrana Rd
Perris, CA 92570
|
1,300 sq. feet
|
2 baths 3 beds |
show details | |

|
#16
Peak Trl
Perris, CA 92570
|
2,305 sq. feet
|
3 baths 4 beds |
show details | |

|
#17
Chant St
Perris, CA 92571
|
1,035 sq. feet
|
2 baths 2 beds |
show details | |

|
#18
Curlew St
Perris, CA 92571
|
2,305 sq. feet
|
2 baths 3 beds |
show details | |

|
#19
Redlands Ave
Perris, CA 92571
|
1,293 sq. feet
|
2 baths 3 beds |
show details | |

|
#20
Avenida San Sebastian
Perris, CA 92571
|
1,309 sq. feet
|
2 baths 4 beds |
show details |
| Photo | Address | Area | Beds / Baths | Price | Details |
|---|---|---|---|---|---|

|
#21
Bunting Way
Perris, CA 92571
|
2,296 sq. feet
|
2 baths 3 beds |
show details | |

|
#22
Byron St
Perris, CA 92570
|
1,154 sq. feet
|
2 baths 3 beds |
show details | |

|
#23
Riverwalk Ct
Perris, CA 92571
|
3,881 sq. feet
|
3 baths 4 beds |
show details | |

|
#24
Burns St
Perris, CA 92570
|
864 sq. feet
|
1 baths 3 beds |
show details | |

|
#25
Akina Ave
Perris, CA 92571
|
1,846 sq. feet
|
2 baths 3 beds |
show details | |

|
#26
Barn Owl Dr
Perris, CA 92571
|
- sq. feet
|
- baths - beds |
$51,340
|
show details |

|
#27
San Felipe St
Perris, CA 92571
|
1,440 sq. feet
|
2 baths 2 beds |
show details | |

|
#28
Red Spruce Pl
Perris, CA 92570
|
1,009 sq. feet
|
2 baths 2 beds |
show details | |

|
#29
Caden Pl
Perris, CA 92571
|
2,352 sq. feet
|
2 baths 3 beds |
show details | |

|
#30
Mural St
Perris, CA 92570
|
1,412 sq. feet
|
2 baths 3 beds |
show details |
| Photo | Address | Area | Beds / Baths | Price | Details |
|---|---|---|---|---|---|

|
#31
Garnet Dr
Perris, CA 92571
|
1,344 sq. feet
|
1 baths 2 beds |
show details | |

|
#32
Louise St
Perris, CA 92570
|
1,002 sq. feet
|
1 baths 3 beds |
show details | |

|
#33
Azra Ct
Perris, CA 92571
|
1,593 sq. feet
|
2 baths 4 beds |
show details | |

|
#34
Placentia Ave
Perris, CA 92571
|
1,180 sq. feet
|
2 baths 3 beds |
show details | |

|
#35
Palm St
Perris, CA 92570
|
1,000 sq. feet
|
2 baths 3 beds |
show details | |

|
#36
Cox Rd
Perris, CA 92570
|
700 sq. feet
|
2 baths 2 beds |
show details | |

|
#37
Bond Dr
Perris, CA 92570
|
1,320 sq. feet
|
2 baths 2 beds |
show details | |

|
#38
Whirlaway St
Perris, CA 92571
|
1,371 sq. feet
|
2 baths 3 beds |
show details | |

|
#39
Heirloom Ave
Perris, CA 92571
|
1,500 sq. feet
|
3 baths 4 beds |
show details | |

|
#40
Rimrock Dr
Perris, CA 92570
|
- sq. feet
|
- baths - beds |
$181,639
|
show details |
| Photo | Address | Area | Beds / Baths | Price | Details |
|---|---|---|---|---|---|

|
#41
Johns Rd
Perris, CA 92571
|
1,212 sq. feet
|
2 baths 3 beds |
show details | |

|
#42
Abbey Pines Dr
Perris, CA 92571
|
1,212 sq. feet
|
2 baths 3 beds |
show details | |

|
#43
El Nido Ave
Perris, CA 92571
|
3,046 sq. feet
|
3 baths 5 beds |
show details | |

|
#44
Sunpark Dr
Perris, CA 92570
|
2,862 sq. feet
|
3 baths 3 beds |
show details | |

|
#45
W Bowen Rd
Perris, CA 92571
|
1,417 sq. feet
|
2 baths 4 beds |
show details | |

|
#46
Palomas Dr
Perris, CA 92570
|
1,344 sq. feet
|
2 baths 2 beds |
show details | |

|
#47
Monument Pkwy
Perris, CA 92570
|
3,050 sq. feet
|
3 baths 3 beds |
show details | |

|
#48
W 3rd St
Perris, CA 92570
|
1,181 sq. feet
|
2 baths 3 beds |
show details | |

|
#49
Windmill Ct
Perris, CA 92571
|
2,854 sq. feet
|
3 baths 5 beds |
show details | |

|
Check over 1 million property listings on Foreclosure.com!
|
browse all offers | |||


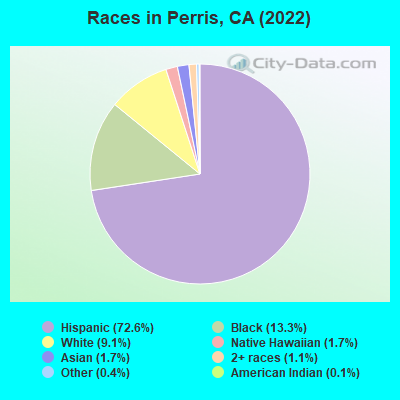
- 58,24872.6%Hispanic
- 10,70713.3%Black alone
- 7,3429.1%White alone
- 1,3451.7%Asian alone
- 1,3641.7%Native Hawaiian and Other
Pacific Islander alone - 8581.1%Two or more races
- 3020.4%Other race alone
- 920.1%American Indian alone
According to our research of California and other state lists, there were 207 registered sex offenders living in Perris, California as of April 27, 2024.
The ratio of all residents to sex offenders in Perris is 369 to 1.
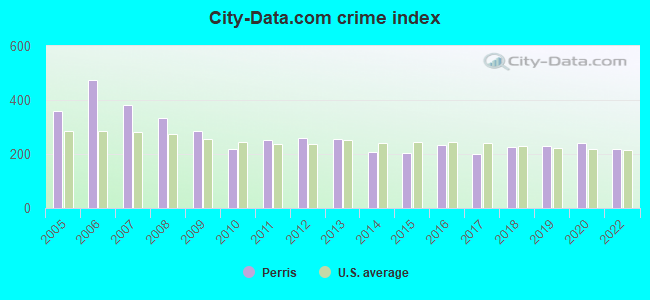
The City-Data.com crime index weighs serious crimes and violent crimes more heavily. Higher means more crime, U.S. average is 246.1. It adjusts for the number of visitors and daily workers commuting into cities.
- means the value is smaller than the state average.- means the value is about the same as the state average.
- means the value is bigger than the state average.
- means the value is much bigger than the state average.
Crime rate in Perris detailed stats: murders, rapes, robberies, assaults, burglaries, thefts, arson
Full-time law enforcement employees in 2015, including police officers: 1 (1 officers - 1 male; 0 female).
| Officers per 1,000 residents here: | 0.01 |
| California average: | 1.98 |
 Recent articles from our blog. Our writers, many of them Ph.D. graduates or candidates, create easy-to-read articles on a wide variety of topics.

 | Natural decrease in California's population (170 replies) |
| Is Perris, CA the next big real estate bubble boom??? (16 replies) |
| The Los Angeles Homeless Containment Thread (9133 replies) |
| Moreno Valley that bad?? (135 replies) |
| where in california you can still live cheaply (52 replies) |
| Moreno Valley Mall Redevelopment Idea (7 replies) |
Latest news from Perris, CA collected exclusively by city-data.com from local newspapers, TV, and radio stations
Ancestries: American (1.2%).
Current Local Time: PST time zone
Elevation: 1457 feet
Land area: 31.4 square miles.
Population density: 2,558 people per square mile (average).
24,404 residents are foreign born (26.9% Latin America).
| This city: | 30.4% |
| California: | 26.5% |
Median real estate property taxes paid for housing units with mortgages in 2022: $3,665 (0.8%)
Median real estate property taxes paid for housing units with no mortgage in 2022: $2,585 (0.6%)
Nearest city with pop. 50,000+: Perris Valley, CA (2.2 miles  , pop. 144,533).
Nearest city with pop. 200,000+: Riverside, CA (14.4 miles , pop. 255,166).
Nearest city with pop. 1,000,000+: Los Angeles, CA (69.0 miles , pop. 3,694,820).
Nearest cities:
), ), ), ), Latitude: 33.80 N, Longitude: 117.22 W
Daytime population change due to commuting: -1,188 (-1.5%)
Workers who live and work in this city: 8,096 (24.0%)
Area code: 909
Perris, California accommodation & food services, waste management - Economy and Business Data
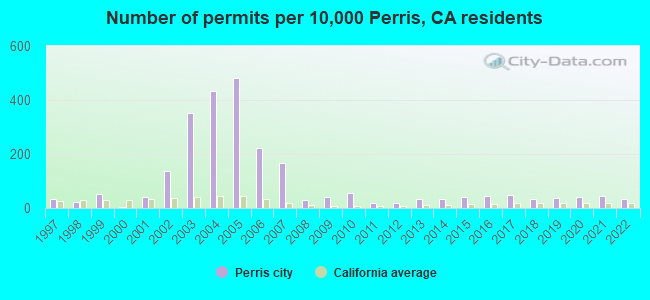
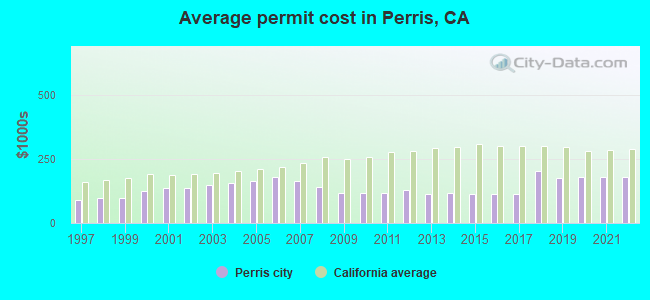
Single-family new house construction building permits:
- 2022: 127 buildings, average cost: $179,800
- 2021: 156 buildings, average cost: $179,200
- 2020: 145 buildings, average cost: $180,900
- 2019: 137 buildings, average cost: $174,800
- 2018: 115 buildings, average cost: $204,300
- 2017: 176 buildings, average cost: $115,300
- 2016: 157 buildings, average cost: $115,300
- 2015: 141 buildings, average cost: $115,200
- 2014: 119 buildings, average cost: $115,700
- 2013: 120 buildings, average cost: $113,300
- 2012: 60 buildings, average cost: $127,500
- 2011: 63 buildings, average cost: $118,800
- 2010: 207 buildings, average cost: $117,300
- 2009: 147 buildings, average cost: $117,300
- 2008: 107 buildings, average cost: $141,400
- 2007: 599 buildings, average cost: $162,900
- 2006: 812 buildings, average cost: $182,100
- 2005: 1746 buildings, average cost: $165,500
- 2004: 1573 buildings, average cost: $154,700
- 2003: 1269 buildings, average cost: $148,800
- 2002: 492 buildings, average cost: $136,200
- 2001: 145 buildings, average cost: $135,500
- 2000: 9 buildings, average cost: $124,200
- 1999: 186 buildings, average cost: $96,100
- 1998: 85 buildings, average cost: $97,000
- 1997: 116 buildings, average cost: $89,100
| Here: | 6.2% |
| California: | 5.1% |
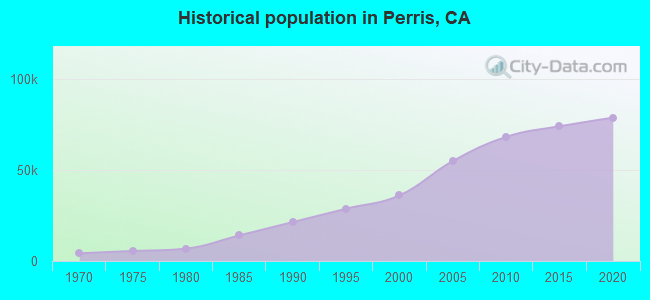
Population change in the 1990s: +14,134 (+64.1%).
- Construction (11.3%)
- Health care (7.8%)
- Accommodation & food services (6.5%)
- Educational services (6.3%)
- Administrative & support & waste management services (5.8%)
- Transportation equipment (4.6%)
- Public administration (4.4%)
- Construction (18.7%)
- Administrative & support & waste management services (7.0%)
- Transportation equipment (6.3%)
- Accommodation & food services (4.7%)
- Miscellaneous manufacturing (4.2%)
- Educational services (4.0%)
- Public administration (3.8%)
- Health care (13.9%)
- Educational services (9.3%)
- Accommodation & food services (8.9%)
- Social assistance (5.1%)
- Public administration (5.1%)
- Department & other general merchandise stores (4.5%)
- Administrative & support & waste management services (4.2%)
- Other production occupations, including supervisors (5.7%)
- Building and grounds cleaning and maintenance occupations (4.1%)
- Other office and administrative support workers, including supervisors (4.1%)
- Driver/sales workers and truck drivers (4.0%)
- Assemblers and fabricators (4.0%)
- Metal workers and plastic workers (3.9%)
- Other sales and related occupations, including supervisors (3.6%)
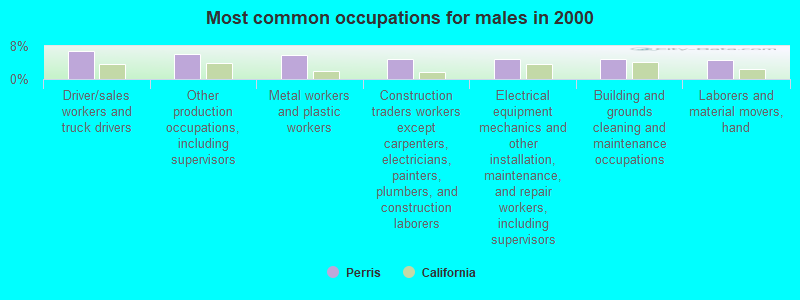
- Driver/sales workers and truck drivers (6.9%)
- Other production occupations, including supervisors (6.1%)
- Metal workers and plastic workers (5.8%)
- Construction traders workers except carpenters, electricians, painters, plumbers, and construction laborers (4.9%)
- Electrical equipment mechanics and other installation, maintenance, and repair workers, including supervisors (4.8%)
- Building and grounds cleaning and maintenance occupations (4.8%)
- Laborers and material movers, hand (4.6%)
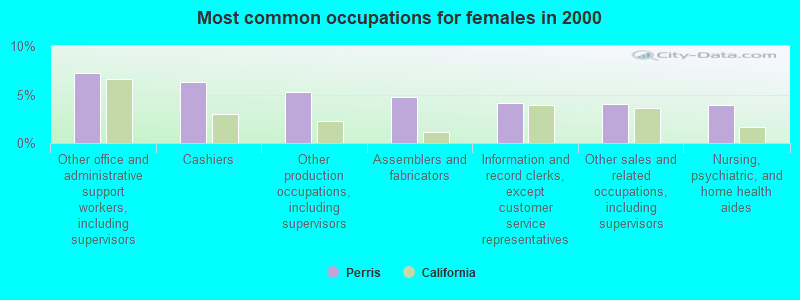
- Other office and administrative support workers, including supervisors (7.2%)
- Cashiers (6.3%)
- Other production occupations, including supervisors (5.3%)
- Assemblers and fabricators (4.7%)
- Information and record clerks, except customer service representatives (4.1%)
- Other sales and related occupations, including supervisors (4.0%)
- Nursing, psychiatric, and home health aides (3.9%)
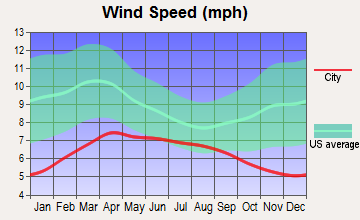
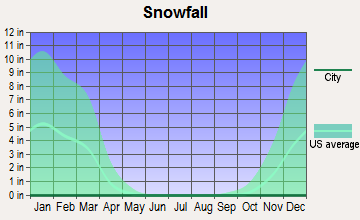
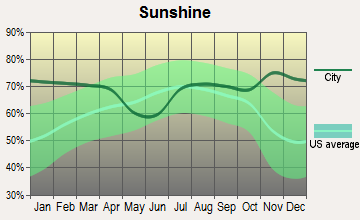
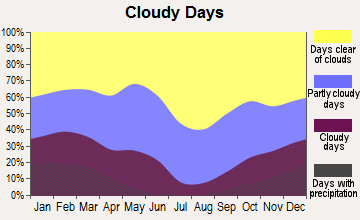
Average climate in Perris, California
Based on data reported by over 4,000 weather stations

|
|

(lower is better)
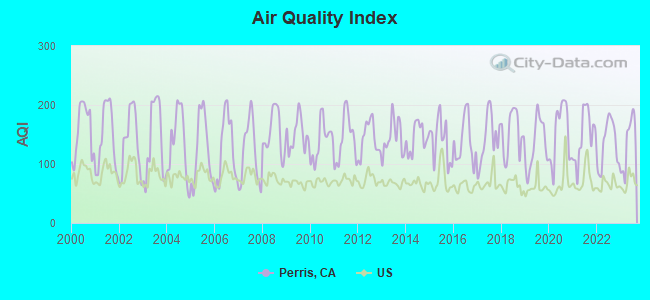
Air Quality Index (AQI) level in 2023 was 136. This is significantly worse than average.
| City: | 136 |
| U.S.: | 73 |
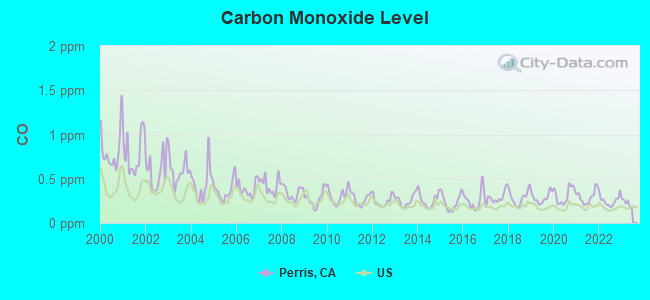
Carbon Monoxide (CO) [ppm] level in 2022 was 0.253. This is about average. Closest monitor was 0.5 miles away from the city center.
| City: | 0.253 |
| U.S.: | 0.251 |
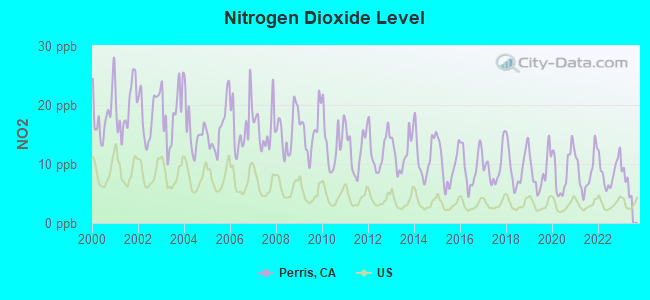
Nitrogen Dioxide (NO2) [ppb] level in 2022 was 8.64. This is significantly worse than average. Closest monitor was 0.5 miles away from the city center.
| City: | 8.64 |
| U.S.: | 5.11 |
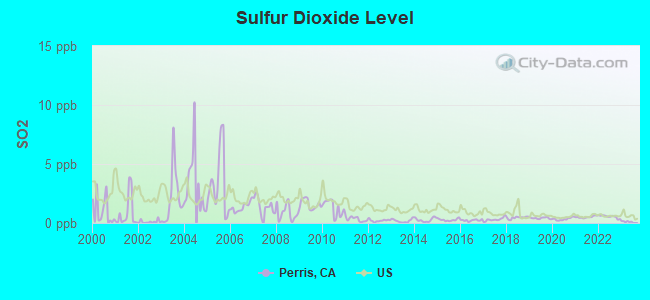
Sulfur Dioxide (SO2) [ppb] level in 2022 was 0.541. This is significantly better than average. Closest monitor was 14.5 miles away from the city center.
| City: | 0.541 |
| U.S.: | 1.515 |
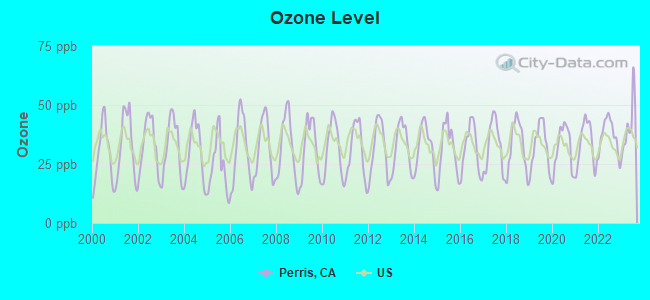
Ozone [ppb] level in 2023 was 41.2. This is worse than average. Closest monitor was 0.5 miles away from the city center.
| City: | 41.2 |
| U.S.: | 33.3 |
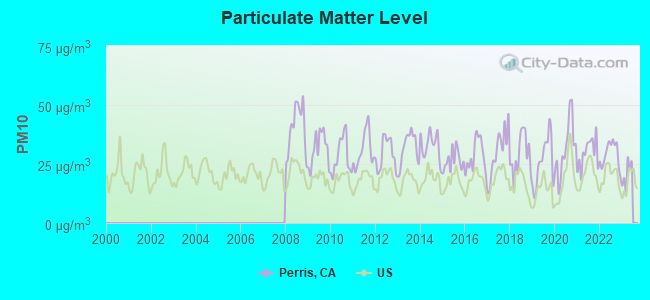
Particulate Matter (PM10) [µg/m3] level in 2022 was 29.1. This is significantly worse than average. Closest monitor was 0.5 miles away from the city center.
| City: | 29.1 |
| U.S.: | 19.2 |
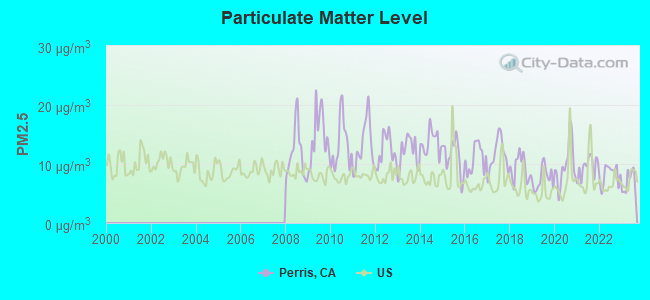
Particulate Matter (PM2.5) [µg/m3] level in 2023 was 6.94. This is about average. Closest monitor was 14.5 miles away from the city center.
| City: | 6.94 |
| U.S.: | 8.11 |
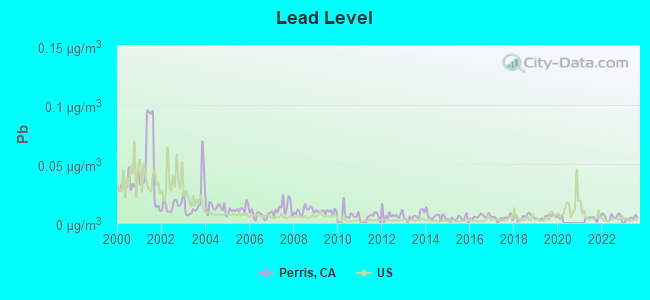
Lead (Pb) [µg/m3] level in 2023 was 0.00426. This is significantly better than average. Closest monitor was 0.5 miles away from the city center.
| City: | 0.00426 |
| U.S.: | 0.00931 |
Earthquake activity:
Perris-area historical earthquake activity is significantly above California state average. It is 7098% greater than the overall U.S. average.On 6/28/1992 at 11:57:34, a magnitude 7.6 (6.2 MB, 7.6 MS, 7.3 MW, Depth: 0.7 mi, Class: Major, Intensity: VIII - XII) earthquake occurred 47.9 miles away from Perris center, causing 3 deaths (1 shaking deaths, 2 other deaths) and 400 injuries, causing $100,000,000 total damage and $40,000,000 insured losses
On 7/21/1952 at 11:52:14, a magnitude 7.7 (7.7 UK) earthquake occurred 131.1 miles away from Perris center, causing $50,000,000 total damage
On 10/16/1999 at 09:46:44, a magnitude 7.4 (6.3 MB, 7.4 MS, 7.2 MW, 7.3 ML) earthquake occurred 67.2 miles away from Perris center
On 5/19/1940 at 04:36:40, a magnitude 7.2 (7.2 UK) earthquake occurred 96.6 miles away from the city center, causing $33,000,000 total damage
On 4/21/1918 at 22:32:30, a magnitude 6.8 (6.8 UK, Class: Strong, Intensity: VII - IX) earthquake occurred 12.4 miles away from Perris center
On 6/28/1992 at 15:05:30, a magnitude 6.9 (6.3 MB, 6.7 MS, 6.5 MW, 6.9 ME, Depth: 3.1 mi) earthquake occurred 41.3 miles away from the city center
Magnitude types: body-wave magnitude (MB), energy magnitude (ME), local magnitude (ML), surface-wave magnitude (MS), moment magnitude (MW)
Natural disasters:
The number of natural disasters in Riverside County (46) is a lot greater than the US average (15).Major Disasters (Presidential) Declared: 27
Emergencies Declared: 1
Causes of natural disasters: Fires: 22, Floods: 20, Storms: 8, Winter Storms: 8, Landslides: 6, Mudslides: 5, Heavy Rains: 2, Earthquake: 1, Flash Flood: 1, Freeze: 1, Hurricane: 1, Tornado: 1, Tropical Storm: 1, Other: 1 (Note: some incidents may be assigned to more than one category).
Main business address for: MODTECH HOLDINGS INC (PREFABRICATED WOOD BLDGS & COMPONENTS), NATIONAL RV HOLDINGS INC (MOTOR HOMES).
Hospitals and medical centers in Perris:
Other hospitals and medical centers near Perris:
- LIFE CARE CENTER OF MENIFEE (Nursing Home, about 6 miles away; SUN CITY, CA)
- SHEILA MARIE HOUSE (Hospital, about 6 miles away; MORENO VALLEY, CA)
- HOSPICE OF THE VALLEYS (Hospital, about 6 miles away; SUN CITY, CA)
- AFVW HEALTH CENTER (Nursing Home, about 7 miles away; RIVERSIDE, CA)
- KAISER FOUNDATION HOSPITAL-MORENO VALLEY Acute Care Hospitals (about 7 miles away; MORENO VALLEY, CA)
- RIVERSIDE COUNTY REGIONAL MEDICAL CENTER Acute Care Hospitals (about 8 miles away; MORENO VALLEY, CA)
- DAVITA-VALLEY VIEW DIALYSIS (Dialysis Facility, about 9 miles away; MORENO VALLEY, CA)
Airports located in Perris:
- Perris Valley Airport (L65) (Runways: 1, Itinerant Ops: 2,500, Local Ops: 25,000, Military Ops: 50)
Colleges/universities with over 2000 students nearest to Perris:
- Moreno Valley College (about 7 miles; Moreno Valley, CA; Full-time enrollment: 4,650)
- University of California-Riverside (about 14 miles; Riverside, CA; FT enrollment: 20,647)
- Mt San Jacinto Community College District (about 15 miles; San Jacinto, CA; FT enrollment: 8,426)
- California Baptist University (about 15 miles; Riverside, CA; FT enrollment: 6,085)
- Riverside City College (about 16 miles; Riverside, CA; FT enrollment: 10,661)
- La Sierra University (about 18 miles; Riverside, CA; FT enrollment: 2,205)
- Loma Linda University (about 18 miles; Loma Linda, CA; FT enrollment: 2,839)
Public high schools in Perris:
- PERRIS HIGH (Students: 1,698, Location: 175 E. NUEVO RD., Grades: 9-12)
- CITRUS HILL HIGH (Students: 1,303, Location: 18150 WOOD RD., Grades: 9-12)
- CALIFORNIA MILITARY INSTITUTE (Students: 338, Location: 755 N. A ST., Grades: 5-12, Charter school)
- VAL VERDE HIGH (Students: 145, Location: 972 W. MORGAN ST., Grades: 9-12)
- PERRIS LAKE HIGH (CONTINUATION) (Students: 76, Location: 418 W. ELLIS, Grades: 9-12)
- THE ACADEMY COMMUNITY DAY (Students: 70, Location: 515 E. SEVENTH ST., Grades: 7-12)
Private high schools in Perris:
Biggest public elementary/middle schools in Perris:
- PINACATE MIDDLE (Students: 1,232, Location: 1990 S. A ST., Grades: 7-8)
- TOMAS RIVERA MIDDLE (Students: 1,077, Location: 21675 MARTIN ST., Grades: 6-8)
- GOOD HOPE ELEMENTARY (Students: 548, Location: 24050 THEDA ST., Grades: KG-6)
- SKY VIEW ELEMENTARY (Students: 518, Location: 625 MILDRED ST., Grades: KG-6)
- VAL VERDE ELEMENTARY (Students: 465, Location: 2656 INDIAN AVE., Grades: KG-6)
- SIERRA VISTA ELEMENTARY (Students: 450, Location: 20300 SHERMAN RD., Grades: KG-6)
- TRIPLE CROWN ELEMENTARY (Students: 443, Location: 530 ORANGE AVE., Grades: KG-5)
- MEAD VALLEY ELEMENTARY (Students: 401, Location: 21-100 OLEANDER AVE., Grades: KG-5)
- AVALON ELEMENTARY (Students: 401, Location: 1815 E. RIDER ST., Grades: KG-5)
- ENCHANTED HILLS ELEMENTARY (Students: 381, Location: 1357 MT. BALDY ST., Grades: KG-6)
Private elementary/middle schools in Perris:
User-submitted facts and corrections:
- The Hospital has closed. The City of Perris does not have a hospital that is operating.
- Area code has changed to 951
- Churches: Calvary Chapel Perris Valley, www.ccpv.us, a non-denominational Christian fellowship
Points of interest:
Notable locations in Perris: Perris Valley Hot Air Ballooning and Parachute Center (A), McCanna Ranch (B), May Ranch (C), Figadota Farm (D), American Medical Response North Perris (E), County Rescue Ambulance Service (F), American Medical Response Perris (G), Val Verde School District Office (H), Perris City Hall (I), Perris Branch Riverside City and County Public Library (J), California Department of Forestry and Fire Protection Perris (K), Riverside County Fire Department Station 90 North Perris (L), Trolley Museum (M). Display/hide their locations on the map
Shopping Centers: Spectrum Shopping Center (1), Perris Town Center Shopping Center (2). Display/hide their locations on the map
Main business address in Perris include: MODTECH HOLDINGS INC (A), NATIONAL RV HOLDINGS INC (B). Display/hide their locations on the map
Churches in Perris include: Calvary Southern Baptist Church (A), Church of Christ (B), First Baptist Church (C), First Congregational Church (D), Saint James Catholic Church (E), Temple Christian Church (F). Display/hide their locations on the map
Cemetery: Perris Valley Cemetery (1). Display/hide its location on the map
Parks in Perris include: Banta Beatty Park (1), Motte Rimrock Reserve (2), Woodhaven Park (3), Roy W Kabian Memorial Park (4). Display/hide their locations on the map
Hotel: American Inn (1775 North Perris Boulevard) (1). Display/hide its approximate location on the map
Birthplace of: Andrew Green - College basketball player (Boise State Broncos), Dorothy Ford - Actor and model, Elmer Rieger - Baseball player.
| This city: | 4.2 people |
| California: | 2.9 people |
| This city: | 87.7% |
| Whole state: | 68.7% |
| This city: | 8.8% |
| Whole state: | 7.2% |
Likely homosexual households (counted as self-reported same-sex unmarried-partner households)
- Lesbian couples: 0.4% of all households
- Gay men: 0.3% of all households
People in group quarters in Perris in 2010:
- 109 people in other noninstitutional facilities
- 71 people in nursing facilities/skilled-nursing facilities
- 31 people in group homes intended for adults
- 26 people in group homes for juveniles (non-correctional)
- 3 people in residential treatment centers for juveniles (non-correctional)
People in group quarters in Perris in 2000:
- 105 people in nursing homes
- 60 people in other group homes
- 33 people in other noninstitutional group quarters
- 18 people in college dormitories (includes college quarters off campus)
- 10 people in homes or halfway houses for drug/alcohol abuse
- 6 people in short-term care, detention or diagnostic centers for delinquent children
Banks with branches in Perris (2011 data):
- Bank of America, National Association: Perris Crossing Branch at 3150 Case Road Building G, branch established on 2008/04/21; Perris Branch at 181 East 4th Street, branch established on 1947/12/01. Info updated 2009/11/18: Bank assets: $1,451,969.3 mil, Deposits: $1,077,176.8 mil, headquarters in Charlotte, NC, positive income, 5782 total offices, Holding Company: Bank Of America Corporation
- Wells Fargo Bank, National Association: Perris Branch at 2560 N Perris Blvd., branch established on 2002/11/18. Info updated 2011/04/05: Bank assets: $1,161,490.0 mil, Deposits: $905,653.0 mil, headquarters in Sioux Falls, SD, positive income, 6395 total offices, Holding Company: Wells Fargo & Company
- Compass Bank: Perris Branch at 211 East 4th Street, branch established on 1967/01/23. Info updated 2011/02/24: Bank assets: $63,107.0 mil, Deposits: $46,232.4 mil, headquarters in Birmingham, AL, negative income in the last year, Commercial Lending Specialization, 720 total offices, Holding Company: Banco Bilbao Vizcaya Argentaria, S.A.
For population 15 years and over in Perris:
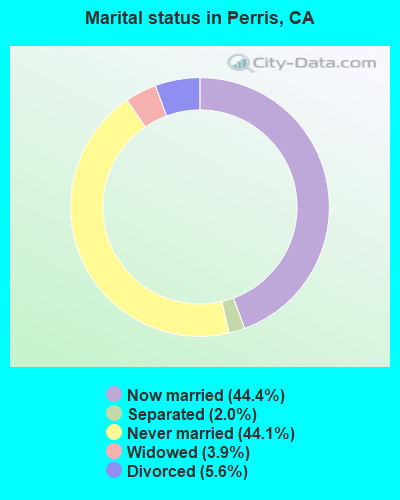
- Never married: 44.1%
- Now married: 44.4%
- Separated: 2.0%
- Widowed: 3.9%
- Divorced: 5.6%
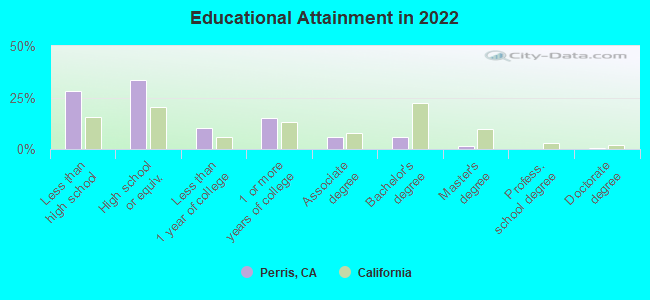
For population 25 years and over in Perris:
- High school or higher: 71.9%
- Bachelor's degree or higher: 7.8%
- Graduate or professional degree: 2.0%
- Unemployed: 11.6%
- Mean travel time to work (commute): 32.4 minutes
| Here: | 18.4 |
| California average: | 15.5 |


Graphs represent county-level data. Detailed 2008 Election Results
Religion statistics for Perris, CA (based on Riverside County data)


| Religion | Adherents | Congregations |
|---|---|---|
| Catholic | 602,765 | 51 |
| Evangelical Protestant | 240,306 | 741 |
| Other | 77,581 | 194 |
| Mainline Protestant | 29,535 | 103 |
| Black Protestant | 19,170 | 40 |
| Orthodox | 3,647 | 11 |
| None | 1,216,637 | - |
Food Environment Statistics:
| Riverside County: | 1.60 / 10,000 pop. |
| California: | 2.14 / 10,000 pop. |
| Here: | 0.05 / 10,000 pop. |
| California: | 0.04 / 10,000 pop. |
| This county: | 0.44 / 10,000 pop. |
| California: | 0.62 / 10,000 pop. |
| Riverside County: | 1.51 / 10,000 pop. |
| State: | 1.49 / 10,000 pop. |
| This county: | 5.45 / 10,000 pop. |
| California: | 7.42 / 10,000 pop. |
| Here: | 7.7% |
| State: | 7.3% |
| This county: | 24.5% |
| California: | 21.3% |
| Riverside County: | 15.2% |
| California: | 17.9% |
Health and Nutrition:
| Perris: | 45.8% |
| State: | 49.4% |
| Perris: | 45.4% |
| California: | 48.0% |
| Perris: | 28.6 |
| California: | 28.1 |
| Perris: | 23.0% |
| California: | 20.2% |
| Perris: | 10.3% |
| California: | 11.2% |
| Perris: | 6.7 |
| California: | 6.8 |
| This city: | 31.4% |
| California: | 31.5% |
| This city: | 54.0% |
| California: | 56.4% |
| Here: | 81.8% |
| California: | 80.9% |
More about Health and Nutrition of Perris, CA Residents
| Local government employment and payroll (March 2022) | |||||
| Function | Full-time employees | Monthly full-time payroll | Average yearly full-time wage | Part-time employees | Monthly part-time payroll |
|---|---|---|---|---|---|
| Other Government Administration | 38 | $341,076 | $107,708 | 2 | $2,534 |
| Streets and Highways | 28 | $158,692 | $68,011 | 0 | $0 |
| Housing and Community Development (Local) | 24 | $165,544 | $82,772 | 0 | $0 |
| Financial Administration | 17 | $113,811 | $80,337 | 0 | $0 |
| Other and Unallocable | 9 | $46,500 | $62,000 | 0 | $0 |
| Welfare | 9 | $64,381 | $85,841 | 0 | $0 |
| Totals for Government | 125 | $890,004 | $85,440 | 2 | $2,534 |
Perris government finances - Expenditure in 2017 (per resident):
- Construction - Housing and Community Development: $9,096,000 ($113.33)
Regular Highways: $2,362,000 ($29.43)
- Current Operations - Police Protection: $15,256,000 ($190.08)
Regular Highways: $6,402,000 ($79.76)
Central Staff Services: $6,294,000 ($78.42)
Local Fire Protection: $4,025,000 ($50.15)
Water Utilities: $3,231,000 ($40.26)
Parks and Recreation: $3,117,000 ($38.83)
Protective Inspection and Regulation - Other: $2,077,000 ($25.88)
General - Other: $1,949,000 ($24.28)
Sewerage: $1,883,000 ($23.46)
Housing and Community Development: $1,296,000 ($16.15)
Solid Waste Management: $1,172,000 ($14.60)
Health - Other: $821,000 ($10.23)
Financial Administration: $543,000 ($6.77)
- General - Interest on Debt: $7,007,000 ($87.30)
- Intergovernmental to Local - Other - Police Protection: $14,307,000 ($178.25)
Other - Local Fire Protection: $4,001,000 ($49.85)
Other - Water Utilities: $3,976,000 ($49.54)
Other - General - Other: $1,760,000 ($21.93)
- Other Capital Outlay - Regular Highways: $110,000 ($1.37)
Libraries: $86,000 ($1.07)
Central Staff Services: $17,000 ($0.21)
- Total Salaries and Wages: $76,000 ($0.95)
- Water Utilities - Interest on Debt: $329,000 ($4.10)
Perris government finances - Revenue in 2017 (per resident):
- Charges - Other: $4,334,000 ($54.00)
Sewerage: $2,038,000 ($25.39)
Regular Highways: $1,223,000 ($15.24)
Solid Waste Management: $1,185,000 ($14.76)
Parks and Recreation: $181,000 ($2.26)
- Federal Intergovernmental - Housing and Community Development: $815,000 ($10.15)
Other: $65,000 ($0.81)
- Local Intergovernmental - Other: $38,000 ($0.47)
- Miscellaneous - Interest Earnings: $7,141,000 ($88.97)
Donations From Private Sources: $6,593,000 ($82.14)
Special Assessments: $2,363,000 ($29.44)
Fines and Forfeits: $1,009,000 ($12.57)
General Revenue - Other: $260,000 ($3.24)
Sale of Property: $3,000 ($0.04)
- Revenue - Water Utilities: $3,612,000 ($45.00)
- State Intergovernmental - Other: $2,201,000 ($27.42)
Highways: $1,400,000 ($17.44)
General Local Government Support: $54,000 ($0.67)
- Tax - Property: $11,851,000 ($147.65)
General Sales and Gross Receipts: $11,630,000 ($144.90)
Other License: $2,773,000 ($34.55)
Public Utilities Sales: $2,496,000 ($31.10)
Documentary and Stock Transfer: $286,000 ($3.56)
Occupation and Business License - Other: $213,000 ($2.65)
Other Selective Sales: $115,000 ($1.43)
Perris government finances - Debt in 2017 (per resident):
- Long Term Debt - Beginning Outstanding - Unspecified Public Purpose: $319,099,000 ($3975.67)
Outstanding Unspecified Public Purpose: $311,030,000 ($3875.14)
Retired Unspecified Public Purpose: $13,431,000 ($167.34)
Issue, Unspecified Public Purpose: $5,361,000 ($66.79)
Perris government finances - Cash and Securities in 2017 (per resident):
- Bond Funds - Cash and Securities: $20,489,000 ($255.27)
- Other Funds - Cash and Securities: $107,315,000 ($1337.04)
- Sinking Funds - Cash and Securities: $124,601,000 ($1552.41)
7.19% of this county's 2021 resident taxpayers lived in other counties in 2020 ($71,521 average adjusted gross income)
| Here: | 7.19% |
| California average: | 5.19% |
0.03% of residents moved from foreign countries ($210 average AGI)
Riverside County: 0.03% California average: 0.03%
Top counties from which taxpayers relocated into this county between 2020 and 2021:
| from Los Angeles County, CA | |
| from San Bernardino County, CA | |
| from Orange County, CA |
6.28% of this county's 2020 resident taxpayers moved to other counties in 2021 ($64,593 average adjusted gross income)
| Here: | 6.28% |
| California average: | 6.14% |
0.02% of residents moved to foreign countries ($200 average AGI)
Riverside County: 0.02% California average: 0.02%
Top counties to which taxpayers relocated from this county between 2020 and 2021:
| to San Bernardino County, CA | |
| to Los Angeles County, CA | |
| to Orange County, CA |
| Businesses in Perris, CA | ||||
| Name | Count | Name | Count | |
|---|---|---|---|---|
| AutoZone | 2 | Kroger | 1 | |
| Baskin-Robbins | 1 | Little Caesars Pizza | 1 | |
| Burger King | 1 | McDonald's | 3 | |
| Carl\s Jr. | 2 | Nike | 1 | |
| Circle K | 4 | Papa John's Pizza | 1 | |
| DHL | 2 | Payless | 1 | |
| Dennys | 1 | Pizza Hut | 1 | |
| Domino's Pizza | 1 | Popeyes | 1 | |
| El Pollo Loco | 1 | RadioShack | 1 | |
| FedEx | 5 | Rite Aid | 1 | |
| GNC | 1 | Sprint Nextel | 1 | |
| H&R Block | 1 | Starbucks | 3 | |
| Holiday Inn | 1 | T-Mobile | 2 | |
| Home Depot | 1 | Taco Bell | 1 | |
| IHOP | 1 | U-Haul | 4 | |
| Jack In The Box | 3 | UPS | 3 | |
| Jones New York | 1 | Walgreens | 1 | |
| Just Tires | 2 | Walmart | 1 | |
Strongest AM radio stations in Perris:
- KPLS (830 AM; 50 kW; ORANGE, CA; Owner: CRN LICENSES, LLC)
- KFI (640 AM; 50 kW; LOS ANGELES, CA; Owner: CAPSTAR TX LIMITED PARTNERSHIP)
- KLAC (570 AM; 50 kW; LOS ANGELES, CA; Owner: AMFM RADIO LICENSES, L.L.C.)
- KHPY (1670 AM; 10 kW; MORENO VALLEY, CA; Owner: DELBERT L. VAN VOORHIS)
- KTNQ (1020 AM; 50 kW; LOS ANGELES, CA; Owner: KTNQ-AM LICENSE CORP.)
- KXTA (1150 AM; 50 kW; LOS ANGELES, CA; Owner: CITICASTERS LICENSES, L.P.)
- KDIS (1110 AM; 50 kW; PASADENA, CA; Owner: ABC,INC.)
- KPRO (1570 AM; 5 kW; RIVERSIDE, CA; Owner: OLIVE L. SHERBAN)
- KFWB (980 AM; 50 kW; LOS ANGELES, CA; Owner: INFINITY BROADCASTING OPERATIONS, INC.)
- KFMB (760 AM; 50 kW; SAN DIEGO, CA; Owner: MIDWEST TELEVISION, INC.)
- KSPN (710 AM; 50 kW; LOS ANGELES, CA; Owner: KABC-AM RADIO, INC.)
- KNX (1070 AM; 50 kW; LOS ANGELES, CA; Owner: INFINITY BROADCASTING OPERATIONS, INC.)
- KCAL (1410 AM; 5 kW; REDLANDS, CA; Owner: LAZER BROADCASTING CORPORATION)
Strongest FM radio stations in Perris:
- KOLA (99.9 FM; SAN BERNARDINO, CA; Owner: INLAND EMPIRE BROADCASTING CORP.)
- KVCR (91.9 FM; SAN BERNARDINO, CA; Owner: SAN BERNARDINO COMMUNITY COLLEGE DISTRICT)
- KUCR (88.3 FM; RIVERSIDE, CA; Owner: THE REGENTS OF THE UNIV. OF CA)
- KUOR-FM (89.1 FM; REDLANDS, CA; Owner: UNIVERSITY OF REDLANDS)
- KLRD (90.1 FM; YUCAIPA, CA; Owner: EDUCATIONAL MEDIA FOUNDATION)
- KRTM (88.9 FM; TEMECULA, CA; Owner: PENFOLD COMMUNICATIONS, INC.)
- KWRP (96.1 FM; SAN JACINTO, CA; Owner: MAGIC BROADCASTING, INC.)
- KPLM-FM2 (106.1 FM; SAN JACINTO, CA; Owner: RM BROADCASTING L.L.C.)
- KWVE (107.9 FM; SAN CLEMENTE, CA; Owner: CALVARY CHAPEL OF COSTA MESA)
- K201AR (88.1 FM; BANNING, CA; Owner: KSGN, INC.)
- K232CX (94.3 FM; DESERT HOT SPRINGS, CA; Owner: MCC RADIO, LLC)
- KCXX (103.9 FM; LAKE ARROWHEAD, CA; Owner: ALL-PRO BROADCASTING, INC.)
- KXFG (92.9 FM; SUN CITY, CA; Owner: INFINITY RADIO OPERATIONS INC.)
- K295AI (106.9 FM; MUSCOY, CA; Owner: ASSOCIATION FOR COMMUNITY EDUCATION, INC.)
- KXRS (105.7 FM; HEMET, CA; Owner: LAZER BROADCASTING CORPORATION)
- KATY-FM (101.3 FM; IDYLLWILD, CA; Owner: ALL PRO BROADCASTING, INC.)
- KGGI (99.1 FM; RIVERSIDE, CA; Owner: AMFM RADIO LICENSES, L.L.C.)
- KLYY (97.5 FM; RIVERSIDE, CA; Owner: ENTRAVISION HOLDINGS, LLC)
- K201CD (88.1 FM; VICTORVILLE, CA; Owner: SAN BERNARDINO COMMNTY COLLEGE DIST.)
- K264AF (100.7 FM; GUASTI, CA; Owner: EDUCATIONAL MEDIA FOUNDATION)
TV broadcast stations around Perris:
- KTRO-LP (Channel 50; LANCASTER, CA; Owner: ROBERT D. ADELMAN)
- KHIZ (Channel 64; BARSTOW, CA; Owner: SUNBELT TELEVISION, INC.)
- KVCR-TV (Channel 24; SAN BERNARDINO, CA; Owner: SAN BERNARDINO COMMUNITY COLLEGE DISTRICT)
- KBLM-LP (Channel 25; RIVERSIDE/PERRIS, CA; Owner: LOUIS MARTINEZ FAMILY GROUP, LLC)
- National Bridge Inventory (NBI) Statistics
- 40Number of bridges
- 482ft / 147mTotal length
- 1,659,472Total average daily traffic
- 168,949Total average daily truck traffic
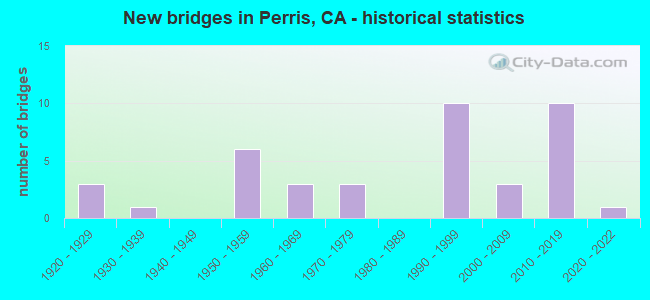
- New bridges - historical statistics
- 31920-1929
- 11930-1939
- 61950-1959
- 31960-1969
- 31970-1979
- 101990-1999
- 32000-2009
- 102010-2019
- 12020-2022
FCC Registered Private Land Mobile Towers: 1 (See the full list of FCC Registered Private Land Mobile Towers in Perris, CA)
FCC Registered Broadcast Land Mobile Towers: 60 (See the full list of FCC Registered Broadcast Land Mobile Towers)
FCC Registered Microwave Towers: 80 (See the full list of FCC Registered Microwave Towers in this town)
FCC Registered Maritime Coast & Aviation Ground Towers: 1 (See the full list of FCC Registered Maritime Coast & Aviation Ground Towers)
FCC Registered Amateur Radio Licenses: 280 (See the full list of FCC Registered Amateur Radio Licenses in Perris)
FAA Registered Aircraft: 53 (See the full list of FAA Registered Aircraft in Perris)
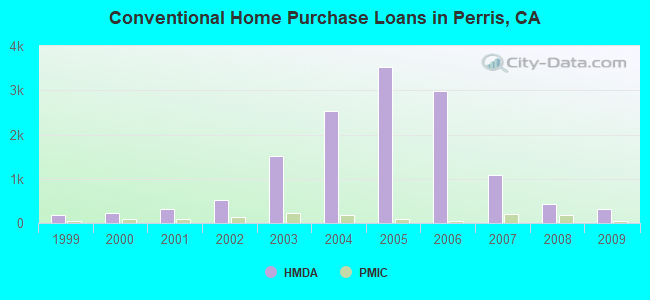
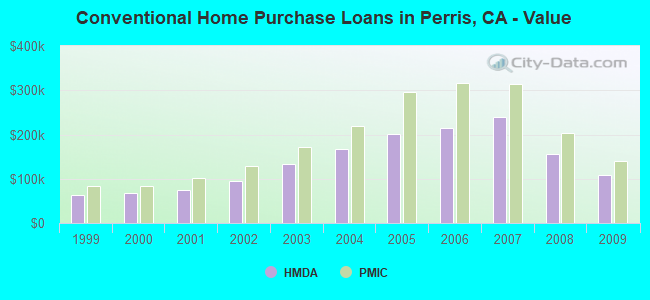
| Home Mortgage Disclosure Act Aggregated Statistics For Year 2009 (Based on 2 full and 6 partial tracts) | ||||||||||||||
| A) FHA, FSA/RHS & VA Home Purchase Loans | B) Conventional Home Purchase Loans | C) Refinancings | D) Home Improvement Loans | E) Loans on Dwellings For 5+ Families | F) Non-occupant Loans on < 5 Family Dwellings (A B C & D) | G) Loans On Manufactured Home Dwelling (A B C & D) | ||||||||
|---|---|---|---|---|---|---|---|---|---|---|---|---|---|---|
| Number | Average Value | Number | Average Value | Number | Average Value | Number | Average Value | Number | Average Value | Number | Average Value | Number | Average Value | |
| LOANS ORIGINATED | 1,004 | $149,307 | 314 | $108,209 | 276 | $172,349 | 12 | $38,894 | 0 | $0 | 154 | $90,919 | 23 | $145,681 |
| APPLICATIONS APPROVED, NOT ACCEPTED | 96 | $147,256 | 48 | $125,141 | 64 | $173,569 | 4 | $69,870 | 0 | $0 | 20 | $101,596 | 3 | $126,023 |
| APPLICATIONS DENIED | 224 | $154,449 | 118 | $117,232 | 191 | $168,893 | 28 | $55,323 | 0 | $0 | 55 | $105,487 | 17 | $135,361 |
| APPLICATIONS WITHDRAWN | 162 | $154,216 | 76 | $107,695 | 103 | $180,141 | 9 | $41,292 | 2 | $5,427,675 | 42 | $94,857 | 7 | $130,039 |
| FILES CLOSED FOR INCOMPLETENESS | 36 | $156,616 | 18 | $137,864 | 36 | $171,206 | 2 | $105,625 | 0 | $0 | 8 | $105,011 | 4 | $154,145 |
Detailed HMDA statistics for the following Tracts: 0426.02 , 0426.03, 0427.06, 0427.18, 0427.19, 0428.00, 0429.01, 0429.04
| Private Mortgage Insurance Companies Aggregated Statistics For Year 2009 (Based on 2 full and 6 partial tracts) | ||||||
| A) Conventional Home Purchase Loans | B) Refinancings | C) Non-occupant Loans on < 5 Family Dwellings (A & B) | ||||
|---|---|---|---|---|---|---|
| Number | Average Value | Number | Average Value | Number | Average Value | |
| LOANS ORIGINATED | 50 | $139,632 | 0 | $0 | 0 | $0 |
| APPLICATIONS APPROVED, NOT ACCEPTED | 36 | $174,442 | 4 | $217,395 | 1 | $250,370 |
| APPLICATIONS DENIED | 10 | $145,570 | 1 | $79,840 | 0 | $0 |
| APPLICATIONS WITHDRAWN | 6 | $167,230 | 0 | $0 | 0 | $0 |
| FILES CLOSED FOR INCOMPLETENESS | 6 | $205,053 | 0 | $0 | 0 | $0 |
Detailed PMIC statistics for the following Tracts: 0426.02 , 0426.03, 0427.06, 0427.18, 0427.19, 0428.00, 0429.01, 0429.04
2006 - 2018 National Fire Incident Reporting System (NFIRS) incidents
- Fire incident types reported to NFIRS in Perris, CA
- 15261.5%Outside Fires
- 4819.4%Mobile Property/Vehicle Fires
- 3915.8%Structure Fires
- 83.2%Other
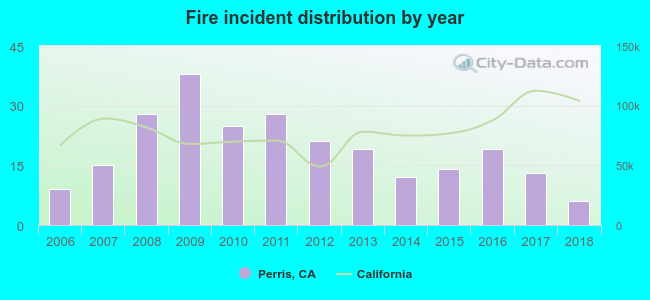 Based on the data from the years 2006 - 2018 the average number of fires per year is 19. The highest number of reported fire incidents - 38 took place in 2009, and the least - 6 in 2018. The data has a decreasing trend.
 When looking into fire subcategories, the most reports belonged to: Outside Fires (61.5%), and Mobile Property/Vehicle Fires (19.4%).
| Most common first names in Perris, CA among deceased individuals | ||
| Name | Count | Lived (average) |
|---|---|---|
| Robert | 85 | 72.4 years |
| John | 84 | 75.1 years |
| Mary | 80 | 79.2 years |
| William | 74 | 73.2 years |
| James | 71 | 70.1 years |
| Charles | 52 | 70.8 years |
| Richard | 49 | 65.9 years |
| Jose | 45 | 70.0 years |
| Maria | 43 | 74.9 years |
| Donald | 39 | 68.7 years |
| Most common last names in Perris, CA among deceased individuals | ||
| Last name | Count | Lived (average) |
|---|---|---|
| Williams | 48 | 72.1 years |
| Johnson | 46 | 72.0 years |
| Jones | 40 | 73.6 years |
| Smith | 36 | 76.5 years |
| Brown | 35 | 74.7 years |
| Lopez | 27 | 65.9 years |
| Hernandez | 25 | 67.6 years |
| Rodriguez | 23 | 67.4 years |
| Davis | 23 | 72.3 years |
| Jackson | 23 | 69.9 years |
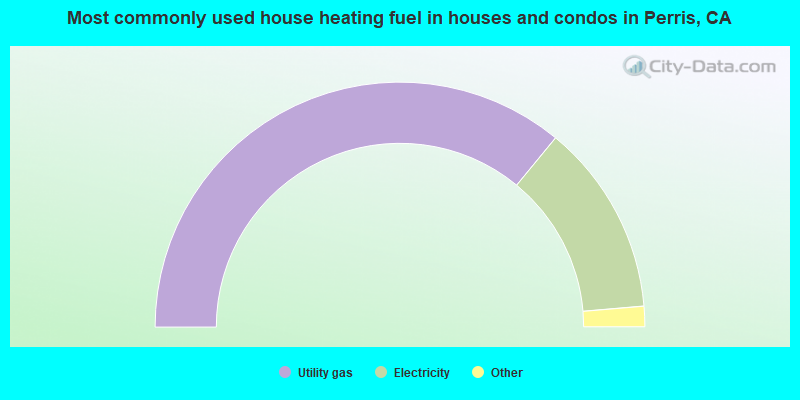
- 72.0%Utility gas
- 25.4%Electricity
- 1.2%No fuel used
- 1.0%Bottled, tank, or LP gas
- 0.4%Solar energy
- 59.7%Utility gas
- 31.0%Electricity
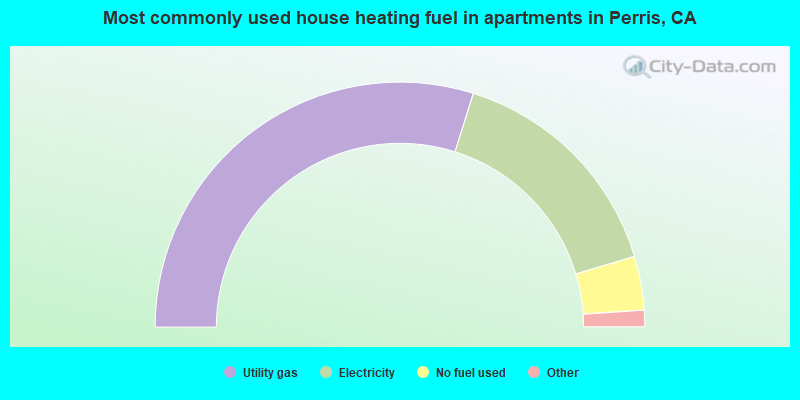
- 7.1%No fuel used
- 2.1%Bottled, tank, or LP gas
- 0.1%Solar energy
Perris compared to California state average:
- Median house value below state average.
- Black race population percentage significantly above state average.
- Hispanic race population percentage significantly above state average.
- Median age below state average.
- Foreign-born population percentage significantly above state average.
- Length of stay since moving in below state average.
- House age significantly below state average.
- Number of college students above state average.
- Percentage of population with a bachelor's degree or higher significantly below state average.
Perris on our top lists:
- #2 on the list of "Top 101 cities with largest percentage of females in industries: transportation and warehousing (population 50,000+)"
- #4 on the list of "Top 101 cities with largest percentage of females in industries: construction (population 50,000+)"
- #7 on the list of "Top 101 cities with largest percentage of females in occupations: material moving occupations (population 50,000+)"
- #8 on the list of "Top 101 cities with largest percentage of males in occupations: building and grounds cleaning and maintenance occupations (population 50,000+)"
- #8 on the list of "Top 101 cities with the largest differences between daily high and daily low temperatures (population 50,000+)"
- #12 on the list of "Top 101 cities with the highest number of auto thefts per 100,000 residents, excludes tourist destinations and others with a lot of outsiders visiting based on city industries data (population 50,000+)"
- #15 on the list of "Top 100 cities with longest commuting times (pop. 50,000+)"
- #20 on the list of "Top 100 cities with youngest residents (pop. 50,000+)"
- #23 on the list of "Top 101 cities with largest percentage of males in occupations: transportation occupations (population 50,000+)"
- #23 on the list of "Top 100 least-educated cities (pop. 50,000+)"
- #25 on the list of "Top 101 cities with largest percentage of males in occupations: material moving occupations (population 50,000+)"
- #25 on the list of "Top 101 cities with the largest percentage population increase from 2000 (population 50,000+)"
- #26 on the list of "Top 101 cities with largest percentage of females in occupations: construction and extraction occupations (population 50,000+)"
- #26 on the list of "Top 101 cities with largest percentage of males in occupations: health technologists and technicians (population 50,000+)"
- #28 on the list of "Top 101 cities with largest percentage of males in industries: construction (population 50,000+)"
- #32 on the list of "Top 101 cities with largest percentage of males in industries: transportation and warehousing (population 50,000+)"
- #35 on the list of "Top 101 cities with largest percentage of females in industries: other services, except public administration (population 50,000+)"
- #35 on the list of "Top 101 cities with largest percentage of males in industries: agriculture, forestry, fishing and hunting (population 50,000+)"
- #36 on the list of "Top 101 cities with the least people having Master's or Doctorate degrees (population 50,000+)"
- #38 on the list of "Top 101 cities with largest percentage of females in occupations: sales and related occupations (population 50,000+)"
- #32 (92571) on the list of "Top 101 zip codes with the lowest 2012 average taxable interest for individuals (pop 5,000+)"
- #3 on the list of "Top 101 counties with the highest lead air pollution readings in 2012 (µg/m3)"
- #4 on the list of "Top 101 counties with the highest ground withdrawal of fresh water for public supply"
- #11 on the list of "Top 101 counties with the most Catholic adherents"
- #11 on the list of "Top 101 counties with the highest total withdrawal of fresh water for public supply"
- #12 on the list of "Top 101 counties with the highest carbon monoxide air pollution readings in 2012 (ppm)"

|
|
Total of 110 patent applications in 2008-2024.