Estimated zip code population in 2022: 59,398 Zip code population in 2010: 52,516 Zip code population in 2000: 26,355
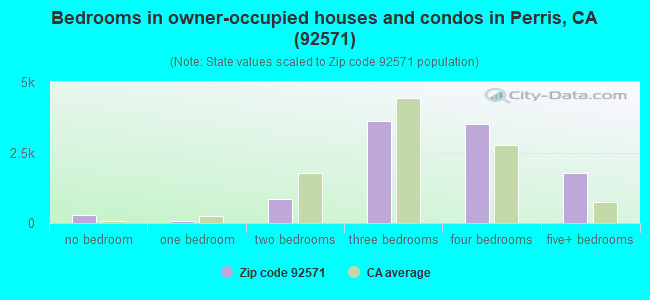
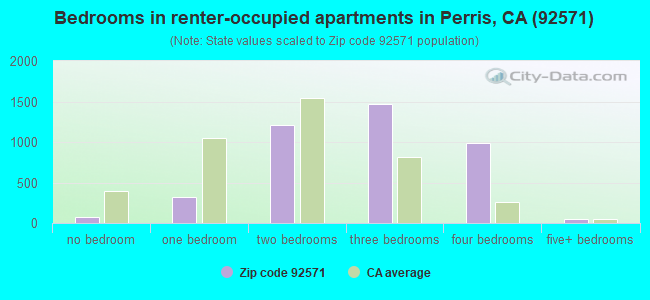
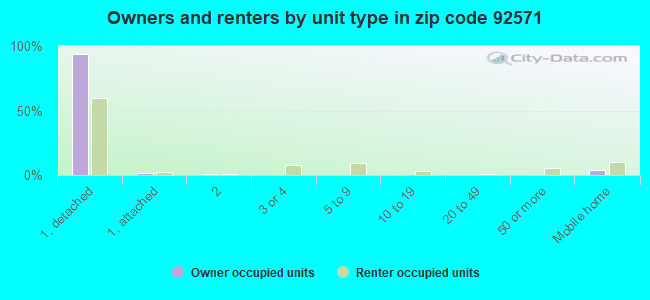
Houses and condos: 14,634 Renter-occupied apartments: 4,115
% of renters here:
29%
State:
44%
March 2022 cost of living index in zip code 92571: 81.8 (low, U.S. average is 100)
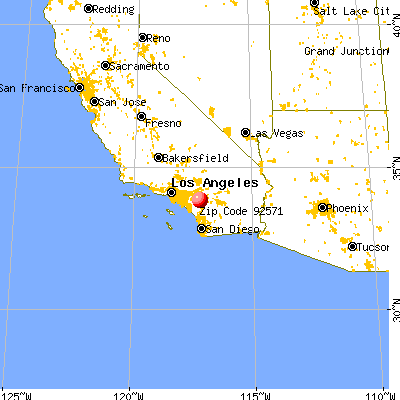
Land area: 22.6 sq. mi. Water area: 0.3 sq. mi.
Population density: 2,633 people per square mile
(average).
OSM Map
General Map
Google Map
MSN Map
OSM Map
General Map
Google Map
MSN Map
OSM Map
General Map
Google Map
MSN Map
OSM Map
General Map
Google Map
MSN Map
Please wait while loading the map...
Real estate property taxes paid for housing units in 2022:
This zip code:
1.0% ($3,977)
California:
0.7% ($4,831)
Median real estate property taxes paid for housing units with mortgages in 2022: $4,198 (1.0%) Median real estate property taxes paid for housing units with no mortgage in 2022: $3,433 (0.8%)
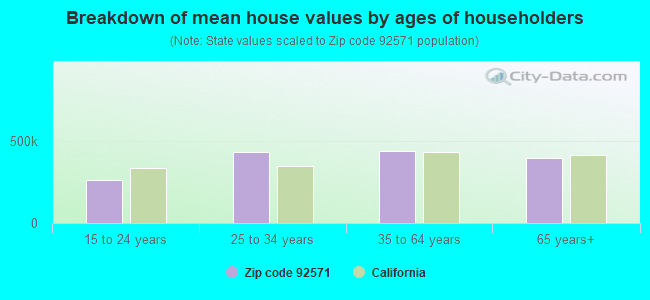
Estimated median house/condo value in 2022: $415,337
92571:
$415,337
California:
$715,900
According to our research of California and other state lists, there were 64 registered sex offenders living in 92571 zip code as of April 27, 2024. The ratio of all residents to sex offenders in zip code 92571 is 864 to 1. The ratio of registered sex offenders to all residents in this zip code is near the state average.
Median resident age:
This zip code:
30.4 years
California median age:
37.9 years
Average household size:
This zip code:
4.2 people
California:
2.8 people
Averages for the 2020 tax year for zip code 92571, filed in 2021:
Average Adjusted Gross Income (AGI) in 2020: $45,101 (Individual Income Tax Returns)
Here:
$45,101
State:
$95,910
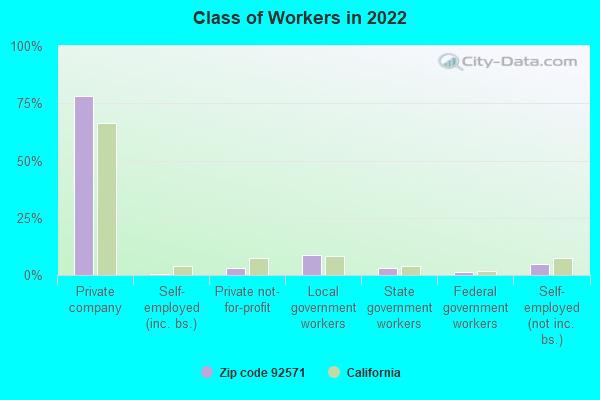
Salary/wage: $42,963 (reported on 88.6% of returns)
Here:
$42,963
State:
$77,331
(% of AGI for various income ranges: 1210.4% for AGIs below $25k, 3930.5% for AGIs $25k-50k, 7558.0% for AGIs $50k-75k, 11277.2% for AGIs $75k-100k, 20048.5% for AGIs $100k-200k, 70755.0% for AGIs over 200k)
Taxable interest for individuals: $171 (reported on 22.6% of returns)
This zip code:
$171
California:
$2,294
(% of AGI for various income ranges: 2.2% for AGIs below $25k, 2.6% for AGIs $25k-50k, 6.0% for AGIs $50k-75k, 16.0% for AGIs $75k-100k, 17.6% for AGIs $100k-200k, 135.0% for AGIs over 200k)
Ordinary dividends: $523 (reported on 2.9% of returns)
Here:
$523
State:
$10,949
(% of AGI for various income ranges: 1.3% for AGIs below $25k, 0.8% for AGIs $25k-50k, 2.9% for AGIs $50k-75k, 3.0% for AGIs $75k-100k, 10.0% for AGIs $100k-200k, 32.5% for AGIs over 200k)
Net capital gain/loss in AGI: +$4,468 (reported on 4.2% of returns)
Here:
+$4,468
State:
+$49,306
(% of AGI for various income ranges: 0.8% for AGIs below $25k, 2.3% for AGIs $25k-50k, 11.0% for AGIs $50k-75k, 39.4% for AGIs $75k-100k, 179.0% for AGIs $100k-200k, 4607.5% for AGIs over 200k)
Profit/loss from business: +$7,519 (reported on 15.8% of returns)
Here:
+$7,519
State:
+$15,671
(% of AGI for various income ranges: 149.7% for AGIs below $25k, 149.2% for AGIs $25k-50k, 179.1% for AGIs $50k-75k, 171.7% for AGIs $75k-100k, 175.4% for AGIs $100k-200k, 917.5% for AGIs over 200k)
Taxable individual retirement arrangement distribution: $11,907 (reported on 1.1% of returns)
92571:
$11,907
California:
$23,505
(% of AGI for various income ranges: 5.0% for AGIs below $25k, 8.0% for AGIs $25k-50k, 19.7% for AGIs $50k-75k, 47.5% for AGIs $75k-100k, 122.2% for AGIs $100k-200k)
Total itemized deductions: $27,075 (reported on 9.2% of returns)
Here:
$27,075
State:
$39,517
(% of AGI for various income ranges: 27.4% for AGIs below $25k, 159.5% for AGIs $25k-50k, 547.1% for AGIs $50k-75k, 957.3% for AGIs $75k-100k, 1703.3% for AGIs $100k-200k, 6965.0% for AGIs over 200k)
Charity contributions: $5,132 (reported on 7.2% of returns)
Here:
$5,132
State:
$12,598
(% of AGI for various income ranges: 1.8% for AGIs below $25k, 19.1% for AGIs $25k-50k, 66.8% for AGIs $50k-75k, 137.3% for AGIs $75k-100k, 332.5% for AGIs $100k-200k, 1367.5% for AGIs over 200k)
Taxes paid: $8,046 (reported on 9.2% of returns)
92571:
$8,046
State:
$8,807
(% of AGI for various income ranges: 7.5% for AGIs below $25k, 41.6% for AGIs $25k-50k, 165.3% for AGIs $50k-75k, 303.5% for AGIs $75k-100k, 520.6% for AGIs $100k-200k, 1595.0% for AGIs over 200k)
Earned income credit: $2,445 (reported on 24.4% of returns)
Here:
$2,445
State:
$2,074
(% of AGI for various income ranges: 124.6% for AGIs below $25k, 99.0% for AGIs $25k-50k, 2.1% for AGIs $50k-75k)
Percentage of individuals using paid preparers for their 2020 taxes: 93.3%
Here:
93%
State:
92%
(% for various income ranges: 92.5% for AGIs below $25k, 93.4% for AGIs $25k-50k, 94.0% for AGIs $50k-75k, 93.6% for AGIs $75k-100k, 94.4% for AGIs $100k-200k, 92.9% for AGIs over 200k)
Averages for the 2012 tax year for zip code 92571, filed in 2013:
Average Adjusted Gross Income (AGI) in 2012: $35,392 (Individual Income Tax Returns)
Here:
$35,392
State:
$72,726
Salary/wage: $34,716 (reported on 89.1% of returns)
Here:
$34,716
State:
$59,079
(% of AGI for various income ranges: 77.6% for AGIs below $25k, 89.4% for AGIs $25k-50k, 91.6% for AGIs $50k-75k, 90.7% for AGIs $75k-100k, 87.8% for AGIs $100k-200k, 47.3% for AGIs over 200k)
Taxable interest for individuals: $170 (reported on 21.5% of returns)
This zip code:
$170
California:
$2,146
(% of AGI for various income ranges: 0.1% for AGIs $50k-75k, 0.2% for AGIs $100k-200k)
Ordinary dividends: $502 (reported on 2.6% of returns)
Here:
$502
State:
$9,308
Net capital gain/loss in AGI: +$813 (reported on 2.4% of returns)
Here:
+$813
State:
+$30,460
(% of AGI for various income ranges: 0.7% for AGIs $100k-200k)
Profit/loss from business: +$8,777 (reported on 16.7% of returns)
Here:
+$8,777
State:
+$17,064
(% of AGI for various income ranges: 13.8% for AGIs below $25k, 3.8% for AGIs $25k-50k, 1.1% for AGIs $50k-75k, 0.8% for AGIs $75k-100k, 0.9% for AGIs $100k-200k)
Taxable individual retirement arrangement distribution: $10,659 (reported on 1.7% of returns)
92571:
$10,659
California:
$19,557
(% of AGI for various income ranges: 0.4% for AGIs below $25k, 0.3% for AGIs $25k-50k, 0.5% for AGIs $50k-75k, 0.6% for AGIs $75k-100k, 1.0% for AGIs $100k-200k)
Total itemized deductions: $20,078 (33% of AGI, reported on 30.2% of returns)
Here:
$20,078
State:
$34,004
Here:
33.4% of AGI
State:
22.7% of AGI
(% of AGI for various income ranges: 6.5% for AGIs below $25k, 16.0% for AGIs $25k-50k, 21.1% for AGIs $50k-75k, 21.7% for AGIs $75k-100k, 22.4% for AGIs $100k-200k, 19.2% for AGIs over 200k)
Charity contributions: $2,190 (reported on 22.0% of returns)
Here:
$2,190
State:
$4,659
(% of AGI for various income ranges: 0.3% for AGIs below $25k, 1.1% for AGIs $25k-50k, 1.7% for AGIs $50k-75k, 1.8% for AGIs $75k-100k, 2.5% for AGIs $100k-200k)
Taxes paid: $5,545 (reported on 30.1% of returns)
92571:
$5,545
State:
$14,448
(% of AGI for various income ranges: 1.5% for AGIs below $25k, 3.8% for AGIs $25k-50k, 5.8% for AGIs $50k-75k, 6.6% for AGIs $75k-100k, 7.3% for AGIs $100k-200k, 8.4% for AGIs over 200k)
Earned income credit: $2,744 (reported on 37.0% of returns)
Here:
$2,744
State:
$2,286
(% of AGI for various income ranges: 11.7% for AGIs below $25k, 2.5% for AGIs $25k-50k)
Percentage of individuals using paid preparers for their 2012 taxes: 72.5%
Here:
73%
State:
64%
(% for various income ranges: 69.6% for AGIs below $25k, 75.6% for AGIs $25k-50k, 76.0% for AGIs $50k-75k, 72.0% for AGIs $75k-100k, 73.0% for AGIs $100k-200k)
Averages for the 2004 tax year for zip code 92571, filed in 2005:
Average Adjusted Gross Income (AGI) in 2004: $35,229 (Individual Income Tax Returns)
Here:
$35,229
State:
$58,600
Salary/wage: $34,125 (reported on 92.9% of returns)
Here:
$34,125
State:
$49,455
(% of AGI for various income ranges: 90.8% for AGIs below $10k, 87.2% for AGIs $10k-25k, 93.0% for AGIs $25k-50k, 93.9% for AGIs $50k-75k, 92.3% for AGIs $75k-100k, 69.2% for AGIs over 100k)
Taxable interest for individuals: $395 (reported on 29.5% of returns)
This zip code:
$395
California:
$2,365
(% of AGI for various income ranges: 0.7% for AGIs below $10k, 0.3% for AGIs $10k-25k, 0.3% for AGIs $25k-50k, 0.3% for AGIs $50k-75k, 0.2% for AGIs $75k-100k, 0.8% for AGIs over 100k)
Taxable dividends: $573 (reported on 4.3% of returns)
Here:
$573
State:
$4,746
(% of AGI for various income ranges: 0.1% for AGIs below $10k, 0.1% for AGIs $10k-25k, 0.1% for AGIs $25k-50k, 0.0% for AGIs $50k-75k, 0.1% for AGIs $75k-100k, 0.1% for AGIs over 100k)
Net capital gain/loss: +$8,734 (reported on 4.4% of returns)
Here:
+$8,734
State:
+$23,418
(% of AGI for various income ranges: -0.5% for AGIs below $10k, -0.0% for AGIs $10k-25k, 0.3% for AGIs $25k-50k, 0.3% for AGIs $50k-75k, 0.8% for AGIs $75k-100k, 8.6% for AGIs over 100k)
Profit/loss from business: +$7,205 (reported on 13.0% of returns)
Here:
+$7,205
State:
+$16,826
(% of AGI for various income ranges: 8.5% for AGIs below $10k, 7.3% for AGIs $10k-25k, 2.4% for AGIs $25k-50k, 1.1% for AGIs $50k-75k, 1.3% for AGIs $75k-100k, 1.7% for AGIs over 100k)
IRA payment deduction: $2,032 (reported on 1.0% of returns)
92571:
$2,032
California:
$3,192
(% of AGI for various income ranges: 0.1% for AGIs $10k-25k, 0.1% for AGIs $25k-50k, 0.0% for AGIs $50k-75k, 0.1% for AGIs $75k-100k)
Total itemized deductions: $19,349 (36% of AGI, reported on 41.8% of returns)
Here:
$19,349
State:
$28,113
Here:
36.3% of AGI
State:
25.3% of AGI
(% of AGI for various income ranges: 8.6% for AGIs below $10k, 13.2% for AGIs $10k-25k, 24.0% for AGIs $25k-50k, 27.6% for AGIs $50k-75k, 25.2% for AGIs $75k-100k, 20.7% for AGIs over 100k)
Charity contributions deductions: $2,085 (4% of AGI, reported on 34.3% of returns)
Here:
$2,085
State:
$3,923
Here:
3.7% of AGI
State:
3.3% of AGI
(% of AGI for various income ranges: 0.3% for AGIs below $10k, 0.9% for AGIs $10k-25k, 1.9% for AGIs $25k-50k, 2.4% for AGIs $50k-75k, 2.7% for AGIs $75k-100k, 2.5% for AGIs over 100k)
Total tax: $3,184 (reported on 60.3% of returns)
92571:
$3,184
State:
$10,761
(% of AGI for various income ranges: 2.7% for AGIs below $10k, 3.1% for AGIs $10k-25k, 3.4% for AGIs $25k-50k, 5.1% for AGIs $50k-75k, 7.7% for AGIs $75k-100k, 14.7% for AGIs over 100k)
Earned income credit: $1,984 (reported on 27.7% of returns)
Here:
$1,984
State:
$1,763
Percentage of individuals using paid preparers for their 2004 taxes: 74.8%
Here:
75%
State:
66%
(% for various income ranges: 65.5% for AGIs below $10k, 77.2% for AGIs $10k-25k, 76.7% for AGIs $25k-50k, 76.0% for AGIs $50k-75k, 73.2% for AGIs $75k-100k, 73.8% for AGIs over 100k)
Household received Food Stamps/SNAP in the past 12 months: 2,664 Household did not receive Food Stamps/SNAP in the past 12 months: 11,596
Women who had a birth in the past 12 months: 830 (476 now married, 355 unmarried) Women who did not have a birth in the past 12 months: 14,538 (6,538 now married, 7,967 unmarried)
Housing units in zip code 92571 with a mortgage: 7,064 (414 second mortgage, 312 both second mortgage and home equity loan) Houses without a mortgage: 70
Median monthly owner costs for units with a mortgage: $1,989 Median monthly owner costs for units without a mortgage: $705
Residents with income below the poverty level in 2022:
This zip code:
12.3%
Whole state:
12.2%
Residents with income below 50% of the poverty level in 2022:
This zip code:
7.4%
Whole state:
6.2%
Median number of rooms in houses and condos:
Here:
6.2
State:
6.0
Median number of rooms in apartments:
Here:
4.4
State:
3.9
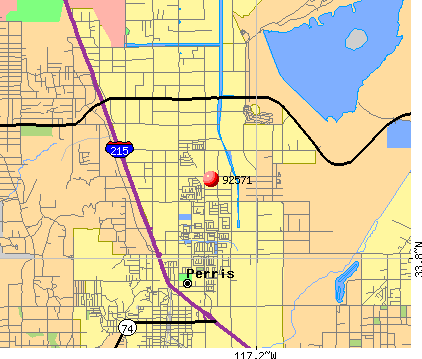
Notable locations in this zip code not listed on our city pages
Notable locations in zip code 92571: McCanna Ranch (A), May Ranch (B), Figadota Farm (C), American Medical Response North Perris (D), County Rescue Ambulance Service (E), Yai Heki Regional Indian Museum (F), Val Verde School District Office (G), Riverside County Fire Department Station 90 North Perris (H). Display/hide their locations on the map
11,156 married couples with children.
4,076 single-parent households (1,036 men, 3,040 women).
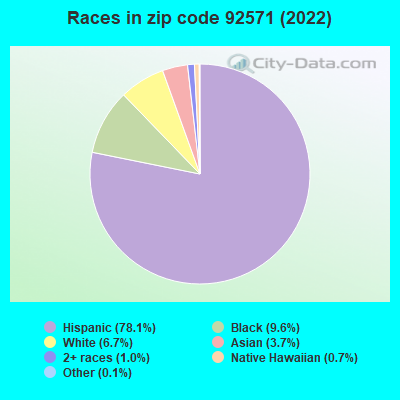
34.0% of residents of 92571 zip code speak English at home.
61.8% of residents speak Spanish at home (67% very well, 14% well, 11% not well, 8% not at all).
0.6% of residents speak other Indo-European language at home (63% very well, 21% well, 9% not well, 8% not at all).
2.8% of residents speak Asian or Pacific Island language at home (50% very well, 27% well, 17% not well, 6% not at all).
0.3% of residents speak other language at home (91% very well, 4% well, 4% not well).
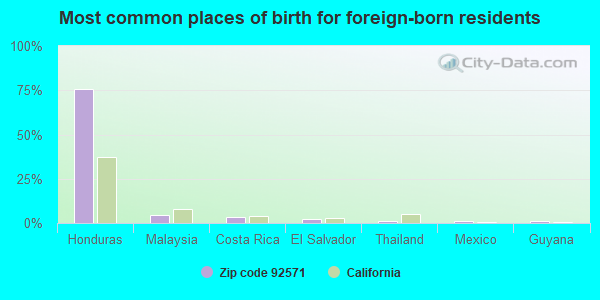
Foreign born population: 17,810 (30.0%) (54.2% of them are naturalized citizens)
This zip code:
30.0%
Whole state:
26.7%
76%Honduras
4%Malaysia
4%Costa Rica
3%El Salvador
1%Thailand
1%Mexico
1%Guyana
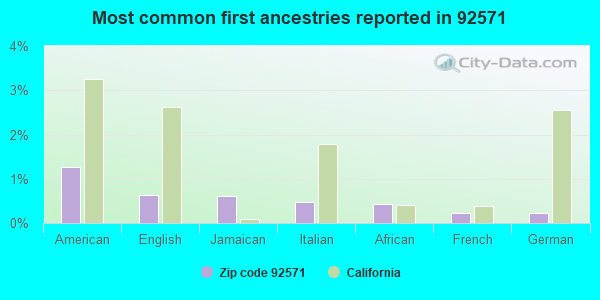
1%American
1%English
1%Jamaican
0%Italian
0%African
0%French
0%German
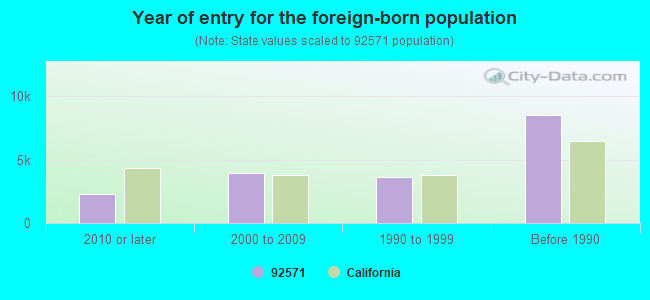
Year of entry for the foreign-born population
2,2642010 or later
3,9822000 to 2009
3,6251990 to 1999
8,520Before 1990
Facilities with environmental interests located in this zip code:
MODTECH INCORPORATED (195 EAST MORGAN STREET in PERRIS, CA)
AIR MAJOR (AIRS/AFS) STATE MASTER (California - Hazardous Waste Tracking) - HAZARDOU WASTE PROGRAM CRITERIA AND HAZARDOUS AIR POLLUTANT INVENTORY (Inventory of air pollution sources) Large Quantity Generators, more that 1000 kg of hazardous waste/month (Resource Conservation and Recovery Act (tracking hazardous waste)) Business SIC classification: PREFABRICATED WOOD BUILDINGS AND COMPONENTS Organizations: MODTECH HOLDINGS INC (CONTACT/OPERATOR)
, BMG2 (CONTACT/OWNER)
LOWES HOME IMPROVEMENT WAREHOUSE 966 (3984 INDIAN AVE in PERRIS, CA)
STATE MASTER (California - Hazardous Waste Tracking) - HAZARDOU WASTE PROGRAM Small Quantity Generators, between 100 kg and 1000 kg of hazardous waste/month (Resource Conservation and Recovery Act (tracking hazardous waste)) - notification Organizations: LOWES HIW (CONTACT/OPERATOR)
Alternative names: LOWES HIW 966
NORTH ORANGE COAST PAINTING (RAMONA EXPY 1 MI E OF HWY 215 in PERRIS, CA)
STATE MASTER (California - Hazardous Waste Tracking) - HAZARDOU WASTE PROGRAM Small Quantity Generators, between 100 kg and 1000 kg of hazardous waste/month (Resource Conservation and Recovery Act (tracking hazardous waste)) - notification
MIKE PRECIE DAIRY (2575 MURRIETA ROAD in PERRIS, CA)
EXXON MOBIL OIL COPR (3995 N PERRIS BLVD in PERRIS, CA)
HAZARDOUS WASTE BIENNIAL REPORTER (Resource Conservation and Recovery Act (tracking hazardous waste)) Large Quantity Generators, more that 1000 kg of hazardous waste/month (Resource Conservation and Recovery Act (tracking hazardous waste))
EASTERN MWD, PERRIS VALLEY (PERRIS VALLEY in PERRIS, CA)
National Pollutant Discharge Elimination System NON-MAJOR (Tracking pollutant discharge elimination systems) - permit Business SIC classification: SEWERAGE SYSTEMS Alternative names: EASTERN MWD/PERRIS VALLEY RWRF
ECONO LUBE N TUNE 97 (2309 N PERRIS BLVD in PERRIS, CA)
Small Quantity Generators, between 100 kg and 1000 kg of hazardous waste/month (Resource Conservation and Recovery Act (tracking hazardous waste)) - notification Organizations: KIHO JEON (CONTACT/OWNER)
EMPIRE TRACTOR CO (1480 NANDINA AVE in PERRIS, CA)
Small Quantity Generators, between 100 kg and 1000 kg of hazardous waste/month (Resource Conservation and Recovery Act (tracking hazardous waste)) - notification
GOLDEN WEST HOMES (3100 N. PERRIS BLVD. in PERRIS, CA)
CRITERIA AND HAZARDOUS AIR POLLUTANT INVENTORY (Inventory of air pollution sources) TRI REPORTER (Tracking of toxic chemicals releasing facilities) Business SIC classification: MOBILE HOMES
KMART PERRIS (681 JACINTO RD in PERRIS, CA)
Small Quantity Generators, between 100 kg and 1000 kg of hazardous waste/month (Resource Conservation and Recovery Act (tracking hazardous waste)) - notification Organizations: KMART INTERNATIONAL HEADQUARTERS (CONTACT/OWNER)
NATIONAL R V INC (100 W SINCLAIR ST in PERRIS, CA)
Small Quantity Generators, between 100 kg and 1000 kg of hazardous waste/month (Resource Conservation and Recovery Act (tracking hazardous waste)) - notification
GREAT WESTERN METALS (23450 MARKHAM ST in PERRIS, CA)
COMPLIANCE ACTIVITY (Tracking inspections of insecticide, fungicide, and rodenticide, and toxic substances) Business SIC classification: JEWELRY, PRECIOUS METAL
Housing units lacking complete plumbing facilities: 0.3% Housing units lacking complete kitchen facilities: 0.8%
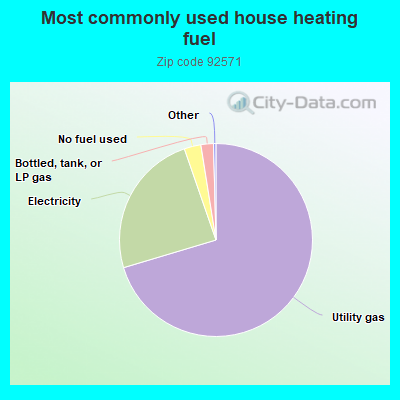
70.3%Utility gas
24.3%Electricity
2.8%No fuel used
2.1%Bottled, tank, or LP gas
Population in 1990: 12,436. Population change in the 1990s: +13,919 (+111.9%).
Place of birth for U.S.-born residents:
This state: 37,665
Northeast: 764
Midwest: 646
South: 875
West: 877
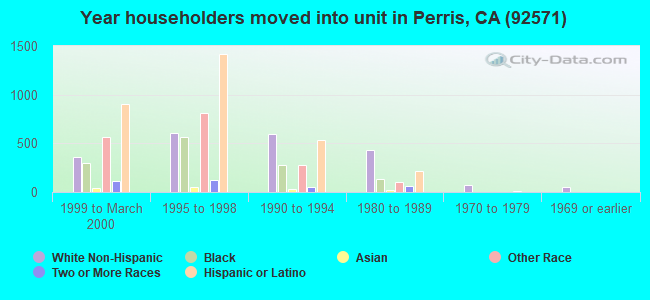
43% of the 92571 zip code residents lived in the same house 5 years ago. Out of people who lived in different houses, 60% lived in this county. Out of people who lived in different counties, 50% lived in California.
94% of the 92571 zip code residents lived in the same house 1 year ago. Out of people who lived in different houses, 35% moved from this county. Out of people who lived in different houses, 64% moved from different county within same state. Out of people who lived in different houses, 2% moved from different state. Out of people who lived in different houses, 4% moved from abroad.
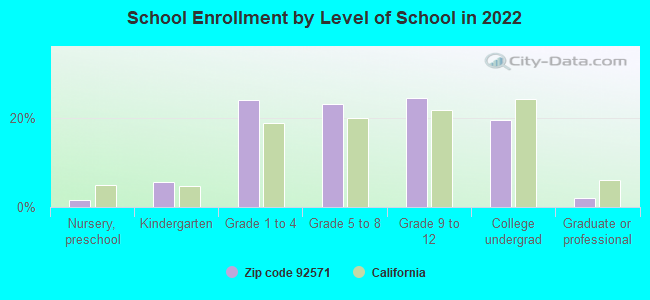
Private vs. public school enrollment:
Students in private schools in grades 1 to 8 (elementary and middle school): 263
Here:
3.3%
California:
10.5%
Students in private schools in grades 9 to 12 (high school): 297
Here:
7.2%
California:
8.5%
Students in private undergraduate colleges: 609
Here:
18.6%
California:
15.9%
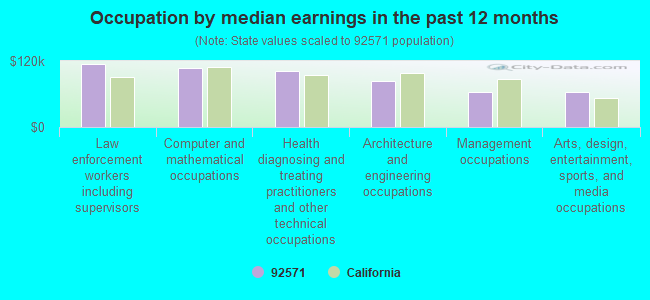
Occupation by median earnings in the past 12 months ($)
114,116Law enforcement workers including supervisors
106,490Computer and mathematical occupations
101,911Health diagnosing and treating practitioners and other technical occupations
83,686Architecture and engineering occupations
64,096Management occupations
63,635Arts, design, entertainment, sports, and media occupations
Companies with federal contracts located in this zip code (PERRIS, CA):
VALLEY RESOURCE CENTER FOR THE (3519 N PERRIS BLVD) : $766,323 in 14 contractsfrom 1999 to 2005
Contracts for Trash/Garbage Collection Services - Including Portable Sanitation Services, Custodial Janitorial Services by Air Force, U.S. Fish and Wildlife Service Signed by year:2000: $76,644; 2001: $107,859; 2002: $106,500; 2003: $127,606; 2004: $134,907; 2005: $155,534; 2006: $0.
Biggest contracts:
$155,534 with Air Force for Trash/Garbage Collection Services - Including Portable Sanitation Services. Signed on 2005-10-01. Completion date: 2006-09-30.
$134,907, same as above.Signed on 2004-10-12. Completion date: 2005-09-30.
$123,411, same as above.Signed on 2003-10-17. Completion date: 2004-09-30.
$106,500, same as above.Signed on 2002-10-01. Completion date: 2003-09-30.
SQUARE ONE PARACHUTES, INC (425 W RIDER ST STE B7; small business) : $232,778 in 6 contractsfrom 1999 to 2006
Contracts for Parachutes; Aerial Pick Up, Delivery, Recovery Systems; and Cargo Tie Down Equipment, Miscellaneous Items by Air Force, Army Signed by year:2000: $31,391; 2001: $0; 2002: $63,750; 2003: $0; 2004: $0; 2005: $85,979; 2006: $10,850.
Biggest contracts:
$63,750 with Air Force for Parachutes; Aerial Pick Up, Delivery, Recovery Systems; and Cargo Tie Down Equipment. Signed on 2002-02-11. Completion date: 2002-04-01.
$58,500, same as above.Signed on 2005-08-23. Completion date: 2006-01-30.
$40,808, same as above.Signed on 1999-12-09. Completion date: 2000-02-18.
$31,391 with Army for Miscellaneous Items. Signed on 2000-09-22. Completion date: 2000-12-15.
BLUE STEEL COMPANY INC (425 W RIDER ST STE C6; small business) : $227,038 in 9 contractsfrom 2004 to 2006
Contracts for Plate, Sheet, Strip, and Foil; Nonferrous Base Metal, Structural Shapes, Miscellaneous Machine Tools, Miscellaneous Secondary Metal Forming and Cutting Machines, and moreby Air Force, Navy Signed by year:2000: $0; 2001: $0; 2002: $0; 2003: $0; 2004: $59,268; 2005: $71,257; 2006: $96,513.
Biggest contracts:
$96,513 with Air Force for Plate, Sheet, Strip, and Foil; Nonferrous Base Metal. Signed on 2006-03-31. Completion date: 2006-04-03.
$59,268 with Navy for Plate, Sheet, Strip, and Foil; Nonferrous Base Metal. Signed on 2004-11-30. Completion date: 2005-01-14.
$19,756 with Air Force for Structural Shapes. Taking place in AZ. Signed on 2005-03-25. Completion date: 2005-03-30.
$14,495 with Navy for Miscellaneous Machine Tools. Signed on 2005-12-28. Completion date: 2006-01-10.
DAMON C BOTTOMS (1661 BELLA REGINA WAY; small business)
$14,300 with Navy for Individual Equipment. Signed on 2004-11-22. Completion date: 2004-12-31.
Top industries in this zip code by the number of employees in 2005:
Management of Companies and Enterprises: Corporate, Subsidiary, and Regional Managing Offices (500-999 employees: 1 establishment, 100-249 employees: 1 establishment)
Real Estate and Rental and Leasing: Offices of Real Estate Agents and Brokers (500-999: 1, 1-4: 3)
2006 - 2018 National Fire Incident Reporting System (NFIRS) incidents
Based on the data from the years 2006 - 2018 the average number of fire incidents per year is 66. The highest number of fires - 87 took place in 2008, and the least - 17 in 2006. The data has an increasing trend.
When looking into fire subcategories, the most incidents belonged to: Outside Fires (49.9%), and Mobile Property/Vehicle Fires (24.6%).
Fire incident types reported to NFIRS in Zip Code 92571


 Nearest zip codes: 92551, 92585, 92518, 92553, 92567, 92555.


 Based on the data from the years 2006 - 2018 the average number of fire incidents per year is 66. The highest number of fires - 87 took place in 2008, and the least - 17 in 2006. The data has an increasing trend.
 When looking into fire subcategories, the most incidents belonged to: Outside Fires (49.9%), and Mobile Property/Vehicle Fires (24.6%).