Estimated zip code population in 2022: 26,858 Zip code population in 2010: 17,797 Zip code population in 2000: 8,674
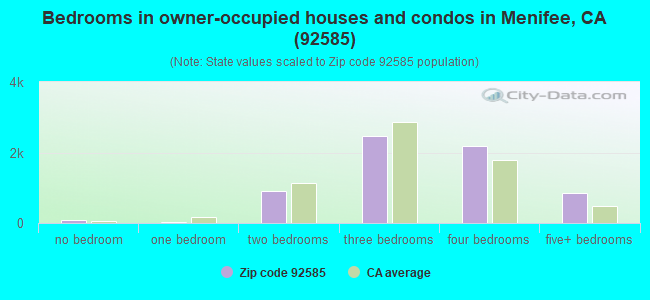
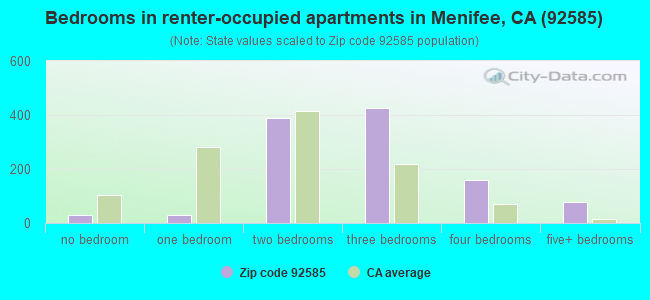
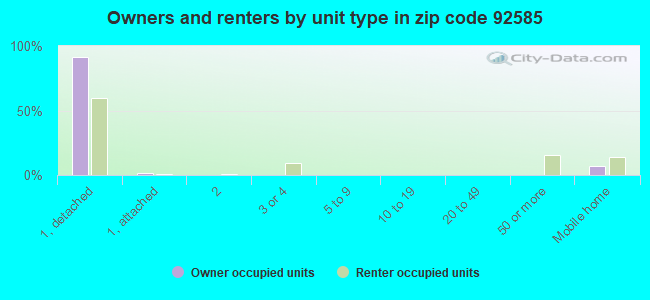
Houses and condos: 7,880 Renter-occupied apartments: 1,105
% of renters here:
15%
State:
44%
March 2022 cost of living index in zip code 92585: 82.0 (low, U.S. average is 100)
Land area: 20.3 sq. mi. Water area: 0.0 sq. mi.
Population density: 1,323 people per square mile
(low).
OSM Map
General Map
Google Map
MSN Map
OSM Map
General Map
Google Map
MSN Map
OSM Map
General Map
Google Map
MSN Map
OSM Map
General Map
Google Map
MSN Map
Please wait while loading the map...
Real estate property taxes paid for housing units in 2022:
This zip code:
1.2% ($5,613)
California:
0.7% ($4,831)
Median real estate property taxes paid for housing units with mortgages in 2022: $6,444 (1.3%) Median real estate property taxes paid for housing units with no mortgage in 2022: $3,274 (0.7%)
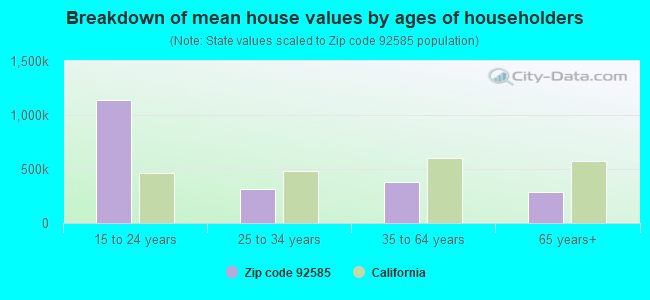
Estimated median house/condo value in 2022: $485,483
92585:
$485,483
California:
$715,900
According to our research of California and other state lists, there were 26 registered sex offenders living in 92585 zip code as of April 26, 2024. The ratio of all residents to sex offenders in zip code 92585 is 847 to 1. The ratio of registered sex offenders to all residents in this zip code is near the state average.
Median resident age:
This zip code:
35.6 years
California median age:
37.9 years
Average household size:
This zip code:
3.5 people
California:
2.8 people
Averages for the 2020 tax year for zip code 92585, filed in 2021:
Average Adjusted Gross Income (AGI) in 2020: $60,994 (Individual Income Tax Returns)
Here:
$60,994
State:
$95,910
Salary/wage: $58,098 (reported on 83.3% of returns)
Here:
$58,098
State:
$77,331
(% of AGI for various income ranges: 1154.7% for AGIs below $25k, 3727.9% for AGIs $25k-50k, 7104.9% for AGIs $50k-75k, 10213.7% for AGIs $75k-100k, 20332.5% for AGIs $100k-200k, 58141.0% for AGIs over 200k)
Taxable interest for individuals: $367 (reported on 35.6% of returns)
This zip code:
$367
California:
$2,294
(% of AGI for various income ranges: 10.4% for AGIs below $25k, 8.3% for AGIs $25k-50k, 23.6% for AGIs $50k-75k, 19.5% for AGIs $75k-100k, 46.4% for AGIs $100k-200k, 119.0% for AGIs over 200k)
Ordinary dividends: $1,872 (reported on 8.0% of returns)
Here:
$1,872
State:
$10,949
(% of AGI for various income ranges: 7.2% for AGIs below $25k, 12.1% for AGIs $25k-50k, 24.8% for AGIs $50k-75k, 25.2% for AGIs $75k-100k, 47.2% for AGIs $100k-200k, 276.0% for AGIs over 200k)
Net capital gain/loss in AGI: +$7,720 (reported on 10.2% of returns)
Here:
+$7,720
State:
+$49,306
(% of AGI for various income ranges: 3.8% for AGIs below $25k, 11.7% for AGIs $25k-50k, 44.1% for AGIs $50k-75k, 43.7% for AGIs $75k-100k, 250.5% for AGIs $100k-200k, 5345.0% for AGIs over 200k)
Profit/loss from business: +$7,352 (reported on 16.4% of returns)
Here:
+$7,352
State:
+$15,671
(% of AGI for various income ranges: 116.1% for AGIs below $25k, 119.2% for AGIs $25k-50k, 182.9% for AGIs $50k-75k, 176.4% for AGIs $75k-100k, 216.8% for AGIs $100k-200k, 2390.0% for AGIs over 200k)
Taxable individual retirement arrangement distribution: $17,062 (reported on 5.3% of returns)
92585:
$17,062
California:
$23,505
(% of AGI for various income ranges: 32.2% for AGIs below $25k, 59.4% for AGIs $25k-50k, 137.5% for AGIs $50k-75k, 180.0% for AGIs $75k-100k, 346.5% for AGIs $100k-200k, 1384.0% for AGIs over 200k)
Total itemized deductions: $29,152 (reported on 16.9% of returns)
Here:
$29,152
State:
$39,517
(% of AGI for various income ranges: 66.1% for AGIs below $25k, 253.8% for AGIs $25k-50k, 794.3% for AGIs $50k-75k, 1210.1% for AGIs $75k-100k, 2139.4% for AGIs $100k-200k, 6871.0% for AGIs over 200k)
Charity contributions: $5,415 (reported on 13.8% of returns)
Here:
$5,415
State:
$12,598
(% of AGI for various income ranges: 4.4% for AGIs below $25k, 22.2% for AGIs $25k-50k, 93.2% for AGIs $50k-75k, 138.1% for AGIs $75k-100k, 389.5% for AGIs $100k-200k, 1601.0% for AGIs over 200k)
Taxes paid: $8,726 (reported on 16.9% of returns)
92585:
$8,726
State:
$8,807
(% of AGI for various income ranges: 16.3% for AGIs below $25k, 66.3% for AGIs $25k-50k, 229.9% for AGIs $50k-75k, 392.5% for AGIs $75k-100k, 667.0% for AGIs $100k-200k, 1896.0% for AGIs over 200k)
Earned income credit: $2,208 (reported on 15.8% of returns)
Here:
$2,208
State:
$2,074
(% of AGI for various income ranges: 93.6% for AGIs below $25k, 75.8% for AGIs $25k-50k, 1.5% for AGIs $50k-75k)
Percentage of individuals using paid preparers for their 2020 taxes: 93.6%
Here:
94%
State:
92%
(% for various income ranges: 92.4% for AGIs below $25k, 94.2% for AGIs $25k-50k, 92.9% for AGIs $50k-75k, 94.0% for AGIs $75k-100k, 95.0% for AGIs $100k-200k, 96.7% for AGIs over 200k)
Averages for the 2012 tax year for zip code 92585, filed in 2013:
Average Adjusted Gross Income (AGI) in 2012: $48,660 (Individual Income Tax Returns)
Here:
$48,660
State:
$72,726
Salary/wage: $47,029 (reported on 83.0% of returns)
Here:
$47,029
State:
$59,079
(% of AGI for various income ranges: 70.8% for AGIs below $25k, 79.1% for AGIs $25k-50k, 82.1% for AGIs $50k-75k, 84.3% for AGIs $75k-100k, 84.2% for AGIs $100k-200k, 58.2% for AGIs over 200k)
Taxable interest for individuals: $459 (reported on 36.1% of returns)
This zip code:
$459
California:
$2,146
(% of AGI for various income ranges: 0.9% for AGIs below $25k, 0.3% for AGIs $25k-50k, 0.2% for AGIs $50k-75k, 0.3% for AGIs $75k-100k, 0.3% for AGIs $100k-200k, 0.2% for AGIs over 200k)
Ordinary dividends: $2,172 (reported on 9.2% of returns)
Here:
$2,172
State:
$9,308
(% of AGI for various income ranges: 0.7% for AGIs below $25k, 0.5% for AGIs $25k-50k, 0.3% for AGIs $50k-75k, 0.4% for AGIs $75k-100k, 0.2% for AGIs $100k-200k, 1.0% for AGIs over 200k)
Net capital gain/loss in AGI: +$2,473 (reported on 8.1% of returns)
Here:
+$2,473
State:
+$30,460
(% of AGI for various income ranges: 0.1% for AGIs $50k-75k, 0.2% for AGIs $75k-100k, 0.3% for AGIs $100k-200k, 5.9% for AGIs over 200k)
Profit/loss from business: +$8,208 (reported on 15.9% of returns)
Here:
+$8,208
State:
+$17,064
(% of AGI for various income ranges: 10.8% for AGIs below $25k, 3.9% for AGIs $25k-50k, 1.4% for AGIs $50k-75k, 1.5% for AGIs $75k-100k, 1.2% for AGIs $100k-200k)
Taxable individual retirement arrangement distribution: $12,810 (reported on 7.4% of returns)
92585:
$12,810
California:
$19,557
(% of AGI for various income ranges: 2.6% for AGIs below $25k, 2.1% for AGIs $25k-50k, 2.0% for AGIs $50k-75k, 1.6% for AGIs $75k-100k, 2.2% for AGIs $100k-200k)
Total itemized deductions: $22,868 (30% of AGI, reported on 41.9% of returns)
Here:
$22,868
State:
$34,004
Here:
29.6% of AGI
State:
22.7% of AGI
(% of AGI for various income ranges: 11.9% for AGIs below $25k, 17.3% for AGIs $25k-50k, 21.5% for AGIs $50k-75k, 22.1% for AGIs $75k-100k, 21.7% for AGIs $100k-200k, 17.4% for AGIs over 200k)
Charity contributions: $2,595 (reported on 33.1% of returns)
Here:
$2,595
State:
$4,659
(% of AGI for various income ranges: 0.6% for AGIs below $25k, 1.3% for AGIs $25k-50k, 1.8% for AGIs $50k-75k, 1.9% for AGIs $75k-100k, 2.0% for AGIs $100k-200k, 3.6% for AGIs over 200k)
Taxes paid: $7,212 (reported on 41.8% of returns)
92585:
$7,212
State:
$14,448
(% of AGI for various income ranges: 2.7% for AGIs below $25k, 4.3% for AGIs $25k-50k, 6.1% for AGIs $50k-75k, 7.1% for AGIs $75k-100k, 7.8% for AGIs $100k-200k, 8.4% for AGIs over 200k)
Earned income credit: $2,475 (reported on 21.7% of returns)
Here:
$2,475
State:
$2,286
(% of AGI for various income ranges: 7.9% for AGIs below $25k, 1.7% for AGIs $25k-50k)
Percentage of individuals using paid preparers for their 2012 taxes: 65.6%
Here:
66%
State:
64%
(% for various income ranges: 62.5% for AGIs below $25k, 66.3% for AGIs $25k-50k, 66.2% for AGIs $50k-75k, 66.7% for AGIs $75k-100k, 72.5% for AGIs $100k-200k, 71.4% for AGIs over 200k)
Averages for the 2004 tax year for zip code 92585, filed in 2005:
Average Adjusted Gross Income (AGI) in 2004: $40,191 (Individual Income Tax Returns)
Here:
$40,191
State:
$58,600
Salary/wage: $38,695 (reported on 81.1% of returns)
Here:
$38,695
State:
$49,455
(% of AGI for various income ranges: 113.7% for AGIs below $10k, 67.0% for AGIs $10k-25k, 80.5% for AGIs $25k-50k, 84.1% for AGIs $50k-75k, 85.9% for AGIs $75k-100k, 65.4% for AGIs over 100k)
Taxable interest for individuals: $988 (reported on 44.4% of returns)
This zip code:
$988
California:
$2,365
(% of AGI for various income ranges: 5.9% for AGIs below $10k, 2.4% for AGIs $10k-25k, 1.1% for AGIs $25k-50k, 0.8% for AGIs $50k-75k, 0.6% for AGIs $75k-100k, 0.7% for AGIs over 100k)
Taxable dividends: $1,643 (reported on 13.3% of returns)
Here:
$1,643
State:
$4,746
(% of AGI for various income ranges: 3.3% for AGIs below $10k, 1.3% for AGIs $10k-25k, 0.5% for AGIs $25k-50k, 0.5% for AGIs $50k-75k, 0.1% for AGIs $75k-100k, 0.4% for AGIs over 100k)
Net capital gain/loss: +$10,316 (reported on 12.6% of returns)
Here:
+$10,316
State:
+$23,418
(% of AGI for various income ranges: -3.2% for AGIs below $10k, -0.3% for AGIs $10k-25k, 0.1% for AGIs $25k-50k, 1.0% for AGIs $50k-75k, 2.3% for AGIs $75k-100k, 12.9% for AGIs over 100k)
Profit/loss from business: +$9,256 (reported on 16.1% of returns)
Here:
+$9,256
State:
+$16,826
(% of AGI for various income ranges: 4.2% for AGIs below $10k, 9.2% for AGIs $10k-25k, 3.5% for AGIs $25k-50k, 1.1% for AGIs $50k-75k, 2.4% for AGIs $75k-100k, 5.1% for AGIs over 100k)
IRA payment deduction: $2,918 (reported on 1.6% of returns)
92585:
$2,918
California:
$3,192
Total itemized deductions: $20,229 (33% of AGI, reported on 44.5% of returns)
Here:
$20,229
State:
$28,113
Here:
33.1% of AGI
State:
25.3% of AGI
(% of AGI for various income ranges: 28.2% for AGIs below $10k, 16.2% for AGIs $10k-25k, 22.1% for AGIs $25k-50k, 24.9% for AGIs $50k-75k, 25.1% for AGIs $75k-100k, 20.6% for AGIs over 100k)
Charity contributions deductions: $2,163 (3% of AGI, reported on 37.9% of returns)
Here:
$2,163
State:
$3,923
Here:
3.4% of AGI
State:
3.3% of AGI
(% of AGI for various income ranges: 1.0% for AGIs below $10k, 1.3% for AGIs $10k-25k, 1.9% for AGIs $25k-50k, 2.3% for AGIs $50k-75k, 2.6% for AGIs $75k-100k, 2.0% for AGIs over 100k)
Total tax: $4,384 (reported on 70.7% of returns)
92585:
$4,384
State:
$10,761
(% of AGI for various income ranges: 4.1% for AGIs below $10k, 3.9% for AGIs $10k-25k, 5.0% for AGIs $25k-50k, 6.8% for AGIs $50k-75k, 8.6% for AGIs $75k-100k, 13.9% for AGIs over 100k)
Earned income credit: $1,849 (reported on 16.5% of returns)
Here:
$1,849
State:
$1,763
Percentage of individuals using paid preparers for their 2004 taxes: 70.4%
Here:
70%
State:
66%
(% for various income ranges: 60.9% for AGIs below $10k, 68.6% for AGIs $10k-25k, 73.1% for AGIs $25k-50k, 73.3% for AGIs $50k-75k, 71.9% for AGIs $75k-100k, 82.5% for AGIs over 100k)
Likely homosexual households (counted as self-reported same-sex unmarried-partner households)
Lesbian couples: 0.8% of all households
Gay men: 0.0% of all households
Household received Food Stamps/SNAP in the past 12 months: 797 Household did not receive Food Stamps/SNAP in the past 12 months: 6,745
Women who had a birth in the past 12 months: 206 (177 now married, 28 unmarried) Women who did not have a birth in the past 12 months: 6,400 (2,932 now married, 3,451 unmarried)
Housing units in zip code 92585 with a mortgage: 4,814 (201 second mortgage, 3 home equity loan, 180 both second mortgage and home equity loan) Houses without a mortgage: 24
Median monthly owner costs for units with a mortgage: $2,511 Median monthly owner costs for units without a mortgage: $585
Residents with income below the poverty level in 2022:
This zip code:
10.8%
Whole state:
12.2%
Residents with income below 50% of the poverty level in 2022:
This zip code:
6.5%
Whole state:
6.2%
Median number of rooms in houses and condos:
Here:
6.4
State:
6.0
Median number of rooms in apartments:
Here:
5.2
State:
3.9
Notable locations in this zip code not listed on our city pages
In group quarters: 12 (-1 institutionalized population)
Size of family households: 2,028 2-persons, 1,104 3-persons, 1,127 4-persons, 979 5-persons, 632 6-persons, 477 7-or-more-persons
Size of nonfamily households: 862 1-person, 291 2-persons, 24 3-persons
4,301 married couples with children.
1,402 single-parent households (219 men, 1,183 women).
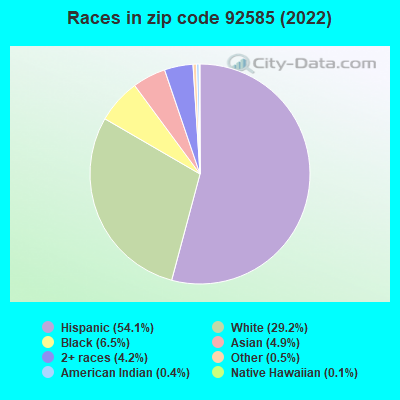
57.3% of residents of 92585 zip code speak English at home.
37.2% of residents speak Spanish at home (68% very well, 17% well, 12% not well, 3% not at all).
0.8% of residents speak other Indo-European language at home (61% very well, 25% well, 5% not well, 9% not at all).
3.4% of residents speak Asian or Pacific Island language at home (62% very well, 25% well, 13% not well).
1.1% of residents speak other language at home (95% very well, 5% well).
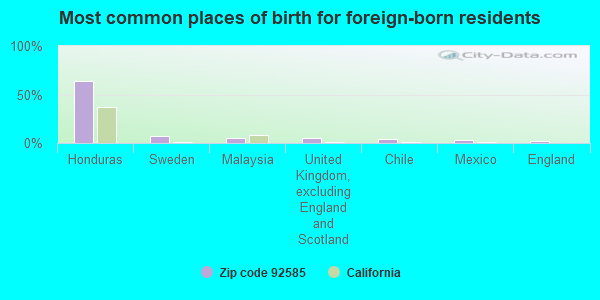
Foreign born population: 5,608 (20.9%) (58.5% of them are naturalized citizens)
This zip code:
20.9%
Whole state:
26.7%
64%Honduras
7%Sweden
6%Malaysia
5%United Kingdom, excluding England and Scotland
4%Chile
3%Mexico
2%England
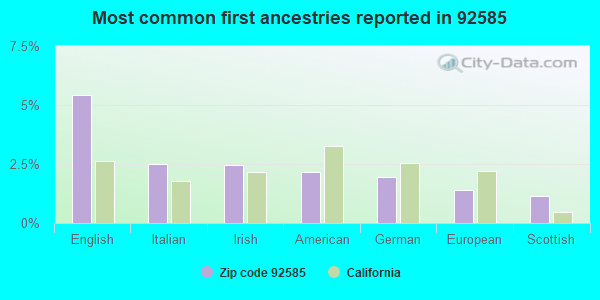
5%English
2%Italian
2%Irish
2%American
2%German
1%European
1%Scottish
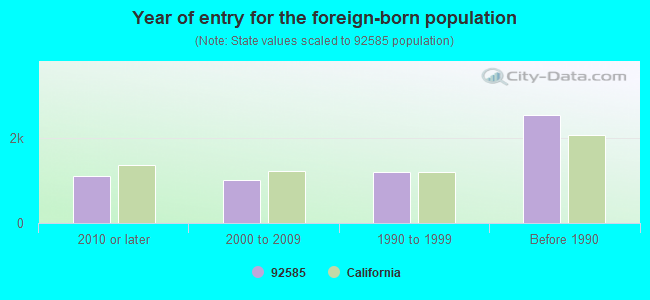
Year of entry for the foreign-born population
1,1212010 or later
1,0062000 to 2009
1,2091990 to 1999
2,556Before 1990
Facilities with environmental interests located in this zip code:
CALMAT CO ROMOLAND (28023 ETHANAC in SUN CITY, CA)
STATE MASTER (California - Hazardous Waste Tracking) - HAZARDOU WASTE PROGRAM Small Quantity Generators, between 100 kg and 1000 kg of hazardous waste/month (Resource Conservation and Recovery Act (tracking hazardous waste)) - notification
HARVEST VALLEY ELEMENTARY (29955 WATSON ROAD in ROMOLAND, CA)
(National Center for Education Statistics) - STATE ID-6109581 Organizations: ROMOLAND ELEMENTARY (SCHOOL DISTRICT)
MATTHEWS INTERNATIONAL CORPORATION (28261 HWY. 74 in ROMOLAND, CA)
CRITERIA AND HAZARDOUS AIR POLLUTANT INVENTORY (Inventory of air pollution sources) Large Quantity Generators, more that 1000 kg of hazardous waste/month (Resource Conservation and Recovery Act (tracking hazardous waste)) TRI REPORTER (Tracking of toxic chemicals releasing facilities) Business SIC and NAICS classification: COPPER FOUNDRIES Alternative names: MATTHEWS INTERNAITONAL CORP, MATTHEWS INTL. CORP.
AMERIMAX (28921 E HWY 74 in ROMOLAND, CA)
Small Quantity Generators, between 100 kg and 1000 kg of hazardous waste/month (Resource Conservation and Recovery Act (tracking hazardous waste)) - notification
LAKESIDE CHEVROLET (25351 TRUMBLE RD in ROMOLAND, CA)
Small Quantity Generators, between 100 kg and 1000 kg of hazardous waste/month (Resource Conservation and Recovery Act (tracking hazardous waste))
EASTERN MUN WATER DIST (SOUTH MURRIETA RD in SUN CITY, CA)
CRITERIA AND HAZARDOUS AIR POLLUTANT INVENTORY (Inventory of air pollution sources) Business SIC classification: WATER SUPPLY
EASTERN MUNICIPAL WATER DISTRI (24510 MENIFEE RD in ROMOLAND, CA)
CRITERIA AND HAZARDOUS AIR POLLUTANT INVENTORY (Inventory of air pollution sources) Business SIC classification: WATER SUPPLY
INLAND EMPIRE ENERGY CENTER LLC (26226 ANTELOPE RD in ROMOLAND, CA)
AIR MAJOR (AIRS/AFS) Business SIC classification: ELECTRIC SERVICES
Housing units lacking complete plumbing facilities: 0.6% Housing units lacking complete kitchen facilities: 1.9%
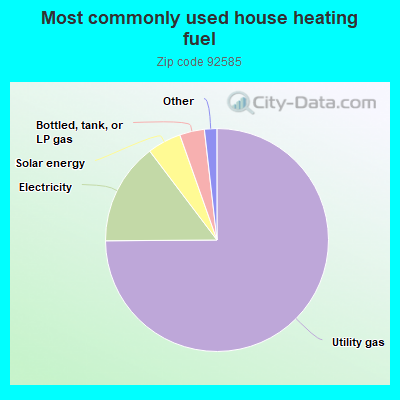
74.9%Utility gas
14.8%Electricity
4.9%Solar energy
3.6%Bottled, tank, or LP gas
0.8%Wood
0.6%No fuel used
Population in 1990: 5,231. Population change in the 1990s: +3,443 (+65.8%).
Place of birth for U.S.-born residents:
This state: 17,149
Northeast: 852
Midwest: 965
South: 1,141
West: 798
50% of the 92585 zip code residents lived in the same house 5 years ago. Out of people who lived in different houses, 63% lived in this county. Out of people who lived in different counties, 50% lived in California.
90% of the 92585 zip code residents lived in the same house 1 year ago. Out of people who lived in different houses, 48% moved from this county. Out of people who lived in different houses, 45% moved from different county within same state. Out of people who lived in different houses, 6% moved from different state.
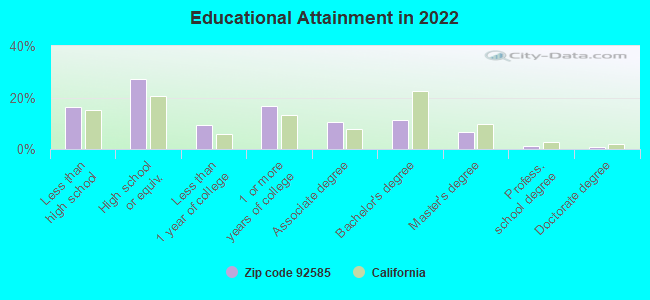
Private vs. public school enrollment:
Students in private schools in grades 1 to 8 (elementary and middle school): 139
Here:
4.1%
California:
10.5%
Students in private schools in grades 9 to 12 (high school): 118
Here:
5.6%
California:
8.5%
Students in private undergraduate colleges: 503
Here:
27.0%
California:
15.9%
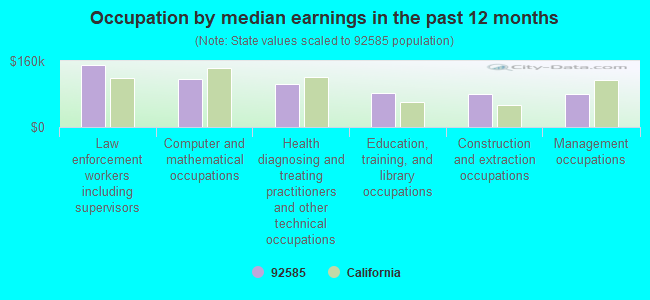
Occupation by median earnings in the past 12 months ($)
150,252Law enforcement workers including supervisors
116,399Computer and mathematical occupations
103,787Health diagnosing and treating practitioners and other technical occupations
82,088Education, training, and library occupations
81,097Construction and extraction occupations
78,915Management occupations
Companies with federal contracts located in this zip code:
DATATRONICS ROMOLAND, INC (28151 US HIGHWAY 74 in ROMOLAND, CA; small business) : $67,818 in 7 contractsfrom 2005 to 2006
Contracts for Miscellaneous Electrical and Electronic Components, Coils and Transformers, Transformers: Distribution and Power Station, Electrical and Electronic Properties Measuring and Testing Instruments, and moreby Navy, Army Signed by year:2000: $0; 2001: $0; 2002: $0; 2003: $0; 2004: $0; 2005: $64,493; 2006: $3,325.
Biggest contracts:
$23,570 with Navy for Miscellaneous Electrical and Electronic Components. Signed on 2005-12-13. Completion date: 2005-12-23.
$20,774 with Navy for Coils and Transformers. Signed on 2005-12-15. Completion date: 2006-01-26.
$13,380 with Navy for Transformers: Distribution and Power Station. Signed on 2005-12-02. Completion date: 2005-12-29.
$4,263, same as above.Signed on 2005-04-05. Completion date: 2005-06-13.
ALLENSWORTH CO (26221 NOVA LANE in SUN CITY, CA; small business) : $47,168 in 35 contractsfrom 2004 to 2005
Contracts for Nuts and Washers, Hose, Pipe, Tube, Lubrication, and Railing Fittings, Bolts, Screws, and moreby Navy Signed by year:2000: $0; 2001: $0; 2002: $0; 2003: $0; 2004: $40,318; 2005: $6,850; 2006: $0.
Biggest contracts:
$18,000 with Navy for Nuts and Washers. Signed on 2004-08-16. Completion date: 2004-09-27.
$7,534 with Navy for Hose, Pipe, Tube, Lubrication, and Railing Fittings. Signed on 2004-08-11. Completion date: 2004-08-27.
$3,364, same as above.Signed on 2004-06-25. Completion date: 2004-06-25.
$3,244, same as above.Signed on 2004-08-16. Completion date: 2004-09-14.
Top industries in this zip code by the number of employees in 2005:
Utilities: Electric Power Distribution (250-499 employees: 1 establishment, 20-49 employees: 1 establishment)
Health Care and Social Assistance: General Medical and Surgical Hospitals (250-499: 1)
Accommodation and Food Services: Hotels (except Casino Hotels) and Motels (250-499: 1)
Construction: Poured Concrete Foundation and Structure Contractors (100-249: 1)
Other Services (except Public Administration): Funeral Homes and Funeral Services (20-49: 2, 5-9: 1, 1-4: 1)
Utilities: Natural Gas Distribution (50-99: 1)
People in group quarters in 2010:
5 people in group homes intended for adults
5 people in residential treatment centers for adults
3 people in other noninstitutional facilities
People in group quarters in 2000:
7 people in other noninstitutional group quarters
Fatal accident statistics in 2014:
Fatal accident count: 1
Vehicles involved in fatal accidents: 1
Fatal accidents caused by drunken drivers: 1
Fatalities: 1
Persons involved in fatal accidents: 1
Pedestrians involved in fatal accidents: 0
Fatal accident statistics in 2013:
Fatal accident count: 3
Vehicles involved in fatal accidents: 3
Fatal accidents caused by drunken drivers: 0
Fatalities: 3
Persons involved in fatal accidents: 3
Pedestrians involved in fatal accidents: 1
Home Mortgage Disclosure Act Aggregated Statistics For Year 2009 (Based on 6 partial tracts)
A) FHA, FSA/RHS & VA Home Purchase Loans
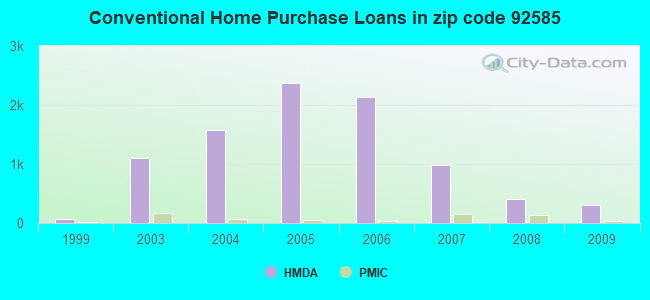
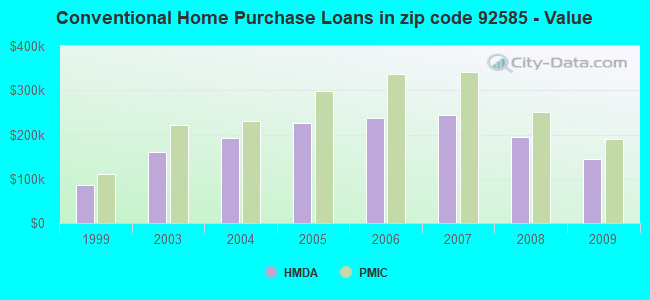
B) Conventional Home Purchase Loans
C) Refinancings
D) Home Improvement Loans
F) Non-occupant Loans on < 5 Family Dwellings (A B C & D)
G) Loans On Manufactured Home Dwelling (A B C & D)
Number
Average Value
Number
Average Value
Number
Average Value
Number
Average Value
Number
Average Value
Number
Average Value
LOANS ORIGINATED
860
$196,592
311
$143,605
400
$198,319
15
$57,786
108
$130,551
26
$152,367
APPLICATIONS APPROVED, NOT ACCEPTED
74
$206,875
44
$138,642
64
$209,355
2
$25,385
10
$130,826
5
$158,230
APPLICATIONS DENIED
137
$192,342
81
$162,312
178
$214,421
22
$94,461
39
$156,145
18
$141,795
APPLICATIONS WITHDRAWN
107
$198,324
42
$156,470
115
$209,647
3
$106,027
16
$168,502
8
$138,928
FILES CLOSED FOR INCOMPLETENESS
27
$185,858
11
$183,876
34
$199,592
6
$163,542
2
$157,950
3
$51,840
Aggregated Statistics For Year 2008 (Based on 6 partial tracts)
A) FHA, FSA/RHS & VA Home Purchase Loans
B) Conventional Home Purchase Loans
C) Refinancings
D) Home Improvement Loans
E) Loans on Dwellings For 5+ Families
F) Non-occupant Loans on < 5 Family Dwellings (A B C & D)
G) Loans On Manufactured Home Dwelling (A B C & D)
Number
Average Value
Number
Average Value
Number
Average Value
Number
Average Value
Number
Average Value
Number
Average Value
Number
Average Value
LOANS ORIGINATED
544
$242,751
406
$193,382
249
$206,165
30
$95,968
1
$40,615,200
94
$175,977
31
$171,593
APPLICATIONS APPROVED, NOT ACCEPTED
56
$254,527
87
$212,816
85
$262,850
4
$7,548
0
$0
13
$239,085
17
$122,075
APPLICATIONS DENIED
111
$257,830
131
$224,911
339
$263,153
67
$88,053
0
$0
42
$227,370
34
$150,489
APPLICATIONS WITHDRAWN
65
$252,482
66
$217,071
144
$252,652
10
$100,396
0
$0
23
$210,936
10
$227,452
FILES CLOSED FOR INCOMPLETENESS
15
$236,445
24
$247,872
34
$245,472
8
$84,755
0
$0
8
$160,194
6
$153,800
Aggregated Statistics For Year 2007 (Based on 6 partial tracts)
A) FHA, FSA/RHS & VA Home Purchase Loans
B) Conventional Home Purchase Loans
C) Refinancings
D) Home Improvement Loans
F) Non-occupant Loans on < 5 Family Dwellings (A B C & D)
G) Loans On Manufactured Home Dwelling (A B C & D)
Number
Average Value
Number
Average Value
Number
Average Value
Number
Average Value
Number
Average Value
Number
Average Value
LOANS ORIGINATED
77
$309,226
981
$244,154
870
$253,911
134
$142,623
151
$238,036
98
$197,318
APPLICATIONS APPROVED, NOT ACCEPTED
6
$327,367
312
$244,318
304
$271,312
50
$90,655
28
$242,554
22
$137,075
APPLICATIONS DENIED
24
$288,042
354
$265,938
1,019
$286,557
165
$136,293
82
$257,626
97
$179,835
APPLICATIONS WITHDRAWN
5
$328,886
268
$233,061
420
$269,750
40
$183,042
35
$240,260
34
$142,767
FILES CLOSED FOR INCOMPLETENESS
4
$263,712
50
$321,686
122
$295,467
10
$132,370
12
$254,752
7
$225,580
Aggregated Statistics For Year 2006 (Based on 6 partial tracts)
A) FHA, FSA/RHS & VA Home Purchase Loans
B) Conventional Home Purchase Loans
C) Refinancings
D) Home Improvement Loans
F) Non-occupant Loans on < 5 Family Dwellings (A B C & D)
G) Loans On Manufactured Home Dwelling (A B C & D)
Number
Average Value
Number
Average Value
Number
Average Value
Number
Average Value
Number
Average Value
Number
Average Value
LOANS ORIGINATED
28
$231,986
2,144
$237,725
1,508
$249,173
200
$139,252
291
$242,814
123
$187,490
APPLICATIONS APPROVED, NOT ACCEPTED
6
$354,255
637
$242,623
332
$246,648
49
$155,337
50
$235,004
20
$162,919
APPLICATIONS DENIED
7
$302,147
702
$242,511
950
$279,684
231
$152,726
115
$236,147
96
$179,502
APPLICATIONS WITHDRAWN
5
$284,844
430
$241,006
636
$280,724
51
$154,412
46
$223,690
26
$198,431
FILES CLOSED FOR INCOMPLETENESS
2
$243,690
122
$242,441
151
$244,338
19
$185,378
17
$185,862
13
$196,390
Aggregated Statistics For Year 2005 (Based on 6 partial tracts)
A) FHA, FSA/RHS & VA Home Purchase Loans
B) Conventional Home Purchase Loans
C) Refinancings
D) Home Improvement Loans
F) Non-occupant Loans on < 5 Family Dwellings (A B C & D)
G) Loans On Manufactured Home Dwelling (A B C & D)
Number
Average Value
Number
Average Value
Number
Average Value
Number
Average Value
Number
Average Value
Number
Average Value
LOANS ORIGINATED
28
$226,197
2,376
$226,142
1,485
$238,951
200
$139,221
327
$211,103
177
$174,952
APPLICATIONS APPROVED, NOT ACCEPTED
2
$258,920
689
$217,980
291
$226,481
43
$119,371
101
$241,600
25
$150,807
APPLICATIONS DENIED
8
$235,999
706
$230,561
777
$241,064
204
$117,299
101
$238,454
121
$162,840
APPLICATIONS WITHDRAWN
6
$269,273
554
$239,926
596
$242,774
89
$157,950
71
$258,635
69
$159,688
FILES CLOSED FOR INCOMPLETENESS
1
$88,000
110
$248,470
219
$238,403
12
$88,843
14
$195,504
32
$162,859
Aggregated Statistics For Year 2004 (Based on 6 partial tracts)
A) FHA, FSA/RHS & VA Home Purchase Loans
B) Conventional Home Purchase Loans
C) Refinancings
D) Home Improvement Loans
E) Loans on Dwellings For 5+ Families
F) Non-occupant Loans on < 5 Family Dwellings (A B C & D)
G) Loans On Manufactured Home Dwelling (A B C & D)
Number
Average Value
Number
Average Value
Number
Average Value
Number
Average Value
Number
Average Value
Number
Average Value
Number
Average Value
LOANS ORIGINATED
54
$212,797
1,574
$192,920
1,532
$205,072
181
$131,857
1
$132,000
266
$180,443
154
$155,276
APPLICATIONS APPROVED, NOT ACCEPTED
0
$0
326
$215,921
343
$205,289
44
$126,350
0
$0
45
$205,091
42
$149,129
APPLICATIONS DENIED
12
$188,088
389
$207,371
583
$199,526
137
$93,493
0
$0
58
$202,043
94
$143,240
APPLICATIONS WITHDRAWN
7
$198,241
292
$195,041
499
$198,959
53
$96,009
0
$0
33
$177,988
41
$128,081
FILES CLOSED FOR INCOMPLETENESS
0
$0
44
$218,122
138
$202,819
23
$73,400
0
$0
5
$109,922
11
$138,615
Aggregated Statistics For Year 2003 (Based on 6 partial tracts)
A) FHA, FSA/RHS & VA Home Purchase Loans
B) Conventional Home Purchase Loans
C) Refinancings
D) Home Improvement Loans
F) Non-occupant Loans on < 5 Family Dwellings (A B C & D)
Number
Average Value
Number
Average Value
Number
Average Value
Number
Average Value
Number
Average Value
LOANS ORIGINATED
125
$194,278
1,094
$161,388
1,886
$148,513
55
$75,532
213
$131,997
APPLICATIONS APPROVED, NOT ACCEPTED
11
$176,219
146
$173,414
333
$157,220
23
$79,125
26
$163,010
APPLICATIONS DENIED
17
$163,276
143
$160,024
589
$142,940
101
$42,506
44
$128,086
APPLICATIONS WITHDRAWN
10
$169,137
144
$167,118
544
$152,981
25
$64,484
26
$146,216
FILES CLOSED FOR INCOMPLETENESS
5
$173,182
25
$164,478
93
$153,156
3
$40,827
7
$103,009
Aggregated Statistics For Year 1999 (Based on 2 partial tracts)
A) FHA, FSA/RHS & VA Home Purchase Loans
B) Conventional Home Purchase Loans
C) Refinancings
D) Home Improvement Loans
E) Loans on Dwellings For 5+ Families
F) Non-occupant Loans on < 5 Family Dwellings (A B C & D)
2006 - 2018 National Fire Incident Reporting System (NFIRS) incidents
Based on the data from the years 2006 - 2018 the average number of fire incidents per year is 23. The highest number of fires - 36 took place in 2007, and the least - 6 in 2006. The data has an increasing trend.
When looking into fire subcategories, the most incidents belonged to: Outside Fires (58.1%), and Mobile Property/Vehicle Fires (21.1%).
Fire incident types reported to NFIRS in Zip Code 92585


 Nearest zip codes: 92586, 92548, 92571, 92584, 92567, 92587.


 Based on the data from the years 2006 - 2018 the average number of fire incidents per year is 23. The highest number of fires - 36 took place in 2007, and the least - 6 in 2006. The data has an increasing trend.
 When looking into fire subcategories, the most incidents belonged to: Outside Fires (58.1%), and Mobile Property/Vehicle Fires (21.1%).