Estimated zip code population in 2022: 7,050 Zip code population in 2010: 6,643 Zip code population in 2000: 4,276
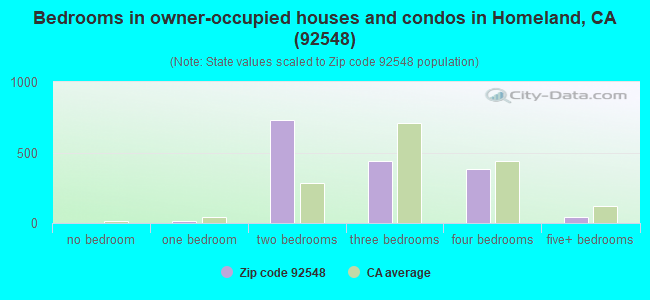
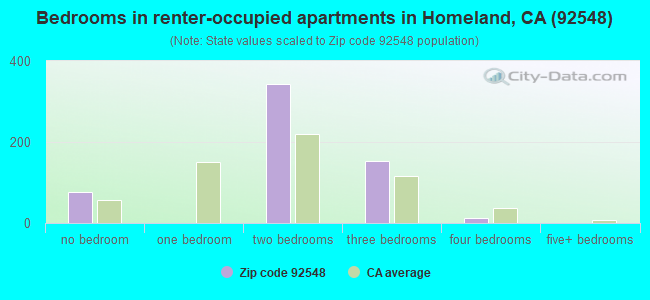
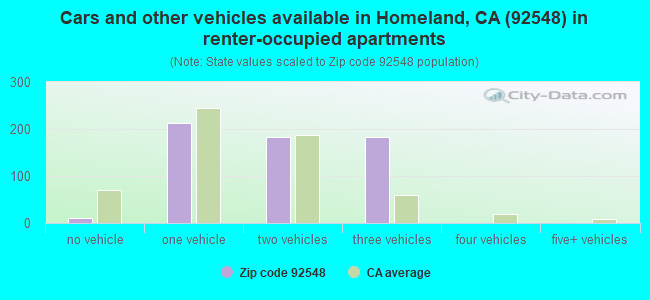
Houses and condos: 2,393 Renter-occupied apartments: 586
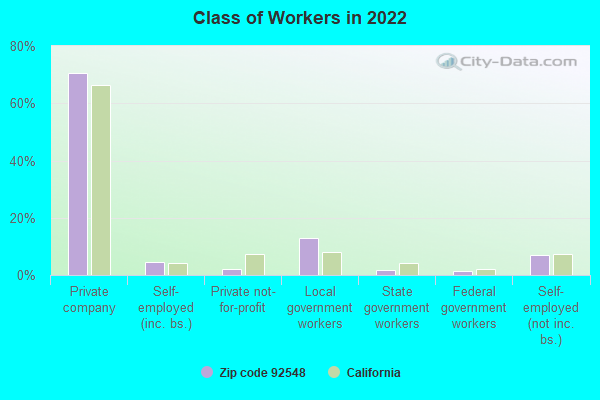
% of renters here:
27%
State:
44%
March 2022 cost of living index in zip code 92548: 80.7 (low, U.S. average is 100)
Land area: 9.8 sq. mi. Water area: 0.0 sq. mi.
Population density: 717 people per square mile
(low).
OSM Map
General Map
Google Map
MSN Map
OSM Map
General Map
Google Map
MSN Map
OSM Map
General Map
Google Map
MSN Map
OSM Map
General Map
Google Map
MSN Map
Please wait while loading the map...
Real estate property taxes paid for housing units in 2022:
This zip code:
0.6% ($1,289)
California:
0.7% ($4,831)
Median real estate property taxes paid for housing units with mortgages in 2022: $2,007 (0.7%) Median real estate property taxes paid for housing units with no mortgage in 2022: $1,023 (0.7%)
Business Search- 14 Million verified businesses
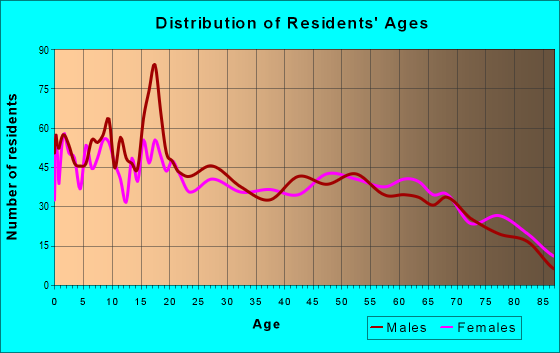
Males: 3,464
(49.1%)
Females: 3,586
(50.9%)
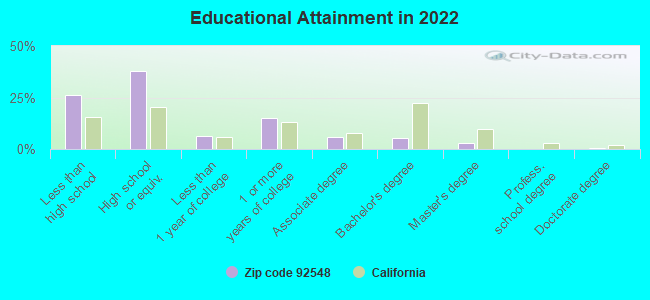
For population 25 years and over in 92548:
High school or higher: 73.1%
Bachelor's degree or higher: 9.1%
Graduate or professional degree: 3.6%
Unemployed: 8.5%
Mean travel time to work (commute): 36.4 minutes
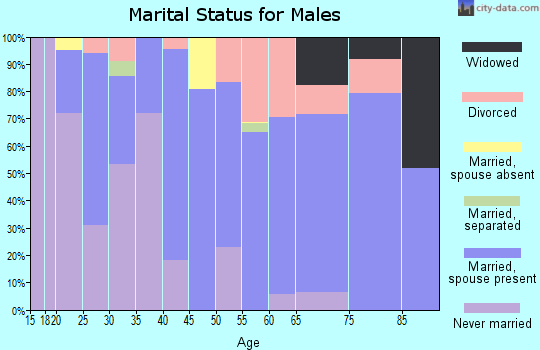
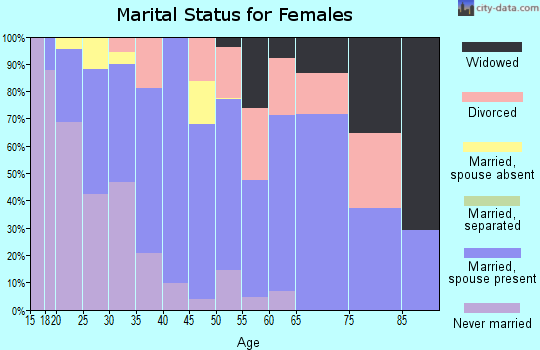
For population 15 years and over in 92548:
Never married: 34.7%
Now married: 45.9%
Separated: 4.3%
Widowed: 6.0%
Divorced: 9.0%
Zip code 92548 compared to state average:
Median household income below state average.
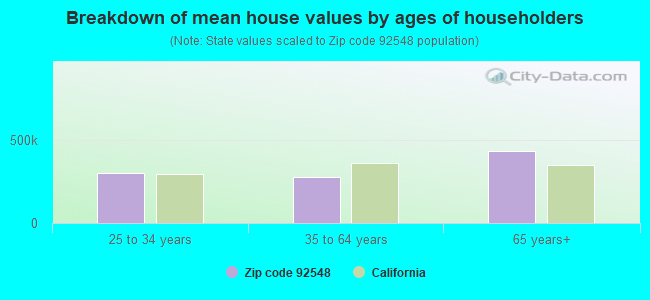
Median house value significantly below state average.
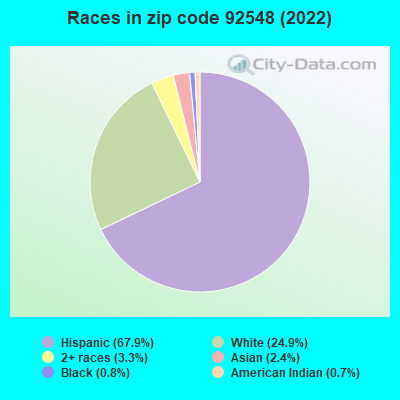
Black race population percentage significantly below state average.
Hispanic race population percentage above state average.
Median age below state average.
Renting percentage below state average.
Percentage of population with a bachelor's degree or higher significantly below state average.
Averages for the 2020 tax year for zip code 92548, filed in 2021:
Average Adjusted Gross Income (AGI) in 2020: $39,273 (Individual Income Tax Returns)
Here:
$39,273
State:
$95,910
Salary/wage: $37,739 (reported on 79.2% of returns)
Here:
$37,739
State:
$77,331
(% of AGI for various income ranges: 1115.7% for AGIs below $25k, 3584.3% for AGIs $25k-50k, 6785.2% for AGIs $50k-75k, 10876.9% for AGIs $75k-100k, 16765.6% for AGIs $100k-200k)
Taxable interest for individuals: $375 (reported on 19.8% of returns)
This zip code:
$375
California:
$2,294
(% of AGI for various income ranges: 5.3% for AGIs below $25k, 2.9% for AGIs $25k-50k, 23.2% for AGIs $50k-75k, 13.8% for AGIs $75k-100k, 73.3% for AGIs $100k-200k)
Ordinary dividends: $2,131 (reported on 4.2% of returns)
Here:
$2,131
State:
$10,949
(% of AGI for various income ranges: 5.8% for AGIs below $25k, 3.9% for AGIs $25k-50k, 41.0% for AGIs $50k-75k, 72.2% for AGIs $100k-200k)
Net capital gain/loss in AGI: +$5,469 (reported on 5.2% of returns)
Here:
+$5,469
State:
+$49,306
(% of AGI for various income ranges: 2.4% for AGIs below $25k, 5.6% for AGIs $25k-50k, 17.7% for AGIs $50k-75k, 46.2% for AGIs $75k-100k, 772.2% for AGIs $100k-200k)
Profit/loss from business: +$9,312 (reported on 16.9% of returns)
Here:
+$9,312
State:
+$15,671
(% of AGI for various income ranges: 194.3% for AGIs below $25k, 231.3% for AGIs $25k-50k, 186.5% for AGIs $50k-75k, 378.5% for AGIs $75k-100k, 191.1% for AGIs $100k-200k)
Taxable individual retirement arrangement distribution: $11,427 (reported on 3.6% of returns)
92548:
$11,427
California:
$23,505
(% of AGI for various income ranges: 27.2% for AGIs below $25k, 54.0% for AGIs $25k-50k, 454.6% for AGIs $75k-100k)
Total itemized deductions: $26,371 (reported on 5.5% of returns)
Here:
$26,371
State:
$39,517
(% of AGI for various income ranges: 145.7% for AGIs $25k-50k, 316.8% for AGIs $50k-75k, 666.2% for AGIs $75k-100k, 1713.3% for AGIs $100k-200k)
Charity contributions: $4,569 (reported on 4.2% of returns)
Here:
$4,569
State:
$12,598
(% of AGI for various income ranges: 15.3% for AGIs $25k-50k, 44.5% for AGIs $50k-75k, 79.2% for AGIs $75k-100k, 264.4% for AGIs $100k-200k)
Taxes paid: $6,776 (reported on 5.5% of returns)
92548:
$6,776
State:
$8,807
(% of AGI for various income ranges: 23.9% for AGIs $25k-50k, 81.3% for AGIs $50k-75k, 198.5% for AGIs $75k-100k, 514.4% for AGIs $100k-200k)
Earned income credit: $2,432 (reported on 26.0% of returns)
Here:
$2,432
State:
$2,074
(% of AGI for various income ranges: 120.9% for AGIs below $25k, 104.7% for AGIs $25k-50k)
Percentage of individuals using paid preparers for their 2020 taxes: 92.5%
Here:
93%
State:
92%
(% for various income ranges: 89.9% for AGIs below $25k, 93.9% for AGIs $25k-50k, 95.2% for AGIs $50k-75k, 95.2% for AGIs $75k-100k, 93.3% for AGIs $100k-200k, 100.0% for AGIs over 200k)
Averages for the 2012 tax year for zip code 92548, filed in 2013:
Average Adjusted Gross Income (AGI) in 2012: $32,893 (Individual Income Tax Returns)
Here:
$32,893
State:
$72,726
Salary/wage: $29,421 (reported on 78.1% of returns)
Here:
$29,421
State:
$59,079
(% of AGI for various income ranges: 69.3% for AGIs below $25k, 75.2% for AGIs $25k-50k, 72.9% for AGIs $50k-75k, 78.0% for AGIs $75k-100k, 51.7% for AGIs $100k-200k)
Taxable interest for individuals: $598 (reported on 23.7% of returns)
This zip code:
$598
California:
$2,146
(% of AGI for various income ranges: 0.8% for AGIs below $25k, 0.4% for AGIs $25k-50k, 0.5% for AGIs $50k-75k, 0.1% for AGIs $75k-100k, 0.3% for AGIs $100k-200k)
Ordinary dividends: $2,519 (reported on 7.1% of returns)
Here:
$2,519
State:
$9,308
(% of AGI for various income ranges: 0.7% for AGIs below $25k, 0.6% for AGIs $25k-50k, 0.7% for AGIs $50k-75k, 0.4% for AGIs $100k-200k)
Net capital gain/loss in AGI: +$179 (reported on 6.2% of returns)
Here:
+$179
State:
+$30,460
(% of AGI for various income ranges: 0.7% for AGIs $75k-100k)
Profit/loss from business: +$9,255 (reported on 17.0% of returns)
Here:
+$9,255
State:
+$17,064
(% of AGI for various income ranges: 12.0% for AGIs below $25k, 5.0% for AGIs $25k-50k, 2.3% for AGIs $50k-75k, 2.0% for AGIs $75k-100k)
Taxable individual retirement arrangement distribution: $11,814 (reported on 6.2% of returns)
92548:
$11,814
California:
$19,557
(% of AGI for various income ranges: 1.7% for AGIs below $25k, 1.6% for AGIs $25k-50k, 1.7% for AGIs $50k-75k, 8.1% for AGIs $75k-100k)
Total itemized deductions: $19,615 (29% of AGI, reported on 20.5% of returns)
Here:
$19,615
State:
$34,004
Here:
29.5% of AGI
State:
22.7% of AGI
(% of AGI for various income ranges: 6.0% for AGIs below $25k, 10.4% for AGIs $25k-50k, 17.5% for AGIs $50k-75k, 15.7% for AGIs $75k-100k, 14.5% for AGIs $100k-200k)
Charity contributions: $2,680 (reported on 15.6% of returns)
Here:
$2,680
State:
$4,659
(% of AGI for various income ranges: 0.5% for AGIs below $25k, 1.2% for AGIs $25k-50k, 1.5% for AGIs $50k-75k, 1.4% for AGIs $75k-100k, 2.0% for AGIs $100k-200k)
Taxes paid: $4,902 (reported on 20.1% of returns)
92548:
$4,902
State:
$14,448
(% of AGI for various income ranges: 0.8% for AGIs below $25k, 1.7% for AGIs $25k-50k, 4.1% for AGIs $50k-75k, 4.1% for AGIs $75k-100k, 5.9% for AGIs $100k-200k)
Earned income credit: $2,719 (reported on 34.8% of returns)
Here:
$2,719
State:
$2,286
(% of AGI for various income ranges: 10.3% for AGIs below $25k, 2.3% for AGIs $25k-50k)
Percentage of individuals using paid preparers for their 2012 taxes: 67.0%
Here:
67%
State:
64%
(% for various income ranges: 63.9% for AGIs below $25k, 70.0% for AGIs $25k-50k, 66.7% for AGIs $50k-75k, 81.8% for AGIs $75k-100k, 71.4% for AGIs $100k-200k)
Averages for the 2004 tax year for zip code 92548, filed in 2005:
Average Adjusted Gross Income (AGI) in 2004: $32,408 (Individual Income Tax Returns)
Here:
$32,408
State:
$58,600
Salary/wage: $30,907 (reported on 78.4% of returns)
Here:
$30,907
State:
$49,455
(% of AGI for various income ranges: 76.3% for AGIs below $10k, 70.3% for AGIs $10k-25k, 81.8% for AGIs $25k-50k, 79.7% for AGIs $50k-75k, 75.8% for AGIs $75k-100k, 58.1% for AGIs over 100k)
Taxable interest for individuals: $1,446 (reported on 33.3% of returns)
This zip code:
$1,446
California:
$2,365
(% of AGI for various income ranges: 4.6% for AGIs below $10k, 2.1% for AGIs $10k-25k, 1.6% for AGIs $25k-50k, 0.7% for AGIs $50k-75k, 0.6% for AGIs $75k-100k, 1.7% for AGIs over 100k)
Taxable dividends: $1,525 (reported on 11.9% of returns)
Here:
$1,525
State:
$4,746
(% of AGI for various income ranges: 2.8% for AGIs below $10k, 0.7% for AGIs $10k-25k, 0.6% for AGIs $25k-50k, 0.3% for AGIs $50k-75k, 0.2% for AGIs $75k-100k, 0.5% for AGIs over 100k)
Net capital gain/loss: +$10,252 (reported on 10.6% of returns)
Here:
+$10,252
State:
+$23,418
(% of AGI for various income ranges: -1.3% for AGIs below $10k, 0.1% for AGIs $10k-25k, 0.8% for AGIs $25k-50k, 0.5% for AGIs $50k-75k, 5.8% for AGIs $75k-100k, 15.6% for AGIs over 100k)
Profit/loss from business: +$6,579 (reported on 15.7% of returns)
Here:
+$6,579
State:
+$16,826
(% of AGI for various income ranges: 10.0% for AGIs below $10k, 6.6% for AGIs $10k-25k, 2.2% for AGIs $25k-50k, 2.6% for AGIs $50k-75k, 1.1% for AGIs $75k-100k, 2.2% for AGIs over 100k)
IRA payment deduction: $2,346 (reported on 1.3% of returns)
92548:
$2,346
California:
$3,192
Total itemized deductions: $18,943 (33% of AGI, reported on 27.5% of returns)
Here:
$18,943
State:
$28,113
Here:
32.7% of AGI
State:
25.3% of AGI
(% of AGI for various income ranges: 14.7% for AGIs below $10k, 9.8% for AGIs $10k-25k, 14.3% for AGIs $25k-50k, 19.9% for AGIs $50k-75k, 23.0% for AGIs $75k-100k, 17.9% for AGIs over 100k)
Charity contributions deductions: $2,254 (4% of AGI, reported on 21.4% of returns)
Here:
$2,254
State:
$3,923
Here:
3.8% of AGI
State:
3.3% of AGI
(% of AGI for various income ranges: 0.9% for AGIs below $10k, 0.7% for AGIs $10k-25k, 1.4% for AGIs $25k-50k, 2.5% for AGIs $50k-75k, 2.4% for AGIs $75k-100k, 0.8% for AGIs over 100k)
Total tax: $3,650 (reported on 66.4% of returns)
92548:
$3,650
State:
$10,761
(% of AGI for various income ranges: 3.0% for AGIs below $10k, 3.5% for AGIs $10k-25k, 4.8% for AGIs $25k-50k, 7.8% for AGIs $50k-75k, 8.9% for AGIs $75k-100k, 17.4% for AGIs over 100k)
Earned income credit: $1,911 (reported on 23.7% of returns)
Here:
$1,911
State:
$1,763
Percentage of individuals using paid preparers for their 2004 taxes: 68.4%
Here:
68%
State:
66%
(% for various income ranges: 63.1% for AGIs below $10k, 66.8% for AGIs $10k-25k, 71.1% for AGIs $25k-50k, 70.6% for AGIs $50k-75k, 73.5% for AGIs $75k-100k, 77.4% for AGIs over 100k)
Likely homosexual households (counted as self-reported same-sex unmarried-partner households)
Lesbian couples: 0.4% of all households
Gay men: 0.0% of all households
Household received Food Stamps/SNAP in the past 12 months: 379 Household did not receive Food Stamps/SNAP in the past 12 months: 1,838
Women who had a birth in the past 12 months: 20 (11 now married, 9 unmarried) Women who did not have a birth in the past 12 months: 1,891 (786 now married, 1,103 unmarried)
Housing units in zip code 92548 with a mortgage: 703 Median monthly owner costs for units with a mortgage: $1,615 Median monthly owner costs for units without a mortgage: $378
Residents with income below the poverty level in 2022:
This zip code:
13.6%
Whole state:
12.2%
Residents with income below 50% of the poverty level in 2022:
This zip code:
7.2%
Whole state:
6.2%
Median number of rooms in houses and condos:
Here:
5.7
State:
6.0
Median number of rooms in apartments:
Here:
4.6
State:
3.9
Notable locations in this zip code not listed on our city pages
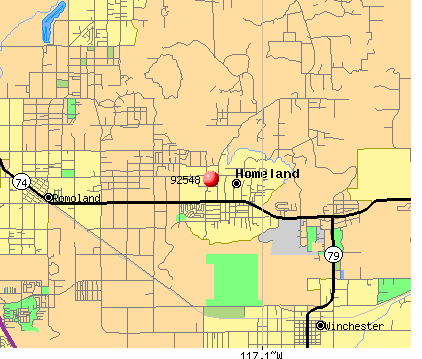
Notable locations in zip code 92548: Highland Palm Golf Course (A), Riverside County Fire Department Station 54 Homeland (B). Display/hide their locations on the map
In group quarters: 30 (-1 institutionalized population)
Size of family households: 436 2-persons, 238 3-persons, 199 4-persons, 303 5-persons, 179 6-persons, 150 7-or-more-persons
Size of nonfamily households: 488 1-person, 191 2-persons, 7 3-persons
1,084 married couples with children.
510 single-parent households (205 men, 305 women).
50.3% of residents of 92548 zip code speak English at home.
47.2% of residents speak Spanish at home (69% very well, 17% well, 12% not well, 2% not at all).
0.6% of residents speak other Indo-European language at home (100% very well).
1.7% of residents speak Asian or Pacific Island language at home (60% very well, 40% not well).
Foreign born population: 1,850 (26.2%) (54.1% of them are naturalized citizens)
This zip code:
26.2%
Whole state:
26.7%
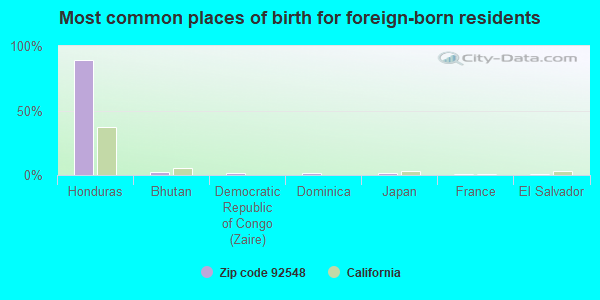
89%Honduras
2%Bhutan
2%Democratic Republic of Congo (Zaire)
1%Dominica
1%Japan
1%France
1%El Salvador
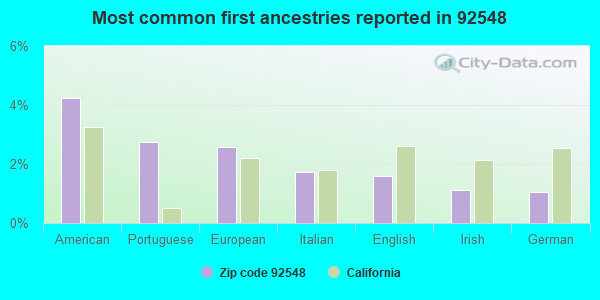
4%American
3%Portuguese
3%European
2%Italian
2%English
1%Irish
1%German
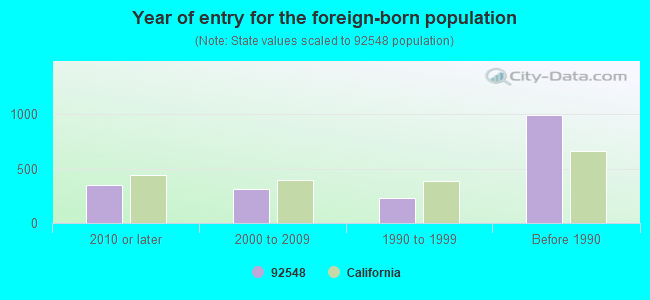
Year of entry for the foreign-born population
3482010 or later
3092000 to 2009
2311990 to 1999
995Before 1990
Facilities with environmental interests located in this zip code:
GOLDEN STATE AUTO BODY (31198A HIGHWAY 74 in HOMELAND, CA)
Small Quantity Generators, between 100 kg and 1000 kg of hazardous waste/month (Resource Conservation and Recovery Act (tracking hazardous waste)) - notification Organizations: ED JANICE (CONTACT/OWNER)
Housing units lacking complete plumbing facilities: 3.5% Housing units lacking complete kitchen facilities: 2.9%
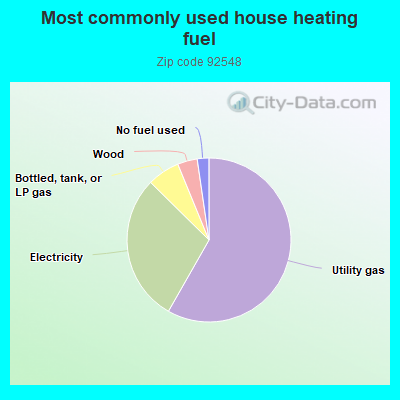
58.3%Utility gas
29.2%Electricity
6.4%Bottled, tank, or LP gas
3.9%Wood
2.3%No fuel used
Population in 1990: 4,290.
Place of birth for U.S.-born residents:
This state: 4,294
Northeast: 143
Midwest: 311
South: 242
West: 153
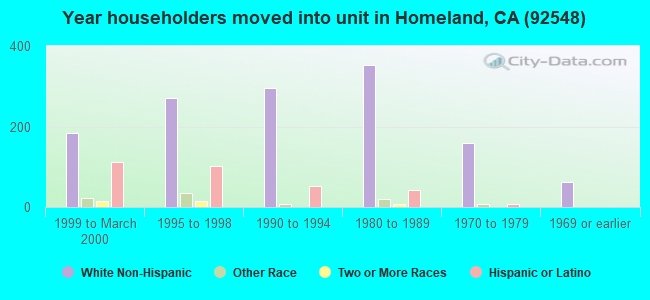
53% of the 92548 zip code residents lived in the same house 5 years ago. Out of people who lived in different houses, 75% lived in this county. Out of people who lived in different counties, 50% lived in California.
88% of the 92548 zip code residents lived in the same house 1 year ago. Out of people who lived in different houses, 35% moved from this county. Out of people who lived in different houses, 49% moved from different county within same state. Out of people who lived in different houses, 4% moved from different state. Out of people who lived in different houses, 14% moved from abroad.
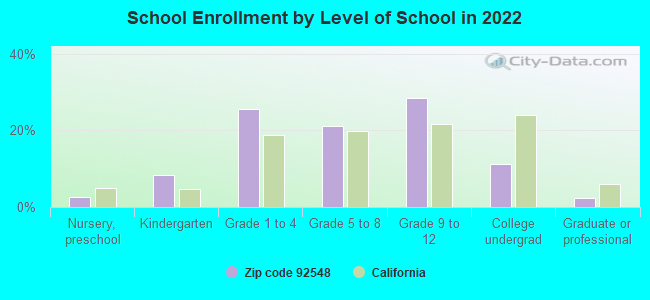
Private vs. public school enrollment:
Students in private schools in grades 1 to 8 (elementary and middle school): 117
Here:
12.6%
California:
10.5%
Students in private schools in grades 9 to 12 (high school): 13
Here:
2.3%
California:
8.5%
Students in private undergraduate colleges: 78
Here:
34.3%
California:
15.9%
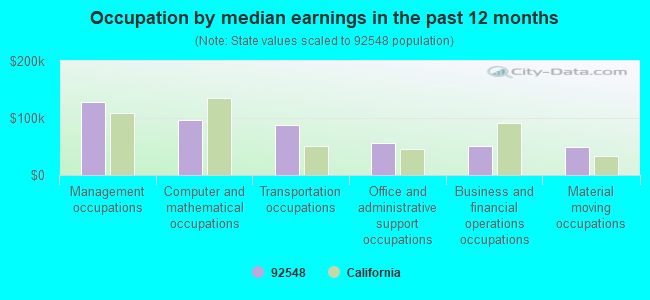
Occupation by median earnings in the past 12 months ($)
127,694Management occupations
95,740Computer and mathematical occupations
86,897Transportation occupations
55,431Office and administrative support occupations
50,670Business and financial operations occupations
49,332Material moving occupations
Top industries in this zip code by the number of employees in 2005:
Construction: Poured Concrete Foundation and Structure Contractors (10-19 employees: 1 establishment)
Construction: Masonry Contractors (10-19: 1)
Construction: Power and Communication Line and Related Structures Construction (10-19: 1)
Other Services (except Public Administration): General Automotive Repair (5-9: 1, 1-4: 1)
Administrative and Support and Waste Management and Remediation Services: Other Services to Buildings and Dwellings (5-9: 1)
Other Services (except Public Administration): Other Similar Organizations (except Business, Professional, Labor, and Political Organizations) (5-9: 1)
Other Services (except Public Administration): Pet Care (except Veterinary) Services (1-4: 2)
People in group quarters in 2010:
6 people in residential treatment centers for adults
4 people in group homes intended for adults
Fatal accident statistics in 2014:
Fatal accident count: 1
Vehicles involved in fatal accidents: 1
Fatal accidents caused by drunken drivers: 0
Fatalities: 1
Persons involved in fatal accidents: 2
Pedestrians involved in fatal accidents: 1
Fatal accident statistics in 2012:
Fatal accident count: 1
Vehicles involved in fatal accidents: 1
Fatal accidents caused by drunken drivers: 0
Fatalities: 1
Persons involved in fatal accidents: 1
Pedestrians involved in fatal accidents: 1
Home Mortgage Disclosure Act Aggregated Statistics For Year 2009 (Based on 2 partial tracts)
A) FHA, FSA/RHS & VA Home Purchase Loans
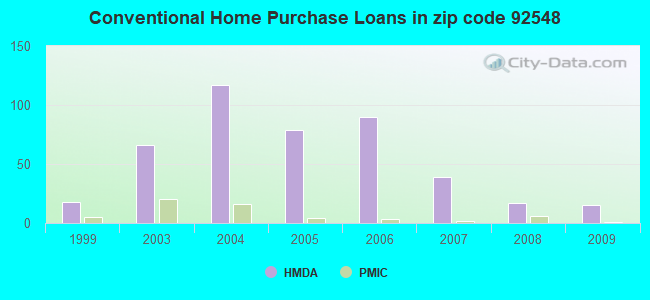
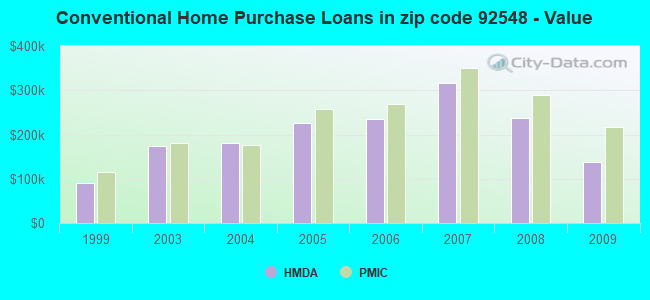
B) Conventional Home Purchase Loans
C) Refinancings
D) Home Improvement Loans
F) Non-occupant Loans on < 5 Family Dwellings (A B C & D)
G) Loans On Manufactured Home Dwelling (A B C & D)
Number
Average Value
Number
Average Value
Number
Average Value
Number
Average Value
Number
Average Value
Number
Average Value
LOANS ORIGINATED
39
$165,893
15
$138,741
28
$185,702
1
$6,320
6
$96,895
9
$205,023
APPLICATIONS APPROVED, NOT ACCEPTED
2
$140,600
1
$94,790
5
$212,746
0
$0
0
$0
4
$138,495
APPLICATIONS DENIED
7
$154,520
7
$102,611
23
$236,558
1
$15,800
4
$129,542
14
$123,751
APPLICATIONS WITHDRAWN
6
$137,793
3
$176,587
7
$202,816
2
$152,185
2
$193,790
0
$0
FILES CLOSED FOR INCOMPLETENESS
1
$56,870
1
$223,280
3
$242,587
0
$0
0
$0
0
$0
Aggregated Statistics For Year 2008 (Based on 2 partial tracts)
A) FHA, FSA/RHS & VA Home Purchase Loans
B) Conventional Home Purchase Loans
C) Refinancings
D) Home Improvement Loans
F) Non-occupant Loans on < 5 Family Dwellings (A B C & D)
G) Loans On Manufactured Home Dwelling (A B C & D)
Number
Average Value
Number
Average Value
Number
Average Value
Number
Average Value
Number
Average Value
Number
Average Value
LOANS ORIGINATED
14
$240,581
17
$236,474
20
$228,807
0
$0
3
$98,650
14
$133,079
APPLICATIONS APPROVED, NOT ACCEPTED
2
$322,805
6
$127,963
14
$181,752
0
$0
1
$315,960
15
$124,769
APPLICATIONS DENIED
3
$204,673
13
$389,441
61
$224,850
9
$278,162
6
$295,598
24
$158,726
APPLICATIONS WITHDRAWN
0
$0
3
$392,140
20
$274,306
2
$132,705
1
$131,650
5
$145,130
FILES CLOSED FOR INCOMPLETENESS
2
$171,145
4
$373,095
4
$407,588
2
$37,390
1
$209,590
3
$208,883
Aggregated Statistics For Year 2007 (Based on 2 partial tracts)
A) FHA, FSA/RHS & VA Home Purchase Loans
B) Conventional Home Purchase Loans
C) Refinancings
D) Home Improvement Loans
E) Loans on Dwellings For 5+ Families
F) Non-occupant Loans on < 5 Family Dwellings (A B C & D)
G) Loans On Manufactured Home Dwelling (A B C & D)
Number
Average Value
Number
Average Value
Number
Average Value
Number
Average Value
Number
Average Value
Number
Average Value
Number
Average Value
LOANS ORIGINATED
8
$254,348
39
$316,554
74
$246,477
13
$133,838
0
$0
4
$306,480
47
$196,545
APPLICATIONS APPROVED, NOT ACCEPTED
2
$224,860
15
$284,575
19
$328,155
7
$121,269
1
$473,940
2
$713,545
7
$238,023
APPLICATIONS DENIED
2
$229,070
44
$244,199
107
$288,990
18
$201,571
0
$0
6
$303,322
60
$171,198
APPLICATIONS WITHDRAWN
1
$207,480
15
$276,711
32
$268,368
4
$197,738
0
$0
3
$479,907
11
$209,683
FILES CLOSED FOR INCOMPLETENESS
1
$243,290
5
$389,052
9
$336,088
1
$568,730
0
$0
1
$198,000
2
$262,245
Aggregated Statistics For Year 2006 (Based on 2 partial tracts)
A) FHA, FSA/RHS & VA Home Purchase Loans
B) Conventional Home Purchase Loans
C) Refinancings
D) Home Improvement Loans
F) Non-occupant Loans on < 5 Family Dwellings (A B C & D)
G) Loans On Manufactured Home Dwelling (A B C & D)
Number
Average Value
Number
Average Value
Number
Average Value
Number
Average Value
Number
Average Value
Number
Average Value
LOANS ORIGINATED
7
$212,746
90
$234,969
97
$278,132
19
$178,379
14
$217,486
61
$193,012
APPLICATIONS APPROVED, NOT ACCEPTED
0
$0
19
$155,097
25
$391,116
3
$110,233
0
$0
9
$148,033
APPLICATIONS DENIED
8
$205,506
39
$222,711
112
$255,335
38
$118,291
12
$172,198
44
$176,555
APPLICATIONS WITHDRAWN
3
$267,863
12
$220,908
56
$273,174
3
$88,117
4
$313,328
16
$202,741
FILES CLOSED FOR INCOMPLETENESS
2
$180,095
4
$274,095
9
$353,641
2
$149,555
0
$0
5
$148,290
Aggregated Statistics For Year 2005 (Based on 2 partial tracts)
A) FHA, FSA/RHS & VA Home Purchase Loans
B) Conventional Home Purchase Loans
C) Refinancings
D) Home Improvement Loans
F) Non-occupant Loans on < 5 Family Dwellings (A B C & D)
G) Loans On Manufactured Home Dwelling (A B C & D)
Number
Average Value
Number
Average Value
Number
Average Value
Number
Average Value
Number
Average Value
Number
Average Value
LOANS ORIGINATED
12
$157,541
79
$226,331
136
$234,275
20
$175,832
17
$208,224
61
$168,046
APPLICATIONS APPROVED, NOT ACCEPTED
3
$159,033
17
$205,002
35
$222,647
4
$222,225
2
$123,750
12
$167,985
APPLICATIONS DENIED
5
$184,732
43
$225,556
113
$214,806
27
$111,171
9
$184,427
55
$160,795
APPLICATIONS WITHDRAWN
1
$193,790
29
$185,145
88
$231,357
12
$107,602
11
$160,182
20
$148,975
FILES CLOSED FOR INCOMPLETENESS
1
$190,630
3
$152,013
22
$211,071
2
$74,775
2
$113,745
7
$171,671
Aggregated Statistics For Year 2004 (Based on 2 partial tracts)
A) FHA, FSA/RHS & VA Home Purchase Loans
B) Conventional Home Purchase Loans
C) Refinancings
D) Home Improvement Loans
F) Non-occupant Loans on < 5 Family Dwellings (A B C & D)
G) Loans On Manufactured Home Dwelling (A B C & D)
Number
Average Value
Number
Average Value
Number
Average Value
Number
Average Value
Number
Average Value
Number
Average Value
LOANS ORIGINATED
17
$197,692
117
$181,087
141
$188,904
18
$125,272
19
$153,435
74
$151,760
APPLICATIONS APPROVED, NOT ACCEPTED
1
$92,680
22
$201,592
41
$190,860
3
$46,340
2
$262,775
26
$145,868
APPLICATIONS DENIED
1
$273,830
41
$183,514
86
$163,148
22
$91,915
8
$183,915
38
$141,378
APPLICATIONS WITHDRAWN
2
$110,060
19
$164,964
56
$180,511
8
$49,895
2
$220,120
20
$118,327
FILES CLOSED FOR INCOMPLETENESS
0
$0
6
$242,060
15
$165,844
4
$88,995
1
$103,210
3
$154,820
Aggregated Statistics For Year 2003 (Based on 2 partial tracts)
A) FHA, FSA/RHS & VA Home Purchase Loans
B) Conventional Home Purchase Loans
C) Refinancings
D) Home Improvement Loans
F) Non-occupant Loans on < 5 Family Dwellings (A B C & D)
Number
Average Value
Number
Average Value
Number
Average Value
Number
Average Value
Number
Average Value
LOANS ORIGINATED
15
$147,027
66
$173,634
162
$145,829
11
$30,351
12
$147,887
APPLICATIONS APPROVED, NOT ACCEPTED
0
$0
23
$186,920
27
$212,786
5
$67,404
7
$238,174
APPLICATIONS DENIED
4
$201,688
26
$125,817
68
$136,854
17
$42,376
8
$175,621
APPLICATIONS WITHDRAWN
5
$140,918
9
$188,054
58
$158,724
4
$99,265
1
$130,600
FILES CLOSED FOR INCOMPLETENESS
0
$0
0
$0
8
$226,570
0
$0
1
$210,640
Aggregated Statistics For Year 1999 (Based on 1 partial tract)
A) FHA, FSA/RHS & VA Home Purchase Loans
B) Conventional Home Purchase Loans
C) Refinancings
D) Home Improvement Loans
F) Non-occupant Loans on < 5 Family Dwellings (A B C & D)
Detailed PMIC statistics for the following Tracts:0427.20
2006 - 2018 National Fire Incident Reporting System (NFIRS) incidents
Based on the data from the years 2006 - 2018 the average number of fire incidents per year is 32. The highest number of fires - 49 took place in 2018, and the least - 7 in 2006. The data has an increasing trend.
When looking into fire subcategories, the most incidents belonged to: Outside Fires (59.7%), and Structure Fires (18.7%).
Fire incident types reported to NFIRS in Zip Code 92548
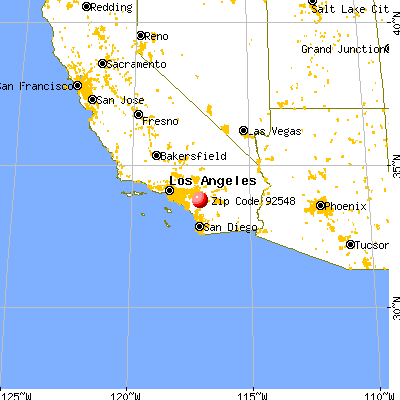


 Nearest zip codes: 92567, 92585, 92545, 92586, 92582, 92596.
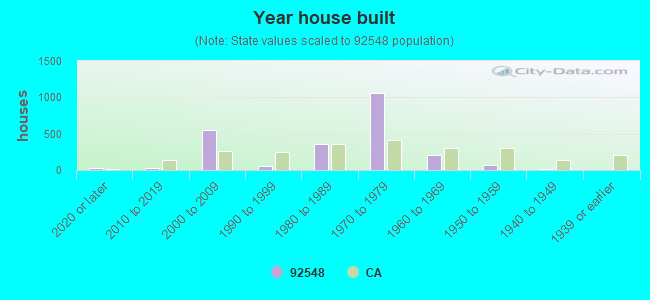


 Based on the data from the years 2006 - 2018 the average number of fire incidents per year is 32. The highest number of fires - 49 took place in 2018, and the least - 7 in 2006. The data has an increasing trend.
 When looking into fire subcategories, the most incidents belonged to: Outside Fires (59.7%), and Structure Fires (18.7%).