Estimated zip code population in 2022: 36,024 Zip code population in 2010: 30,815 Zip code population in 2000: 22,963
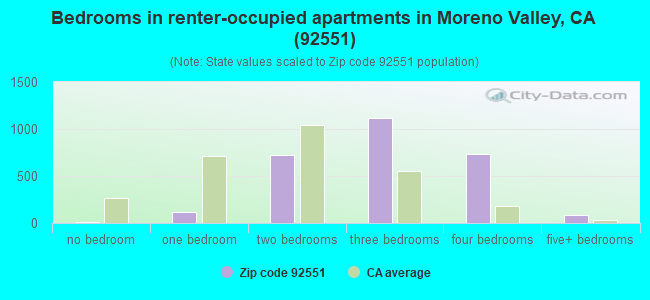
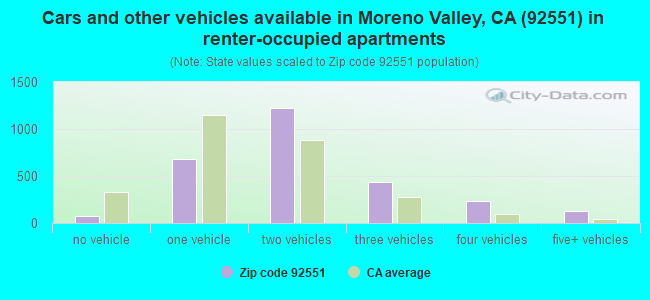
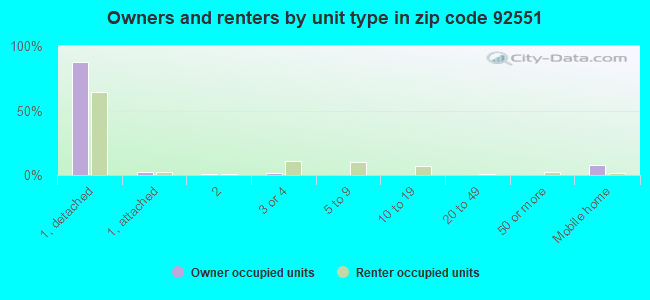
Houses and condos: 8,711 Renter-occupied apartments: 2,784
% of renters here:
33%
State:
44%
March 2022 cost of living index in zip code 92551: 81.6 (low, U.S. average is 100)
Land area: 5.9 sq. mi. Water area: 0.1 sq. mi.
Population density: 6,134 people per square mile
(high).
OSM Map
General Map
Google Map
MSN Map
OSM Map
General Map
Google Map
MSN Map
OSM Map
General Map
Google Map
MSN Map
OSM Map
General Map
Google Map
MSN Map
Please wait while loading the map...
Real estate property taxes paid for housing units in 2022:
This zip code:
0.7% ($2,871)
California:
0.7% ($4,831)
Median real estate property taxes paid for housing units with mortgages in 2022: $2,987 (0.7%) Median real estate property taxes paid for housing units with no mortgage in 2022: $2,361 (0.6%)
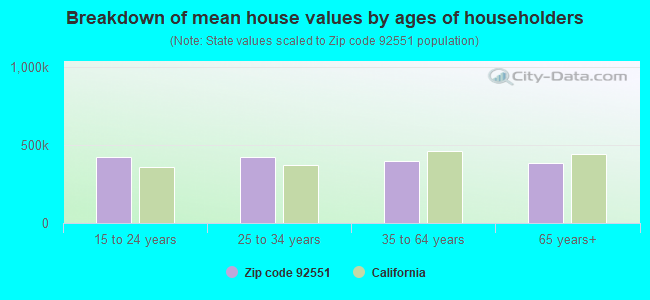
Estimated median house/condo value in 2022: $424,784
92551:
$424,784
California:
$715,900
According to our research of California and other state lists, there were 50 registered sex offenders living in 92551 zip code as of April 27, 2024. The ratio of all residents to sex offenders in zip code 92551 is 683 to 1. The ratio of registered sex offenders to all residents in this zip code is near the state average.
Median resident age:
This zip code:
30.5 years
California median age:
37.9 years
Average household size:
This zip code:
4.2 people
California:
2.8 people
Averages for the 2020 tax year for zip code 92551, filed in 2021:
Average Adjusted Gross Income (AGI) in 2020: $44,495 (Individual Income Tax Returns)
Here:
$44,495
State:
$95,910
Salary/wage: $42,236 (reported on 88.1% of returns)
Here:
$42,236
State:
$77,331
(% of AGI for various income ranges: 1182.8% for AGIs below $25k, 3945.4% for AGIs $25k-50k, 7540.2% for AGIs $50k-75k, 11018.5% for AGIs $75k-100k, 19473.4% for AGIs $100k-200k, 84845.0% for AGIs over 200k)
Taxable interest for individuals: $254 (reported on 22.4% of returns)
This zip code:
$254
California:
$2,294
(% of AGI for various income ranges: 2.8% for AGIs below $25k, 4.6% for AGIs $25k-50k, 7.5% for AGIs $50k-75k, 20.9% for AGIs $75k-100k, 37.4% for AGIs $100k-200k, 100.0% for AGIs over 200k)
Ordinary dividends: $734 (reported on 3.2% of returns)
Here:
$734
State:
$10,949
(% of AGI for various income ranges: 0.8% for AGIs below $25k, 1.6% for AGIs $25k-50k, 3.5% for AGIs $50k-75k, 10.3% for AGIs $75k-100k, 17.8% for AGIs $100k-200k)
Net capital gain/loss in AGI: +$2,371 (reported on 4.4% of returns)
Here:
+$2,371
State:
+$49,306
(% of AGI for various income ranges: 0.4% for AGIs below $25k, 2.1% for AGIs $25k-50k, 9.9% for AGIs $50k-75k, 16.0% for AGIs $75k-100k, 187.4% for AGIs $100k-200k)
Profit/loss from business: +$6,963 (reported on 15.8% of returns)
Here:
+$6,963
State:
+$15,671
(% of AGI for various income ranges: 148.3% for AGIs below $25k, 107.3% for AGIs $25k-50k, 165.7% for AGIs $50k-75k, 126.7% for AGIs $75k-100k, 383.2% for AGIs $100k-200k)
Taxable individual retirement arrangement distribution: $13,954 (reported on 1.7% of returns)
92551:
$13,954
California:
$23,505
(% of AGI for various income ranges: 7.9% for AGIs below $25k, 8.6% for AGIs $25k-50k, 39.2% for AGIs $50k-75k, 100.2% for AGIs $75k-100k, 206.5% for AGIs $100k-200k)
Total itemized deductions: $26,800 (reported on 9.7% of returns)
Here:
$26,800
State:
$39,517
(% of AGI for various income ranges: 31.2% for AGIs below $25k, 174.8% for AGIs $25k-50k, 593.7% for AGIs $50k-75k, 1005.1% for AGIs $75k-100k, 1757.7% for AGIs $100k-200k, 6765.0% for AGIs over 200k)
Charity contributions: $5,992 (reported on 7.7% of returns)
Here:
$5,992
State:
$12,598
(% of AGI for various income ranges: 2.2% for AGIs below $25k, 26.8% for AGIs $25k-50k, 90.5% for AGIs $50k-75k, 157.5% for AGIs $75k-100k, 385.4% for AGIs $100k-200k, 2645.0% for AGIs over 200k)
Taxes paid: $7,470 (reported on 9.7% of returns)
92551:
$7,470
State:
$8,807
(% of AGI for various income ranges: 7.4% for AGIs below $25k, 39.7% for AGIs $25k-50k, 164.2% for AGIs $50k-75k, 305.7% for AGIs $75k-100k, 528.8% for AGIs $100k-200k, 1595.0% for AGIs over 200k)
Earned income credit: $2,402 (reported on 24.3% of returns)
Here:
$2,402
State:
$2,074
(% of AGI for various income ranges: 126.4% for AGIs below $25k, 91.0% for AGIs $25k-50k, 1.6% for AGIs $50k-75k)
Percentage of individuals using paid preparers for their 2020 taxes: 93.2%
Here:
93%
State:
92%
(% for various income ranges: 92.2% for AGIs below $25k, 94.0% for AGIs $25k-50k, 93.4% for AGIs $50k-75k, 93.5% for AGIs $75k-100k, 93.2% for AGIs $100k-200k, 100.0% for AGIs over 200k)
Averages for the 2012 tax year for zip code 92551, filed in 2013:
Average Adjusted Gross Income (AGI) in 2012: $36,040 (Individual Income Tax Returns)
Here:
$36,040
State:
$72,726
Salary/wage: $35,121 (reported on 87.5% of returns)
Here:
$35,121
State:
$59,079
(% of AGI for various income ranges: 74.8% for AGIs below $25k, 88.6% for AGIs $25k-50k, 89.4% for AGIs $50k-75k, 87.5% for AGIs $75k-100k, 89.7% for AGIs $100k-200k)
Taxable interest for individuals: $215 (reported on 21.9% of returns)
This zip code:
$215
California:
$2,146
(% of AGI for various income ranges: 0.2% for AGIs below $25k, 0.1% for AGIs $25k-50k, 0.1% for AGIs $50k-75k, 0.2% for AGIs $100k-200k)
Ordinary dividends: $627 (reported on 3.4% of returns)
Here:
$627
State:
$9,308
(% of AGI for various income ranges: 0.1% for AGIs $100k-200k)
Profit/loss from business: +$7,493 (reported on 16.8% of returns)
Here:
+$7,493
State:
+$17,064
(% of AGI for various income ranges: 14.4% for AGIs below $25k, 2.2% for AGIs $25k-50k, 0.6% for AGIs $50k-75k, 0.5% for AGIs $75k-100k, 0.8% for AGIs $100k-200k)
Taxable individual retirement arrangement distribution: $11,269 (reported on 2.4% of returns)
92551:
$11,269
California:
$19,557
(% of AGI for various income ranges: 0.6% for AGIs below $25k, 0.5% for AGIs $25k-50k, 0.6% for AGIs $50k-75k, 1.2% for AGIs $75k-100k, 1.1% for AGIs $100k-200k)
Total itemized deductions: $19,850 (32% of AGI, reported on 29.4% of returns)
Here:
$19,850
State:
$34,004
Here:
31.7% of AGI
State:
22.7% of AGI
(% of AGI for various income ranges: 7.0% for AGIs below $25k, 14.9% for AGIs $25k-50k, 18.9% for AGIs $50k-75k, 21.4% for AGIs $75k-100k, 21.2% for AGIs $100k-200k)
Charity contributions: $2,799 (reported on 23.3% of returns)
Here:
$2,799
State:
$4,659
(% of AGI for various income ranges: 0.5% for AGIs below $25k, 1.5% for AGIs $25k-50k, 2.2% for AGIs $50k-75k, 2.5% for AGIs $75k-100k, 2.9% for AGIs $100k-200k)
Taxes paid: $4,937 (reported on 29.3% of returns)
92551:
$4,937
State:
$14,448
(% of AGI for various income ranges: 1.2% for AGIs below $25k, 3.0% for AGIs $25k-50k, 4.5% for AGIs $50k-75k, 5.7% for AGIs $75k-100k, 7.1% for AGIs $100k-200k)
Earned income credit: $2,752 (reported on 35.5% of returns)
Here:
$2,752
State:
$2,286
(% of AGI for various income ranges: 11.8% for AGIs below $25k, 2.2% for AGIs $25k-50k)
Percentage of individuals using paid preparers for their 2012 taxes: 69.5%
Here:
69%
State:
64%
(% for various income ranges: 67.1% for AGIs below $25k, 70.9% for AGIs $25k-50k, 72.1% for AGIs $50k-75k, 73.3% for AGIs $75k-100k, 75.0% for AGIs $100k-200k)
Averages for the 2004 tax year for zip code 92551, filed in 2005:
Average Adjusted Gross Income (AGI) in 2004: $36,181 (Individual Income Tax Returns)
Here:
$36,181
State:
$58,600
Salary/wage: $35,430 (reported on 91.3% of returns)
Here:
$35,430
State:
$49,455
(% of AGI for various income ranges: 87.2% for AGIs below $10k, 85.6% for AGIs $10k-25k, 90.9% for AGIs $25k-50k, 92.4% for AGIs $50k-75k, 92.7% for AGIs $75k-100k, 80.1% for AGIs over 100k)
Taxable interest for individuals: $339 (reported on 31.3% of returns)
This zip code:
$339
California:
$2,365
(% of AGI for various income ranges: 0.7% for AGIs below $10k, 0.3% for AGIs $10k-25k, 0.2% for AGIs $25k-50k, 0.2% for AGIs $50k-75k, 0.2% for AGIs $75k-100k, 0.6% for AGIs over 100k)
Taxable dividends: $517 (reported on 5.6% of returns)
Here:
$517
State:
$4,746
(% of AGI for various income ranges: 0.4% for AGIs below $10k, 0.0% for AGIs $10k-25k, 0.1% for AGIs $25k-50k, 0.1% for AGIs $50k-75k, 0.1% for AGIs $75k-100k, 0.1% for AGIs over 100k)
Net capital gain/loss: +$9,545 (reported on 4.2% of returns)
Here:
+$9,545
State:
+$23,418
(% of AGI for various income ranges: 0.3% for AGIs below $10k, -0.1% for AGIs $10k-25k, 0.2% for AGIs $25k-50k, 0.4% for AGIs $50k-75k, 1.0% for AGIs $75k-100k, 6.3% for AGIs over 100k)
Profit/loss from business: +$6,289 (reported on 14.5% of returns)
Here:
+$6,289
State:
+$16,826
(% of AGI for various income ranges: 8.8% for AGIs below $10k, 7.9% for AGIs $10k-25k, 2.8% for AGIs $25k-50k, 0.8% for AGIs $50k-75k, -0.0% for AGIs $75k-100k, 1.8% for AGIs over 100k)
IRA payment deduction: $2,093 (reported on 1.1% of returns)
92551:
$2,093
California:
$3,192
(% of AGI for various income ranges: 0.1% for AGIs $10k-25k, 0.1% for AGIs $25k-50k, 0.1% for AGIs $50k-75k, 0.1% for AGIs $75k-100k)
Total itemized deductions: $20,363 (37% of AGI, reported on 44.7% of returns)
Here:
$20,363
State:
$28,113
Here:
36.6% of AGI
State:
25.3% of AGI
(% of AGI for various income ranges: 13.7% for AGIs below $10k, 15.8% for AGIs $10k-25k, 26.4% for AGIs $25k-50k, 28.8% for AGIs $50k-75k, 27.4% for AGIs $75k-100k, 23.8% for AGIs over 100k)
Charity contributions deductions: $2,555 (4% of AGI, reported on 38.0% of returns)
Here:
$2,555
State:
$3,923
Here:
4.4% of AGI
State:
3.3% of AGI
(% of AGI for various income ranges: 0.6% for AGIs below $10k, 1.1% for AGIs $10k-25k, 2.5% for AGIs $25k-50k, 3.0% for AGIs $50k-75k, 3.5% for AGIs $75k-100k, 3.5% for AGIs over 100k)
Total tax: $3,267 (reported on 63.5% of returns)
92551:
$3,267
State:
$10,761
(% of AGI for various income ranges: 3.1% for AGIs below $10k, 3.3% for AGIs $10k-25k, 3.9% for AGIs $25k-50k, 5.3% for AGIs $50k-75k, 7.3% for AGIs $75k-100k, 12.0% for AGIs over 100k)
Earned income credit: $1,963 (reported on 26.6% of returns)
Here:
$1,963
State:
$1,763
Percentage of individuals using paid preparers for their 2004 taxes: 72.9%
Here:
73%
State:
66%
(% for various income ranges: 63.8% for AGIs below $10k, 73.5% for AGIs $10k-25k, 76.3% for AGIs $25k-50k, 74.8% for AGIs $50k-75k, 73.8% for AGIs $75k-100k, 73.3% for AGIs over 100k)
Likely homosexual households (counted as self-reported same-sex unmarried-partner households)
Lesbian couples: 0.1% of all households
Gay men: 0.2% of all households
Household received Food Stamps/SNAP in the past 12 months: 1,574 Household did not receive Food Stamps/SNAP in the past 12 months: 7,026
Women who had a birth in the past 12 months: 297 (232 now married, 65 unmarried) Women who did not have a birth in the past 12 months: 9,313 (3,640 now married, 5,675 unmarried)
Housing units in zip code 92551 with a mortgage: 4,388 (68 second mortgage, 29 both second mortgage and home equity loan) Houses without a mortgage: 12
Median monthly owner costs for units with a mortgage: $1,826 Median monthly owner costs for units without a mortgage: $657
Residents with income below the poverty level in 2022:
This zip code:
12.0%
Whole state:
12.2%
Residents with income below 50% of the poverty level in 2022:
This zip code:
7.3%
Whole state:
6.2%
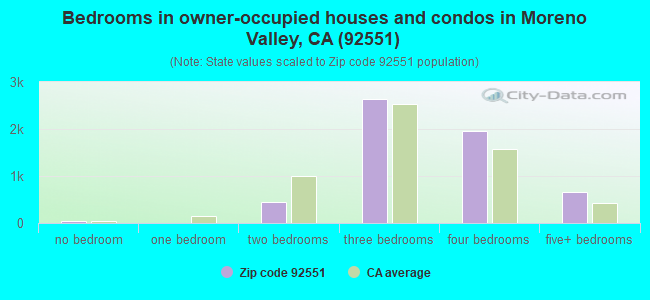
Median number of rooms in houses and condos:
Here:
6.0
State:
6.0
Median number of rooms in apartments:
Here:
5.2
State:
3.9
Notable locations in this zip code not listed on our city pages
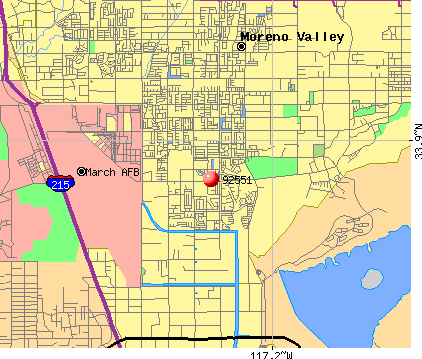
Parks in zip code 92551 include: John F Kennedy Veterans Memorial Park (1), Pedrorena Park (2), Victoriano Park (3). Display/hide their locations on the map
4,265 married couples with children.
2,699 single-parent households (1,012 men, 1,687 women).
46.5% of residents of 92551 zip code speak English at home.
48.7% of residents speak Spanish at home (60% very well, 15% well, 13% not well, 11% not at all).
0.7% of residents speak other Indo-European language at home (60% very well, 13% well, 19% not well, 8% not at all).
2.6% of residents speak Asian or Pacific Island language at home (50% very well, 35% well, 14% not well, 1% not at all).
0.9% of residents speak other language at home (48% very well, 29% well, 16% not well, 7% not at all).
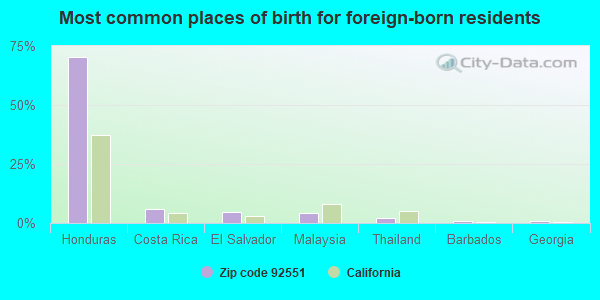
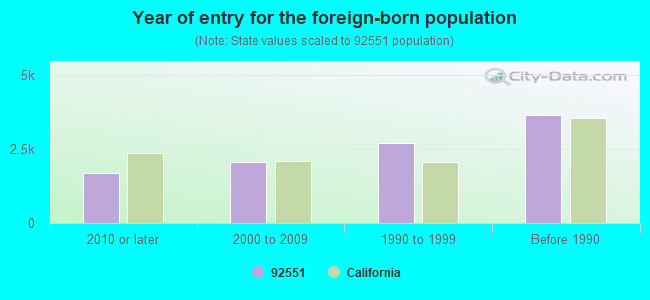
Foreign born population: 9,520 (26.4%) (46.6% of them are naturalized citizens)
Facilities with environmental interests located in this zip code:
MORENO VALLEY TRANSFER STATION (17700 INDIAN ST in MORENO VALLEY, CA)
STATE MASTER (California - Hazardous Waste Tracking) - HAZARDOU WASTE PROGRAM Small Quantity Generators, between 100 kg and 1000 kg of hazardous waste/month (Resource Conservation and Recovery Act (tracking hazardous waste)) - notification Organizations: WASTE MANAGEMENT COLLECTION INC (CONTACT/OWNER)
EL POTRERO ELEMENTARY (168 VIA PARNPLONA DR. in MORENO VALLEY, CA)
(National Center for Education Statistics) - STATE ID-6109557 Organizations: VAL VERDE UNIFIED (SCHOOL DISTRICT)
GLOBE BUSINESS FURNITURE (25100 GLOBE STREET in MORENO VALLEY, CA)
CRITERIA AND HAZARDOUS AIR POLLUTANT INVENTORY (Inventory of air pollution sources) Small Quantity Generators, between 100 kg and 1000 kg of hazardous waste/month (Resource Conservation and Recovery Act (tracking hazardous waste)) - notification TRI REPORTER (Tracking of toxic chemicals releasing facilities) Business SIC classification: WOOD OFFICE FURNITURE Alternative names: GLOBE CHAIRWORLD
HOME DEPOT USA INC HD 1087 (15975 PERRIS BLVD in MORENO VALLEY, CA)
Small Quantity Generators, between 100 kg and 1000 kg of hazardous waste/month (Resource Conservation and Recovery Act (tracking hazardous waste))
MALEK AYASS (15974 PERRIS BLVD UNIT A in MORENO VALLEY, CA)
Small Quantity Generators, between 100 kg and 1000 kg of hazardous waste/month (Resource Conservation and Recovery Act (tracking hazardous waste)) - notification
MODULAR METAL FAB (24600 NANDINA AVE in MORENO VALLEY, CA)
Small Quantity Generators, between 100 kg and 1000 kg of hazardous waste/month (Resource Conservation and Recovery Act (tracking hazardous waste)) - notification Organizations: MODULAR METAL FABRICATORS IN (CONTACT/OWNER)
EASTERN MUNICIPAL WATER DISTRI (16015 OLD PERRIS BL in MORENO VALLEY, CA)
CRITERIA AND HAZARDOUS AIR POLLUTANT INVENTORY (Inventory of air pollution sources) Business SIC classification: WATER SUPPLY
EASTERN MUNICIPAL WATER DISTRI (17550 KINE ST in MORENO VALLEY, CA)
CRITERIA AND HAZARDOUS AIR POLLUTANT INVENTORY (Inventory of air pollution sources) Business SIC classification: WATER SUPPLY
EASTERN MUNICIPAL WATER DISTRICT (17010 PERRIS BLVD. in MORENO VALLEY, CA)
AIR MAJOR (AIRS/AFS) Business SIC classification: WATER SUPPLY Alternative names: MORENO VALLEY RWRF
EASTERN MUNICIPAL WATER DISTRICT (17140 KITCHING STREET in MORENO VALLEY, CA)
CRITERIA AND HAZARDOUS AIR POLLUTANT INVENTORY (Inventory of air pollution sources) Business SIC classification: SEWERAGE SYSTEMS
KINGS CHAPEL CHRISTIAN ACADE (15795 PERRIS BLVD in MORENO VALLEY, CA)
COMPLIANCE ACTIVITY (Tracking inspections of insecticide, fungicide, and rodenticide, and toxic substances)
Housing units lacking complete plumbing facilities: 0.3% Housing units lacking complete kitchen facilities: 1.0%
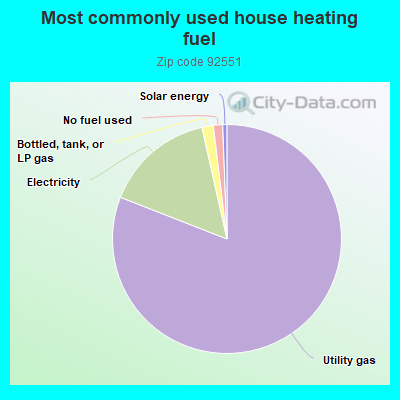
80.7%Utility gas
15.5%Electricity
1.6%Bottled, tank, or LP gas
1.3%No fuel used
0.6%Solar energy
Place of birth for U.S.-born residents:
This state: 23,293
Northeast: 387
Midwest: 544
South: 1,036
West: 640
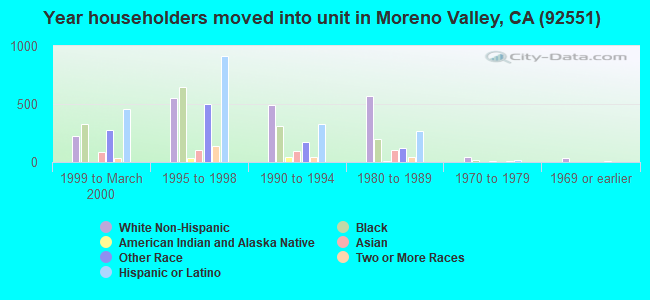
47% of the 92551 zip code residents lived in the same house 5 years ago. Out of people who lived in different houses, 58% lived in this county. Out of people who lived in different counties, 50% lived in California.
90% of the 92551 zip code residents lived in the same house 1 year ago. Out of people who lived in different houses, 46% moved from this county. Out of people who lived in different houses, 45% moved from different county within same state. Out of people who lived in different houses, 5% moved from different state. Out of people who lived in different houses, 4% moved from abroad.
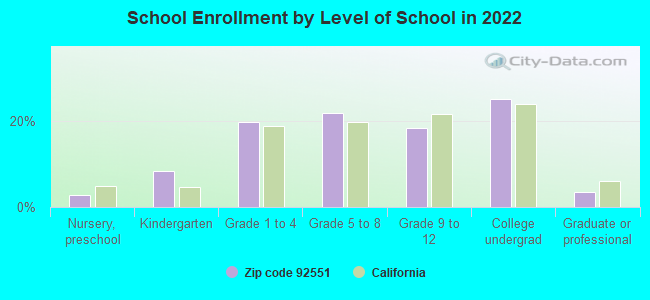
Private vs. public school enrollment:
Students in private schools in grades 1 to 8 (elementary and middle school): 295
Here:
6.7%
California:
10.5%
Students in private schools in grades 9 to 12 (high school): 141
Here:
7.2%
California:
8.5%
Students in private undergraduate colleges: 387
Here:
14.4%
California:
15.9%
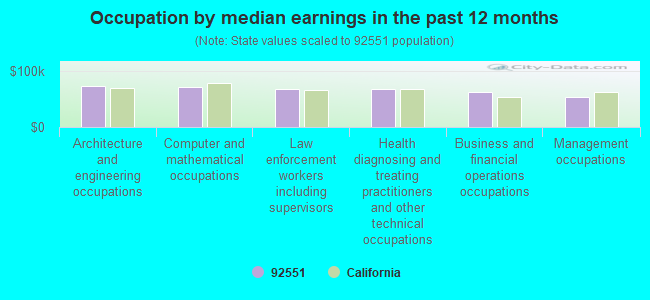
Occupation by median earnings in the past 12 months ($)
72,488Architecture and engineering occupations
71,639Computer and mathematical occupations
68,515Law enforcement workers including supervisors
67,864Health diagnosing and treating practitioners and other technical occupations
62,934Business and financial operations occupations
53,495Management occupations
Companies with federal contracts located in this zip code:
FER-MARS ELECTRO MECHANICAL SE (25825 KARISA CIRCLE in MORENO VALLEY, CA; small business) : $265,637 in 10 contractsfrom 1999 to 2005
Contracts for Maintenance, Repair and Rebuilding of Equipment -- Food Preparation and Serving Equipment, Maintenance, Repair and Rebuilding of Equipment -- Cleaning Equipment and Supplies, Laundry and Dry Cleaning Equipment, Maintenance, Repair and Rebuilding of Equipment -- Clothing, Individual Equipment, and Insignia, and moreby Navy Signed by year:2000: $109,296; 2001: $91,137; 2002: $50,204; 2003: $0; 2004: $0; 2005: -$35,000; 2006: $0.
Biggest contracts:
$60,000 with Navy for Maintenance, Repair and Rebuilding of Equipment -- Food Preparation and Serving Equipment. Signed on 2001-10-01. Completion date: 2002-09-30.
$60,000, same as above.Signed on 2000-10-01. Completion date: 2001-09-30.
$50,204 with Navy for Maintenance, Repair and Rebuilding of Equipment -- Cleaning Equipment and Supplies. Signed on 2002-09-19. Completion date: 2003-09-30.
$50,000 with Navy for Maintenance, Repair and Rebuilding of Equipment -- Food Preparation and Serving Equipment. Signed on 1999-11-01. Completion date: 2000-09-30.
WOOD CONCEPTS LIMITED (16259 PARKSIDE LANE in MORENO VALLEY, CA; small business)
$3,500 with Air Force for Equipment and Materials Testing -- Construction, Mining, Excavating, and Highway Maintenance Equipment. Signed on 2003-03-27. Completion date: 2003-04-30.
Top industries in this zip code by the number of employees in 2005:
2006 - 2018 National Fire Incident Reporting System (NFIRS) incidents
Based on the data from the years 2006 - 2018 the average number of fire incidents per year is 25. The highest number of fires - 41 took place in 2017, and the least - 9 in 2006. The data has an increasing trend.
When looking into fire subcategories, the most incidents belonged to: Outside Fires (50.2%), and Structure Fires (22.0%).
Fire incident types reported to NFIRS in Zip Code 92551

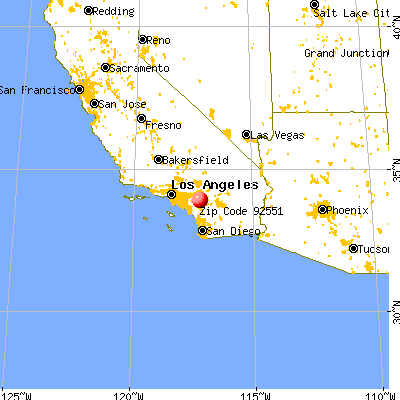


 Nearest zip codes: 92553, 92518, 92571, 92557, 92508, 92555.


 Based on the data from the years 2006 - 2018 the average number of fire incidents per year is 25. The highest number of fires - 41 took place in 2017, and the least - 9 in 2006. The data has an increasing trend.
 When looking into fire subcategories, the most incidents belonged to: Outside Fires (50.2%), and Structure Fires (22.0%).