Averages for the 2020 tax year for zip code 92518, filed in 2021:
Average Adjusted Gross Income (AGI) in 2020: $80,138 (Individual Income Tax Returns)
Here:
$80,138
State:
$95,910
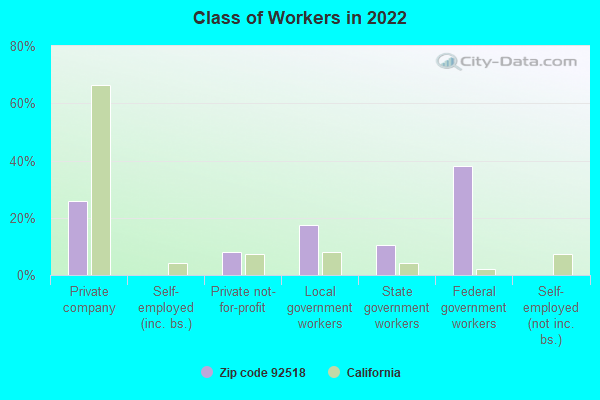
Salary/wage: $57,335 (reported on 55.4% of returns)
Here:
$57,335
State:
$77,331
(% of AGI for various income ranges: 893.3% for AGIs below $25k, 3135.0% for AGIs $25k-50k, 5378.6% for AGIs $50k-75k, 7120.0% for AGIs $75k-100k, 15698.0% for AGIs $100k-200k)
Taxable interest for individuals: $1,412 (reported on 46.4% of returns)
This zip code:
$1,412
California:
$2,294
(% of AGI for various income ranges: 7.8% for AGIs below $25k, 18.8% for AGIs $25k-50k, 37.1% for AGIs $50k-75k, 80.0% for AGIs $75k-100k, 414.0% for AGIs $100k-200k)
Ordinary dividends: $11,912 (reported on 28.6% of returns)
Here:
$11,912
State:
$10,949
(% of AGI for various income ranges: 55.6% for AGIs below $25k, 271.4% for AGIs $50k-75k, 562.5% for AGIs $75k-100k, 1344.0% for AGIs $100k-200k)
Net capital gain/loss in AGI: +$9,933 (reported on 26.8% of returns)
Here:
+$9,933
State:
+$49,306
(% of AGI for various income ranges: 117.1% for AGIs $50k-75k, 676.0% for AGIs $100k-200k)
Taxable individual retirement arrangement distribution: $18,400 (reported on 14.3% of returns)
92518:
$18,400
California:
$23,505
(% of AGI for various income ranges: 811.4% for AGIs $50k-75k, 1808.0% for AGIs $100k-200k)
Total itemized deductions: $39,154 (reported on 23.2% of returns)
Here:
$39,154
State:
$39,517
(% of AGI for various income ranges: 1614.3% for AGIs $50k-75k, 2040.0% for AGIs $75k-100k, 3902.0% for AGIs $100k-200k)
Charity contributions: $8,582 (reported on 19.6% of returns)
Here:
$8,582
State:
$12,598
(% of AGI for various income ranges: 192.5% for AGIs $25k-50k, 485.0% for AGIs $75k-100k, 1192.0% for AGIs $100k-200k)
Taxes paid: $6,308 (reported on 21.4% of returns)
92518:
$6,308
State:
$8,807
(% of AGI for various income ranges: 134.3% for AGIs $50k-75k, 342.5% for AGIs $75k-100k, 698.0% for AGIs $100k-200k)
Earned income credit: $1,450 (reported on 7.1% of returns)
Here:
$1,450
State:
$2,074
(% of AGI for various income ranges: 64.4% for AGIs below $25k)
Percentage of individuals using paid preparers for their 2020 taxes: 94.6%
Here:
95%
State:
92%
(% for various income ranges: 92.9% for AGIs below $25k, 100.0% for AGIs $25k-50k, 90.0% for AGIs $50k-75k, 85.7% for AGIs $75k-100k, 100.0% for AGIs $100k-200k, 100.0% for AGIs over 200k)
Averages for the 2012 tax year for zip code 92518, filed in 2013:
Average Adjusted Gross Income (AGI) in 2012: $73,303 (Individual Income Tax Returns)
Here:
$73,303
State:
$72,726
Salary/wage: $47,878 (reported on 46.6% of returns)
Here:
$47,878
State:
$59,079
(% of AGI for various income ranges: 59.5% for AGIs below $25k, 53.6% for AGIs $25k-50k, 43.6% for AGIs $50k-75k, 29.0% for AGIs $75k-100k, 27.6% for AGIs $100k-200k)
Taxable interest for individuals: $3,319 (reported on 55.2% of returns)
This zip code:
$3,319
California:
$2,146
(% of AGI for various income ranges: 0.4% for AGIs below $25k, 1.4% for AGIs $25k-50k, 2.7% for AGIs $50k-75k, 2.7% for AGIs $75k-100k, 3.4% for AGIs $100k-200k)
Ordinary dividends: $11,124 (reported on 43.1% of returns)
Here:
$11,124
State:
$9,308
(% of AGI for various income ranges: 4.0% for AGIs $25k-50k, 3.9% for AGIs $50k-75k, 5.8% for AGIs $75k-100k, 11.1% for AGIs $100k-200k)
Net capital gain/loss in AGI: +$1,743 (reported on 39.7% of returns)
Here:
+$1,743
State:
+$30,460
(% of AGI for various income ranges: 2.6% for AGIs $100k-200k)
Profit/loss from business: +$3,367 (reported on 5.2% of returns)
Here:
+$3,367
State:
+$17,064
Taxable individual retirement arrangement distribution: $15,171 (reported on 24.1% of returns)
92518:
$15,171
California:
$19,557
(% of AGI for various income ranges: 3.7% for AGIs $25k-50k, 2.5% for AGIs $75k-100k, 10.5% for AGIs $100k-200k)
Total itemized deductions: $29,963 (32% of AGI, reported on 60.3% of returns)
Here:
$29,963
State:
$34,004
Here:
31.6% of AGI
State:
22.7% of AGI
(% of AGI for various income ranges: 27.8% for AGIs below $25k, 26.8% for AGIs $25k-50k, 17.9% for AGIs $50k-75k, 28.0% for AGIs $75k-100k, 32.1% for AGIs $100k-200k)
Charity contributions: $4,239 (reported on 53.4% of returns)
Here:
$4,239
State:
$4,659
(% of AGI for various income ranges: 3.1% for AGIs $25k-50k, 2.0% for AGIs $50k-75k, 3.0% for AGIs $75k-100k, 4.8% for AGIs $100k-200k)
Taxes paid: $4,624 (reported on 58.6% of returns)
92518:
$4,624
State:
$14,448
(% of AGI for various income ranges: 2.2% for AGIs $25k-50k, 2.3% for AGIs $50k-75k, 3.2% for AGIs $75k-100k, 6.2% for AGIs $100k-200k)
Earned income credit: $1,900 (reported on 8.6% of returns)
Here:
$1,900
State:
$2,286
(% of AGI for various income ranges: 5.9% for AGIs below $25k)
Percentage of individuals using paid preparers for their 2012 taxes: 53.4%
Here:
53%
State:
64%
(% for various income ranges: 38.5% for AGIs below $25k, 50.0% for AGIs $25k-50k, 54.5% for AGIs $50k-75k, 54.5% for AGIs $75k-100k, 76.9% for AGIs $100k-200k)
Averages for the 2004 tax year for zip code 92518, filed in 2005:
Average Adjusted Gross Income (AGI) in 2004: $66,063 (Individual Income Tax Returns)
Here:
$66,063
State:
$58,600
Salary/wage: $38,215 (reported on 39.7% of returns)
Here:
$38,215
State:
$49,455
(% of AGI for various income ranges: 84.0% for AGIs below $10k, 49.6% for AGIs $10k-25k, 53.0% for AGIs $25k-50k, 29.3% for AGIs $50k-75k, 15.5% for AGIs $75k-100k, 9.6% for AGIs over 100k)
Taxable interest for individuals: $4,137 (reported on 72.3% of returns)
This zip code:
$4,137
California:
$2,365
(% of AGI for various income ranges: 1.3% for AGIs below $10k, 5.4% for AGIs $10k-25k, 3.7% for AGIs $25k-50k, 5.1% for AGIs $50k-75k, 4.9% for AGIs $75k-100k, 4.1% for AGIs over 100k)
Taxable dividends: $7,805 (reported on 53.8% of returns)
Here:
$7,805
State:
$4,746
(% of AGI for various income ranges: 3.7% for AGIs $10k-25k, 3.6% for AGIs $25k-50k, 6.9% for AGIs $50k-75k, 6.1% for AGIs $75k-100k, 7.5% for AGIs over 100k)
Net capital gain/loss: +$13,087 (reported on 50.2% of returns)
Here:
+$13,087
State:
+$23,418
(% of AGI for various income ranges: 1.8% for AGIs $10k-25k, -0.5% for AGIs $25k-50k, -0.6% for AGIs $50k-75k, 1.6% for AGIs $75k-100k, 27.1% for AGIs over 100k)
Total itemized deductions: $21,844 (28% of AGI, reported on 66.1% of returns)
Here:
$21,844
State:
$28,113
Here:
28.3% of AGI
State:
25.3% of AGI
(% of AGI for various income ranges: 30.3% for AGIs $10k-25k, 27.5% for AGIs $25k-50k, 25.1% for AGIs $50k-75k, 22.7% for AGIs $75k-100k, 16.7% for AGIs over 100k)
Charity contributions deductions: $3,486 (4% of AGI, reported on 62.4% of returns)
Here:
$3,486
State:
$3,923
Here:
4.4% of AGI
State:
3.3% of AGI
(% of AGI for various income ranges: 2.1% for AGIs $10k-25k, 2.3% for AGIs $25k-50k, 3.9% for AGIs $50k-75k, 3.3% for AGIs $75k-100k, 3.4% for AGIs over 100k)
Total tax: $8,345 (reported on 82.9% of returns)
92518:
$8,345
State:
$10,761
(% of AGI for various income ranges: 2.6% for AGIs $10k-25k, 6.3% for AGIs $25k-50k, 9.0% for AGIs $50k-75k, 10.5% for AGIs $75k-100k, 13.8% for AGIs over 100k)
Earned income credit: $1,714 (reported on 7.3% of returns)
Here:
$1,714
State:
$1,763
Percentage of individuals using paid preparers for their 2004 taxes: 71.2%
Here:
71%
State:
66%
(% for various income ranges: 62.0% for AGIs below $10k, 65.9% for AGIs $10k-25k, 65.1% for AGIs $25k-50k, 75.5% for AGIs $50k-75k, 73.2% for AGIs $75k-100k, 80.9% for AGIs over 100k)
Household received Food Stamps/SNAP in the past 12 months: 101 Household did not receive Food Stamps/SNAP in the past 12 months: 407
Women who had a birth in the past 12 months: 20 (20 now married, 0 unmarried) Women who did not have a birth in the past 12 months: 220 (62 now married, 158 unmarried)
Residents with income below the poverty level in 2022:
This zip code:
28.8%
Whole state:
12.2%
Residents with income below 50% of the poverty level in 2022:
This zip code:
6.9%
Whole state:
6.2%
Median number of rooms in apartments:
Here:
5.0
State:
3.9
Notable locations in this zip code not listed on our city pages
Notable locations in zip code 92518: Lieutenant General Archie J Old Junior Golf Course (A), March Field Museum (B), March Air Reserve Base Fire Department (C). Display/hide their locations on the map
Churches in zip code 92518 include: March Air Force Base Chapel (A), Inheritance Family Life Church (B), Gods House of Favor Church (C). Display/hide their locations on the map
In group quarters: 59 (-1 institutionalized population)
Size of family households: 91 2-persons, 23 3-persons, 47 4-persons, 32 5-persons
Size of nonfamily households: 206 1-person, 20 2-persons, 84 3-persons
194 married couples with children.
38 single-parent households (38 women).
89.4% of residents of 92518 zip code speak English at home.
11.2% of residents speak Spanish at home (79% very well, 21% well).
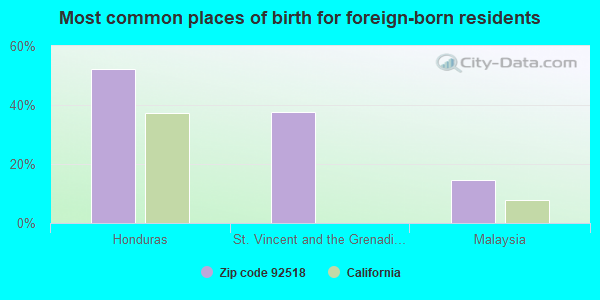
Foreign born population: 49 (4.4%) (75.8% of them are naturalized citizens)
This zip code:
4.4%
Whole state:
26.7%
52%Honduras
38%St. Vincent and the Grenadines
15%Malaysia
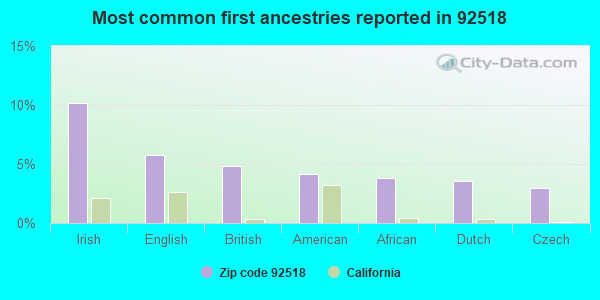
10%Irish
6%English
5%British
4%American
4%African
4%Dutch
3%Czech
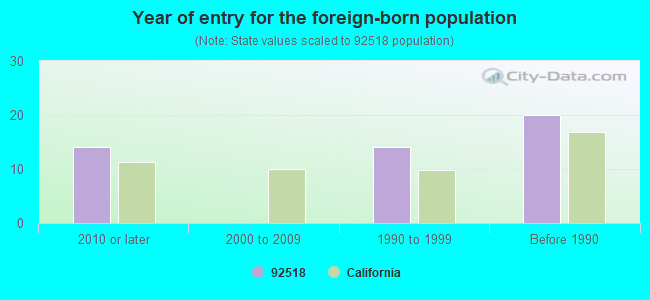
Year of entry for the foreign-born population
142010 or later
02000 to 2009
141990 to 1999
20Before 1990
Facilities with environmental interests located in this zip code:
GENERAL OLD GOLF COURSE (4106 VILLAGE WEST DR in RIVERSIDE, CA)
STATE MASTER (California - Hazardous Waste Tracking) - HAZARDOU WASTE PROGRAM Small Quantity Generators, between 100 kg and 1000 kg of hazardous waste/month (Resource Conservation and Recovery Act (tracking hazardous waste)) - notification
MARCH AIR FORCE BASE (22 CSG/CC in RIVERSIDE, CA) . Federal Facility
BRAC (Military Base Realignment and Closure)
MARCH FIELD MUSEUM FNDTN, B PI (MARCH AIR FORCE BASE in MARCH AIR FORCE BASE, CA)
CRITERIA AND HAZARDOUS AIR POLLUTANT INVENTORY (Inventory of air pollution sources) Business SIC classification: AIRCRAFT
Housing units lacking complete kitchen facilities: 1.9%
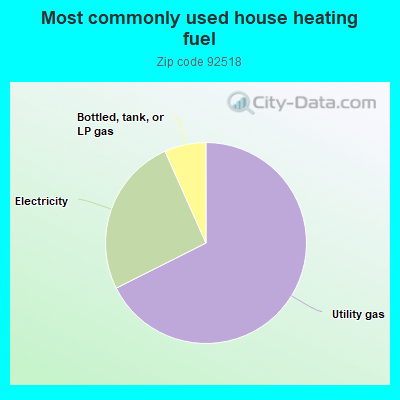
67.8%Utility gas
25.8%Electricity
6.7%Bottled, tank, or LP gas
Place of birth for U.S.-born residents:
This state: 711
Northeast: 68
Midwest: 110
South: 99
West: 75
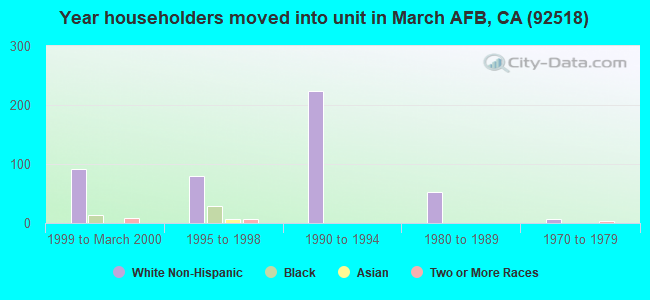
43% of the 92518 zip code residents lived in the same house 5 years ago. Out of people who lived in different houses, 39% lived in this county. Out of people who lived in different counties, 50% lived in California.
72% of the 92518 zip code residents lived in the same house 1 year ago. Out of people who lived in different houses, 76% moved from this county. Out of people who lived in different houses, 9% moved from different county within same state. Out of people who lived in different houses, 7% moved from different state.
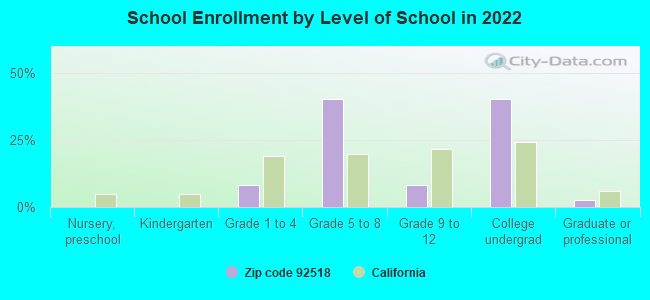
Private vs. public school enrollment:
Students in private schools in grades 1 to 8 (elementary and middle school): 16
Here:
9.3%
California:
10.5%
Students in private schools in grades 9 to 12 (high school):
Here:
0.0%
California:
8.5%
Students in private undergraduate colleges: 17
Here:
12.2%
California:
15.9%
Companies with federal contracts located in this zip code:
MARCH JOINT POWERS AUTHORITY (3430 BUNDY AVENUE, SUITE 1 in RIVERSIDE, CA) : $1,623,265 in 15 contractsfrom 2003 to 2005
Contracts for Operation Training Devices, Lease or Rental of Facilities -- Other Non-Building Facilities, Maintenance, Repair or Alteration of Real Property -- Other Conservation and Development Facilities, Facilities Operations Support Services, and moreby Navy, Air Force Signed by year:2000: $0; 2001: $0; 2002: $0; 2003: $221,102; 2004: $977,163; 2005: $425,000; 2006: $0.
Biggest contracts:
$558,091 with Navy for Operation Training Devices. Signed on 2004-09-24. Completion date: 2005-02-28.
$328,348 with Navy for Lease or Rental of Facilities -- Other Non-Building Facilities. Signed on 2004-10-27. Completion date: 2004-03-15.
$300,000 with Navy for Operation Training Devices. Signed on 2005-03-11. Completion date: 2005-08-31.
$223,200 with Navy for Lease or Rental of Facilities -- Other Non-Building Facilities. Signed on 2004-04-14. Completion date: 2004-03-15.
MARCH CLUB (BLDG 110, ADAMS SUITE in RIVERSIDE, CA; small business) : $247,038 in 7 contractsfrom 2001 to 2005
Contracts for Food Services, Special Dietary Foods and Food Specialty Preparations, Composite Food Packages, Construction of Structures and Facilities -- Dining Facilities, and moreby Navy, Army Signed by year:2000: $0; 2001: $45,500; 2002: $0; 2003: $104,310; 2004: $83,893; 2005: $13,335; 2006: $0.
Biggest contracts:
$74,160 with Navy for Food Services. Signed on 2003-03-13. Completion date: 2003-04-04.
$45,500, same as above.Signed on 2001-04-04. Completion date: 2001-04-02.
$40,000 with Navy for Special Dietary Foods and Food Specialty Preparations. Signed on 2004-09-08. Completion date: 2004-12-08.
$39,000 with Navy for Composite Food Packages. Signed on 2004-02-19. Completion date: 2004-01-30.
MARCH LODGING (2035 GRAEBER STREET in RIVERSIDE, CA; small business) : $5,083 in 2 contractsfrom 2003 to 2004
$4,416 with Army for Other Professional Services. Signed on 2004-05-21. Completion date: 2004-05-22.
$667 with Army for Lodging - Hotel/Motel. Signed on 2003-11-28. Completion date: 2003-11-30.
Top industries in this zip code by the number of employees in 2005:
Health Care and Social Assistance: Continuing Care Retirement Communities (250-499 employees: 1 establishment)
Arts, Entertainment, and Recreation: Golf Courses and Country Clubs (50-99: 1, 20-49: 1)
Wholesale Trade: Electrical and Electronic Appliance, Television, and Radio Set Merchant Wholesalers (50-99: 1)
Administrative and Support and Waste Management and Remediation Services: Facilities Support Services (50-99: 1)
Information: Libraries and Archives (20-49: 1)
Professional, Scientific, and Technical Services: Public Relations Agencies (10-19: 1)
Finance and Insurance: Sales Financing (10-19: 1)
Professional, Scientific, and Technical Services: Engineering Services (5-9: 2)
People in group quarters in 2010:
107 people in workers' group living quarters and job corps centers
38 people in nursing facilities/skilled-nursing facilities
3 people in group homes intended for adults
Fatal accident statistics in 2014:
Fatal accident count: 3
Vehicles involved in fatal accidents: 7
Fatal accidents caused by drunken drivers: 2
Fatalities: 3
Persons involved in fatal accidents: 12
Pedestrians involved in fatal accidents: 0
Fatal accident statistics in 2013:
Fatal accident count: 1
Vehicles involved in fatal accidents: 2
Fatal accidents caused by drunken drivers: 1
Fatalities: 1
Persons involved in fatal accidents: 4
Pedestrians involved in fatal accidents: 0
Home Mortgage Disclosure Act Aggregated Statistics For Year 2009 (Based on 2 full tracts)
A) FHA, FSA/RHS & VA Home Purchase Loans
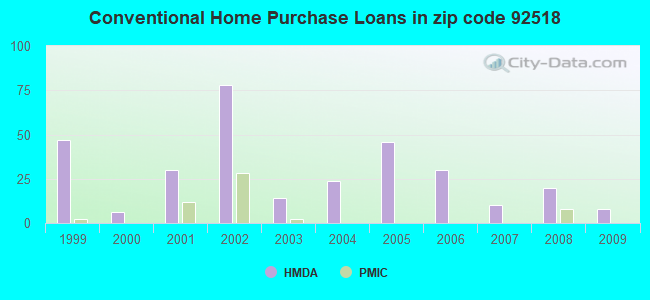
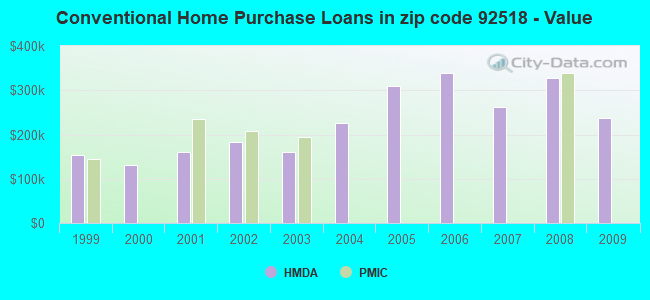
B) Conventional Home Purchase Loans
C) Refinancings
D) Home Improvement Loans
F) Non-occupant Loans on < 5 Family Dwellings (A B C & D)
Number
Average Value
Number
Average Value
Number
Average Value
Number
Average Value
Number
Average Value
LOANS ORIGINATED
4
$300,218
8
$238,088
14
$247,105
2
$210,750
6
$234,277
APPLICATIONS APPROVED, NOT ACCEPTED
2
$322,090
2
$254,490
2
$306,185
0
$0
0
$0
APPLICATIONS DENIED
2
$321,095
0
$0
4
$354,398
4
$155,578
0
$0
APPLICATIONS WITHDRAWN
4
$327,060
6
$254,490
6
$274,040
0
$0
2
$258,465
FILES CLOSED FOR INCOMPLETENESS
2
$322,090
0
$0
0
$0
0
$0
0
$0
Aggregated Statistics For Year 2008 (Based on 2 full tracts)
A) FHA, FSA/RHS & VA Home Purchase Loans
B) Conventional Home Purchase Loans
C) Refinancings
D) Home Improvement Loans
F) Non-occupant Loans on < 5 Family Dwellings (A B C & D)
Number
Average Value
Number
Average Value
Number
Average Value
Number
Average Value
Number
Average Value
LOANS ORIGINATED
0
$0
20
$328,053
6
$197,827
0
$0
4
$283,815
APPLICATIONS APPROVED, NOT ACCEPTED
0
$0
0
$0
2
$40,760
0
$0
0
$0
APPLICATIONS DENIED
6
$373,782
4
$352,905
22
$297,417
8
$144,145
4
$221,188
APPLICATIONS WITHDRAWN
0
$0
4
$261,945
4
$360,858
0
$0
4
$232,620
FILES CLOSED FOR INCOMPLETENESS
0
$0
2
$361,850
0
$0
0
$0
0
$0
Aggregated Statistics For Year 2007 (Based on 2 full tracts)
B) Conventional Home Purchase Loans
C) Refinancings
D) Home Improvement Loans
F) Non-occupant Loans on < 5 Family Dwellings (A B C & D)
Number
Average Value
Number
Average Value
Number
Average Value
Number
Average Value
LOANS ORIGINATED
10
$261,846
54
$343,959
10
$160,845
2
$155,080
APPLICATIONS APPROVED, NOT ACCEPTED
2
$534,825
22
$327,872
2
$69,585
0
$0
APPLICATIONS DENIED
14
$276,360
44
$340,660
6
$262,773
0
$0
APPLICATIONS WITHDRAWN
6
$362,847
16
$335,384
0
$0
0
$0
FILES CLOSED FOR INCOMPLETENESS
2
$372,785
6
$343,297
2
$397,640
0
$0
Aggregated Statistics For Year 2006 (Based on 2 full tracts)
B) Conventional Home Purchase Loans
C) Refinancings
D) Home Improvement Loans
F) Non-occupant Loans on < 5 Family Dwellings (A B C & D)
Number
Average Value
Number
Average Value
Number
Average Value
Number
Average Value
LOANS ORIGINATED
30
$339,518
58
$348,004
16
$255,732
0
$0
APPLICATIONS APPROVED, NOT ACCEPTED
2
$395,650
20
$411,358
0
$0
2
$566,635
APPLICATIONS DENIED
12
$423,321
36
$367,154
20
$125,456
0
$0
APPLICATIONS WITHDRAWN
4
$345,450
40
$427,264
2
$34,795
4
$551,725
FILES CLOSED FOR INCOMPLETENESS
6
$356,550
2
$470,210
0
$0
4
$328,052
Aggregated Statistics For Year 2005 (Based on 2 full tracts)
A) FHA, FSA/RHS & VA Home Purchase Loans
B) Conventional Home Purchase Loans
C) Refinancings
D) Home Improvement Loans
F) Non-occupant Loans on < 5 Family Dwellings (A B C & D)
Number
Average Value
Number
Average Value
Number
Average Value
Number
Average Value
Number
Average Value
LOANS ORIGINATED
0
$0
46
$310,159
72
$361,300
12
$125,919
2
$465,240
APPLICATIONS APPROVED, NOT ACCEPTED
0
$0
0
$0
2
$395,650
0
$0
0
$0
APPLICATIONS DENIED
0
$0
28
$359,935
34
$366,472
14
$182,914
0
$0
APPLICATIONS WITHDRAWN
2
$183,910
16
$286,425
26
$447,422
0
$0
0
$0
FILES CLOSED FOR INCOMPLETENESS
0
$0
2
$500,030
6
$490,423
0
$0
0
$0
Aggregated Statistics For Year 2004 (Based on 2 full tracts)
B) Conventional Home Purchase Loans
C) Refinancings
D) Home Improvement Loans
F) Non-occupant Loans on < 5 Family Dwellings (A B C & D)
G) Loans On Manufactured Home Dwelling (A B C & D)
Number
Average Value
Number
Average Value
Number
Average Value
Number
Average Value
Number
Average Value
LOANS ORIGINATED
24
$225,495
14
$257,756
6
$50,037
4
$301,710
0
$0
APPLICATIONS APPROVED, NOT ACCEPTED
2
$317,120
2
$173,970
0
$0
0
$0
0
$0
APPLICATIONS DENIED
4
$180,925
18
$148,563
2
$99,410
2
$143,150
2
$139,175
APPLICATIONS WITHDRAWN
4
$165,518
2
$149,115
0
$0
2
$149,115
0
$0
FILES CLOSED FOR INCOMPLETENESS
2
$48,710
0
$0
0
$0
0
$0
0
$0
Aggregated Statistics For Year 2003 (Based on 2 full tracts)
B) Conventional Home Purchase Loans
C) Refinancings
D) Home Improvement Loans
F) Non-occupant Loans on < 5 Family Dwellings (A B C & D)
Number
Average Value
Number
Average Value
Number
Average Value
Number
Average Value
LOANS ORIGINATED
14
$160,334
18
$255,926
2
$30,815
0
$0
APPLICATIONS APPROVED, NOT ACCEPTED
6
$125,920
8
$226,655
2
$34,795
0
$0
APPLICATIONS DENIED
12
$174,133
6
$226,987
2
$40,760
2
$179,930
APPLICATIONS WITHDRAWN
0
$0
2
$366,825
0
$0
0
$0
FILES CLOSED FOR INCOMPLETENESS
0
$0
0
$0
0
$0
0
$0
Aggregated Statistics For Year 2002 (Based on 2 full tracts)
A) FHA, FSA/RHS & VA Home Purchase Loans
B) Conventional Home Purchase Loans
C) Refinancings
D) Home Improvement Loans
E) Loans on Dwellings For 5+ Families
F) Non-occupant Loans on < 5 Family Dwellings (A B C & D)
Number
Average Value
Number
Average Value
Number
Average Value
Number
Average Value
Number
Average Value
Number
Average Value
LOANS ORIGINATED
2
$4,970
78
$182,914
30
$192,988
14
$36,498
2
$914,570
4
$193,352
APPLICATIONS APPROVED, NOT ACCEPTED
0
$0
10
$172,377
2
$174,960
12
$37,444
0
$0
2
$174,960
APPLICATIONS DENIED
0
$0
6
$170,985
10
$74,359
12
$34,793
0
$0
0
$0
APPLICATIONS WITHDRAWN
0
$0
8
$163,281
18
$162,922
0
$0
0
$0
0
$0
FILES CLOSED FOR INCOMPLETENESS
0
$0
2
$256,480
2
$270,395
0
$0
0
$0
0
$0
Aggregated Statistics For Year 2001 (Based on 2 full tracts)
A) FHA, FSA/RHS & VA Home Purchase Loans
B) Conventional Home Purchase Loans
C) Refinancings
D) Home Improvement Loans
F) Non-occupant Loans on < 5 Family Dwellings (A B C & D)
Number
Average Value
Number
Average Value
Number
Average Value
Number
Average Value
Number
Average Value
LOANS ORIGINATED
0
$0
30
$159,586
8
$186,642
0
$0
4
$122,772
APPLICATIONS APPROVED, NOT ACCEPTED
0
$0
0
$0
0
$0
0
$0
0
$0
APPLICATIONS DENIED
2
$163,030
12
$104,712
2
$187,885
2
$2,980
0
$0
APPLICATIONS WITHDRAWN
2
$166,015
0
$0
4
$86,488
2
$12,925
0
$0
FILES CLOSED FOR INCOMPLETENESS
0
$0
0
$0
0
$0
0
$0
0
$0
Aggregated Statistics For Year 2000 (Based on 2 full tracts)
A) FHA, FSA/RHS & VA Home Purchase Loans
B) Conventional Home Purchase Loans
C) Refinancings
D) Home Improvement Loans
Number
Average Value
Number
Average Value
Number
Average Value
Number
Average Value
LOANS ORIGINATED
2
$167,010
6
$131,883
2
$34,795
2
$24,850
APPLICATIONS APPROVED, NOT ACCEPTED
0
$0
0
$0
0
$0
0
$0
APPLICATIONS DENIED
0
$0
0
$0
2
$16,900
2
$9,940
APPLICATIONS WITHDRAWN
0
$0
4
$104,380
0
$0
2
$29,825
FILES CLOSED FOR INCOMPLETENESS
0
$0
0
$0
0
$0
0
$0
Aggregated Statistics For Year 1999 (Based on 1 full tract)
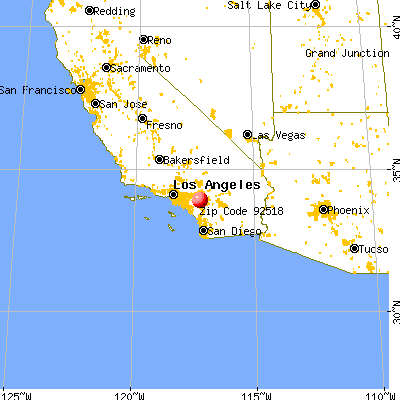


 Nearest zip codes: 92553, 92508, 92551, 92557, 92571, 92507.