Cudahy, California Submit your own pictures of this city and show them to the world
OSM Map
General Map
Google Map
MSN Map
OSM Map
General Map
Google Map
MSN Map
OSM Map
General Map
Google Map
MSN Map
OSM Map
General Map
Google Map
MSN Map
Please wait while loading the map...
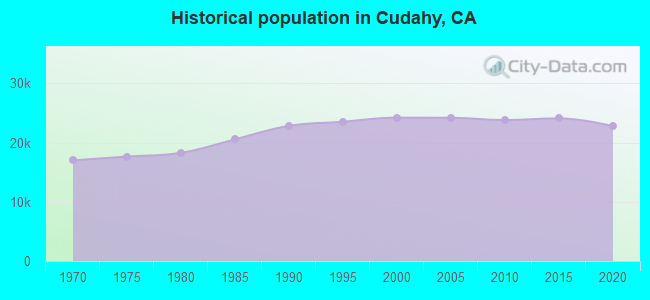
Population in 2022: 21,969 (100% urban, 0% rural). Population change since 2000: -9.2%Males: 10,823 Females: 11,146
March 2022 cost of living index in Cudahy: 138.8 (high, U.S. average is 100) Percentage of residents living in poverty in 2022: 26.7%for White Non-Hispanic residents , 6.8% for Black residents , 26.7% for Hispanic or Latino residents , 32.8% for American Indian residents , 100.0% for Native Hawaiian and other Pacific Islander residents , 23.3% for other race residents , 30.0% for two or more races residents )
Profiles of local businesses
Business Search - 14 Million verified businesses
Data:
Median household income ($)
Median household income (% change since 2000)
Household income diversity
Ratio of average income to average house value (%)
Ratio of average income to average rent
Median household income ($) - White
Median household income ($) - Black or African American
Median household income ($) - Asian
Median household income ($) - Hispanic or Latino
Median household income ($) - American Indian and Alaska Native
Median household income ($) - Multirace
Median household income ($) - Other Race
Median household income for houses/condos with a mortgage ($)
Median household income for apartments without a mortgage ($)
Races - White alone (%)
Races - White alone (% change since 2000)
Races - Black alone (%)
Races - Black alone (% change since 2000)
Races - American Indian alone (%)
Races - American Indian alone (% change since 2000)
Races - Asian alone (%)
Races - Asian alone (% change since 2000)
Races - Hispanic (%)
Races - Hispanic (% change since 2000)
Races - Native Hawaiian and Other Pacific Islander alone (%)
Races - Native Hawaiian and Other Pacific Islander alone (% change since 2000)
Races - Two or more races (%)
Races - Two or more races (% change since 2000)
Races - Other race alone (%)
Races - Other race alone (% change since 2000)
Racial diversity
Unemployment (%)
Unemployment (% change since 2000)
Unemployment (%) - White
Unemployment (%) - Black or African American
Unemployment (%) - Asian
Unemployment (%) - Hispanic or Latino
Unemployment (%) - American Indian and Alaska Native
Unemployment (%) - Multirace
Unemployment (%) - Other Race
Population density (people per square mile)
Population - Males (%)
Population - Females (%)
Population - Males (%) - White
Population - Males (%) - Black or African American
Population - Males (%) - Asian
Population - Males (%) - Hispanic or Latino
Population - Males (%) - American Indian and Alaska Native
Population - Males (%) - Multirace
Population - Males (%) - Other Race
Population - Females (%) - White
Population - Females (%) - Black or African American
Population - Females (%) - Asian
Population - Females (%) - Hispanic or Latino
Population - Females (%) - American Indian and Alaska Native
Population - Females (%) - Multirace
Population - Females (%) - Other Race
Coronavirus confirmed cases (Apr 27, 2024)
Deaths caused by coronavirus (Apr 27, 2024)
Coronavirus confirmed cases (per 100k population) (Apr 27, 2024)
Deaths caused by coronavirus (per 100k population) (Apr 27, 2024)
Daily increase in number of cases (Apr 27, 2024)
Weekly increase in number of cases (Apr 27, 2024)
Cases doubled (in days) (Apr 27, 2024)
Hospitalized patients (Apr 18, 2022)
Negative test results (Apr 18, 2022)
Total test results (Apr 18, 2022)
COVID Vaccine doses distributed (per 100k population) (Sep 19, 2023)
COVID Vaccine doses administered (per 100k population) (Sep 19, 2023)
COVID Vaccine doses distributed (Sep 19, 2023)
COVID Vaccine doses administered (Sep 19, 2023)
Likely homosexual households (%)
Likely homosexual households (% change since 2000)
Likely homosexual households - Lesbian couples (%)
Likely homosexual households - Lesbian couples (% change since 2000)
Likely homosexual households - Gay men (%)
Likely homosexual households - Gay men (% change since 2000)
Cost of living index
Median gross rent ($)
Median contract rent ($)
Median monthly housing costs ($)
Median house or condo value ($)
Median house or condo value ($ change since 2000)
Mean house or condo value by units in structure - 1, detached ($)
Mean house or condo value by units in structure - 1, attached ($)
Mean house or condo value by units in structure - 2 ($)
Mean house or condo value by units in structure by units in structure - 3 or 4 ($)
Mean house or condo value by units in structure - 5 or more ($)
Mean house or condo value by units in structure - Boat, RV, van, etc. ($)
Mean house or condo value by units in structure - Mobile home ($)
Median house or condo value ($) - White
Median house or condo value ($) - Black or African American
Median house or condo value ($) - Asian
Median house or condo value ($) - Hispanic or Latino
Median house or condo value ($) - American Indian and Alaska Native
Median house or condo value ($) - Multirace
Median house or condo value ($) - Other Race
Median resident age
Resident age diversity
Median resident age - Males
Median resident age - Females
Median resident age - White
Median resident age - Black or African American
Median resident age - Asian
Median resident age - Hispanic or Latino
Median resident age - American Indian and Alaska Native
Median resident age - Multirace
Median resident age - Other Race
Median resident age - Males - White
Median resident age - Males - Black or African American
Median resident age - Males - Asian
Median resident age - Males - Hispanic or Latino
Median resident age - Males - American Indian and Alaska Native
Median resident age - Males - Multirace
Median resident age - Males - Other Race
Median resident age - Females - White
Median resident age - Females - Black or African American
Median resident age - Females - Asian
Median resident age - Females - Hispanic or Latino
Median resident age - Females - American Indian and Alaska Native
Median resident age - Females - Multirace
Median resident age - Females - Other Race
Commute - mean travel time to work (minutes)
Travel time to work - Less than 5 minutes (%)
Travel time to work - Less than 5 minutes (% change since 2000)
Travel time to work - 5 to 9 minutes (%)
Travel time to work - 5 to 9 minutes (% change since 2000)
Travel time to work - 10 to 19 minutes (%)
Travel time to work - 10 to 19 minutes (% change since 2000)
Travel time to work - 20 to 29 minutes (%)
Travel time to work - 20 to 29 minutes (% change since 2000)
Travel time to work - 30 to 39 minutes (%)
Travel time to work - 30 to 39 minutes (% change since 2000)
Travel time to work - 40 to 59 minutes (%)
Travel time to work - 40 to 59 minutes (% change since 2000)
Travel time to work - 60 to 89 minutes (%)
Travel time to work - 60 to 89 minutes (% change since 2000)
Travel time to work - 90 or more minutes (%)
Travel time to work - 90 or more minutes (% change since 2000)
Marital status - Never married (%)
Marital status - Now married (%)
Marital status - Separated (%)
Marital status - Widowed (%)
Marital status - Divorced (%)
Median family income ($)
Median family income (% change since 2000)
Median non-family income ($)
Median non-family income (% change since 2000)
Median per capita income ($)
Median per capita income (% change since 2000)
Median family income ($) - White
Median family income ($) - Black or African American
Median family income ($) - Asian
Median family income ($) - Hispanic or Latino
Median family income ($) - American Indian and Alaska Native
Median family income ($) - Multirace
Median family income ($) - Other Race
Median year house/condo built
Median year apartment built
Year house built - Built 2005 or later (%)
Year house built - Built 2000 to 2004 (%)
Year house built - Built 1990 to 1999 (%)
Year house built - Built 1980 to 1989 (%)
Year house built - Built 1970 to 1979 (%)
Year house built - Built 1960 to 1969 (%)
Year house built - Built 1950 to 1959 (%)
Year house built - Built 1940 to 1949 (%)
Year house built - Built 1939 or earlier (%)
Average household size
Household density (households per square mile)
Average household size - White
Average household size - Black or African American
Average household size - Asian
Average household size - Hispanic or Latino
Average household size - American Indian and Alaska Native
Average household size - Multirace
Average household size - Other Race
Occupied housing units (%)
Vacant housing units (%)
Owner occupied housing units (%)
Renter occupied housing units (%)
Vacancy status - For rent (%)
Vacancy status - For sale only (%)
Vacancy status - Rented or sold, not occupied (%)
Vacancy status - For seasonal, recreational, or occasional use (%)
Vacancy status - For migrant workers (%)
Vacancy status - Other vacant (%)
Residents with income below the poverty level (%)
Residents with income below 50% of the poverty level (%)
Children below poverty level (%)
Poor families by family type - Married-couple family (%)
Poor families by family type - Male, no wife present (%)
Poor families by family type - Female, no husband present (%)
Poverty status for native-born residents (%)
Poverty status for foreign-born residents (%)
Poverty among high school graduates not in families (%)
Poverty among people who did not graduate high school not in families (%)
Residents with income below the poverty level (%) - White
Residents with income below the poverty level (%) - Black or African American
Residents with income below the poverty level (%) - Asian
Residents with income below the poverty level (%) - Hispanic or Latino
Residents with income below the poverty level (%) - American Indian and Alaska Native
Residents with income below the poverty level (%) - Multirace
Residents with income below the poverty level (%) - Other Race
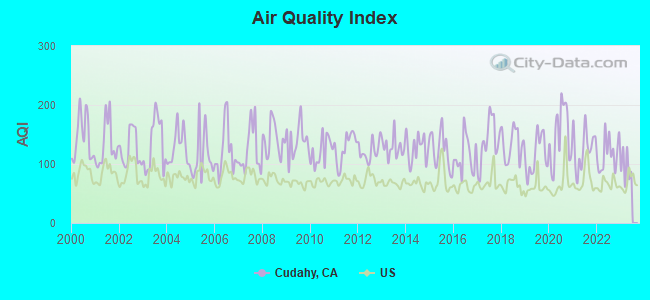
Air pollution - Air Quality Index (AQI)
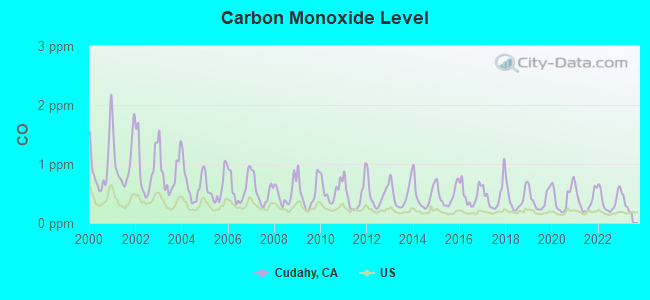
Air pollution - CO
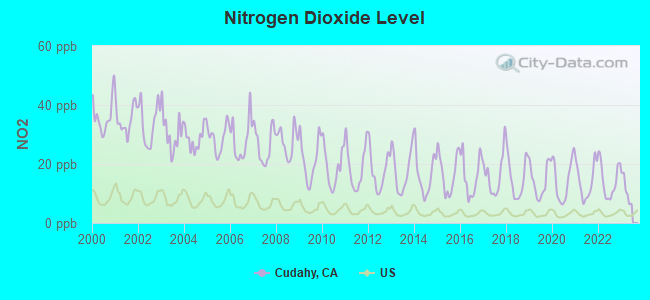
Air pollution - NO2
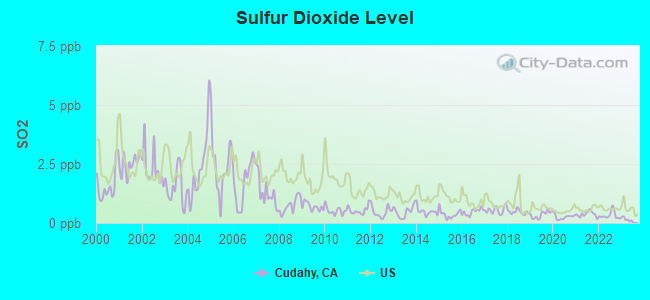
Air pollution - SO2
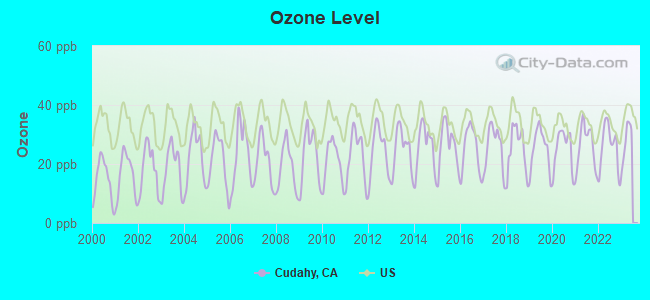
Air pollution - Ozone
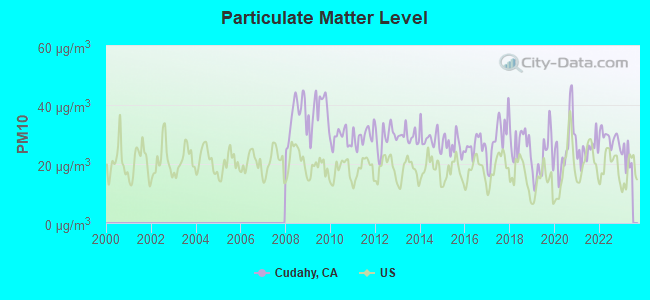
Air pollution - PM10
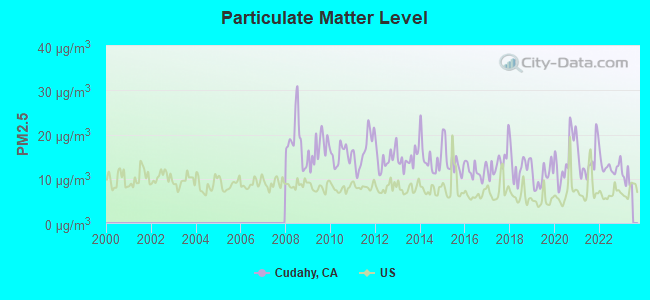
Air pollution - PM25
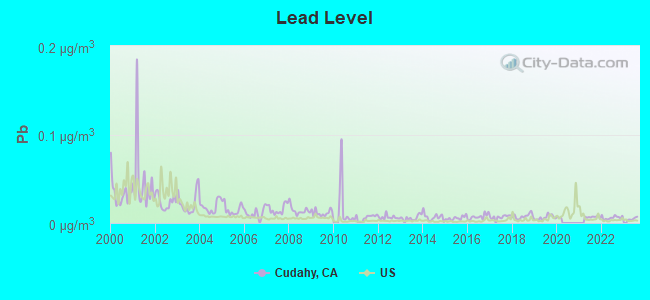
Air pollution - Pb
Crime - Murders per 100,000 population
Crime - Rapes per 100,000 population
Crime - Robberies per 100,000 population
Crime - Assaults per 100,000 population
Crime - Burglaries per 100,000 population
Crime - Thefts per 100,000 population
Crime - Auto thefts per 100,000 population
Crime - Arson per 100,000 population
Crime - City-data.com crime index
Crime - Violent crime index
Crime - Property crime index
Crime - Murders per 100,000 population (5 year average)
Crime - Rapes per 100,000 population (5 year average)
Crime - Robberies per 100,000 population (5 year average)
Crime - Assaults per 100,000 population (5 year average)
Crime - Burglaries per 100,000 population (5 year average)
Crime - Thefts per 100,000 population (5 year average)
Crime - Auto thefts per 100,000 population (5 year average)
Crime - Arson per 100,000 population (5 year average)
Crime - City-data.com crime index (5 year average)
Crime - Violent crime index (5 year average)
Crime - Property crime index (5 year average)
1996 Presidential Elections Results (%) - Democratic Party (Clinton)
1996 Presidential Elections Results (%) - Republican Party (Dole)
1996 Presidential Elections Results (%) - Other
2000 Presidential Elections Results (%) - Democratic Party (Gore)
2000 Presidential Elections Results (%) - Republican Party (Bush)
2000 Presidential Elections Results (%) - Other
2004 Presidential Elections Results (%) - Democratic Party (Kerry)
2004 Presidential Elections Results (%) - Republican Party (Bush)
2004 Presidential Elections Results (%) - Other
2008 Presidential Elections Results (%) - Democratic Party (Obama)
2008 Presidential Elections Results (%) - Republican Party (McCain)
2008 Presidential Elections Results (%) - Other
2012 Presidential Elections Results (%) - Democratic Party (Obama)
2012 Presidential Elections Results (%) - Republican Party (Romney)
2012 Presidential Elections Results (%) - Other
2016 Presidential Elections Results (%) - Democratic Party (Clinton)
2016 Presidential Elections Results (%) - Republican Party (Trump)
2016 Presidential Elections Results (%) - Other
2020 Presidential Elections Results (%) - Democratic Party (Biden)
2020 Presidential Elections Results (%) - Republican Party (Trump)
2020 Presidential Elections Results (%) - Other
Ancestries Reported - Arab (%)
Ancestries Reported - Czech (%)
Ancestries Reported - Danish (%)
Ancestries Reported - Dutch (%)
Ancestries Reported - English (%)
Ancestries Reported - French (%)
Ancestries Reported - French Canadian (%)
Ancestries Reported - German (%)
Ancestries Reported - Greek (%)
Ancestries Reported - Hungarian (%)
Ancestries Reported - Irish (%)
Ancestries Reported - Italian (%)
Ancestries Reported - Lithuanian (%)
Ancestries Reported - Norwegian (%)
Ancestries Reported - Polish (%)
Ancestries Reported - Portuguese (%)
Ancestries Reported - Russian (%)
Ancestries Reported - Scotch-Irish (%)
Ancestries Reported - Scottish (%)
Ancestries Reported - Slovak (%)
Ancestries Reported - Subsaharan African (%)
Ancestries Reported - Swedish (%)
Ancestries Reported - Swiss (%)
Ancestries Reported - Ukrainian (%)
Ancestries Reported - United States (%)
Ancestries Reported - Welsh (%)
Ancestries Reported - West Indian (%)
Ancestries Reported - Other (%)
Educational Attainment - No schooling completed (%)
Educational Attainment - Less than high school (%)
Educational Attainment - High school or equivalent (%)
Educational Attainment - Less than 1 year of college (%)
Educational Attainment - 1 or more years of college (%)
Educational Attainment - Associate degree (%)
Educational Attainment - Bachelor's degree (%)
Educational Attainment - Master's degree (%)
Educational Attainment - Professional school degree (%)
Educational Attainment - Doctorate degree (%)
School Enrollment - Nursery, preschool (%)
School Enrollment - Kindergarten (%)
School Enrollment - Grade 1 to 4 (%)
School Enrollment - Grade 5 to 8 (%)
School Enrollment - Grade 9 to 12 (%)
School Enrollment - College undergrad (%)
School Enrollment - Graduate or professional (%)
School Enrollment - Not enrolled in school (%)
School enrollment - Public schools (%)
School enrollment - Private schools (%)
School enrollment - Not enrolled (%)
Median number of rooms in houses and condos
Median number of rooms in apartments
Housing units lacking complete plumbing facilities (%)
Housing units lacking complete kitchen facilities (%)
Density of houses
Urban houses (%)
Rural houses (%)
Households with people 60 years and over (%)
Households with people 65 years and over (%)
Households with people 75 years and over (%)
Households with one or more nonrelatives (%)
Households with no nonrelatives (%)
Population in households (%)
Family households (%)
Nonfamily households (%)
Population in families (%)
Family households with own children (%)
Median number of bedrooms in owner occupied houses
Mean number of bedrooms in owner occupied houses
Median number of bedrooms in renter occupied houses
Mean number of bedrooms in renter occupied houses
Median number of vehichles in owner occupied houses
Mean number of vehichles in owner occupied houses
Median number of vehichles in renter occupied houses
Mean number of vehichles in renter occupied houses
Mortgage status - with mortgage (%)
Mortgage status - with second mortgage (%)
Mortgage status - with home equity loan (%)
Mortgage status - with both second mortgage and home equity loan (%)
Mortgage status - without a mortgage (%)
Average family size
Average family size - White
Average family size - Black or African American
Average family size - Asian
Average family size - Hispanic or Latino
Average family size - American Indian and Alaska Native
Average family size - Multirace
Average family size - Other Race
Geographical mobility - Same house 1 year ago (%)
Geographical mobility - Moved within same county (%)
Geographical mobility - Moved from different county within same state (%)
Geographical mobility - Moved from different state (%)
Geographical mobility - Moved from abroad (%)
Place of birth - Born in state of residence (%)
Place of birth - Born in other state (%)
Place of birth - Native, outside of US (%)
Place of birth - Foreign born (%)
Housing units in structures - 1, detached (%)
Housing units in structures - 1, attached (%)
Housing units in structures - 2 (%)
Housing units in structures - 3 or 4 (%)
Housing units in structures - 5 to 9 (%)
Housing units in structures - 10 to 19 (%)
Housing units in structures - 20 to 49 (%)
Housing units in structures - 50 or more (%)
Housing units in structures - Mobile home (%)
Housing units in structures - Boat, RV, van, etc. (%)
House/condo owner moved in on average (years ago)
Renter moved in on average (years ago)
Year householder moved into unit - Moved in 1999 to March 2000 (%)
Year householder moved into unit - Moved in 1995 to 1998 (%)
Year householder moved into unit - Moved in 1990 to 1994 (%)
Year householder moved into unit - Moved in 1980 to 1989 (%)
Year householder moved into unit - Moved in 1970 to 1979 (%)
Year householder moved into unit - Moved in 1969 or earlier (%)
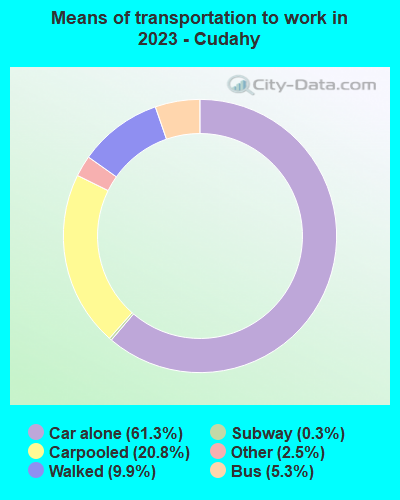
Means of transportation to work - Drove car alone (%)
Means of transportation to work - Carpooled (%)
Means of transportation to work - Public transportation (%)
Means of transportation to work - Bus or trolley bus (%)
Means of transportation to work - Streetcar or trolley car (%)
Means of transportation to work - Subway or elevated (%)
Means of transportation to work - Railroad (%)
Means of transportation to work - Ferryboat (%)
Means of transportation to work - Taxicab (%)
Means of transportation to work - Motorcycle (%)
Means of transportation to work - Bicycle (%)
Means of transportation to work - Walked (%)
Means of transportation to work - Other means (%)
Working at home (%)
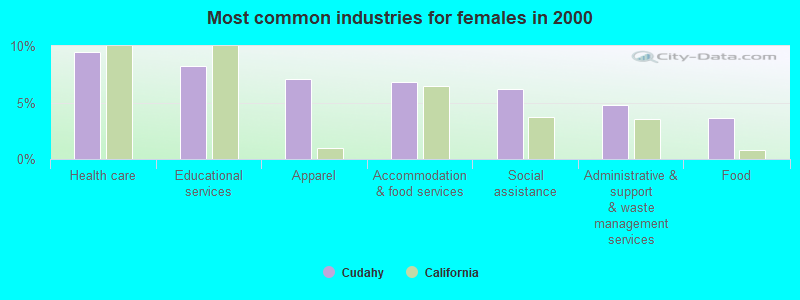
Industry diversity
Most Common Industries - Agriculture, forestry, fishing and hunting, and mining (%)
Most Common Industries - Agriculture, forestry, fishing and hunting (%)
Most Common Industries - Mining, quarrying, and oil and gas extraction (%)
Most Common Industries - Construction (%)
Most Common Industries - Manufacturing (%)
Most Common Industries - Wholesale trade (%)
Most Common Industries - Retail trade (%)
Most Common Industries - Transportation and warehousing, and utilities (%)
Most Common Industries - Transportation and warehousing (%)
Most Common Industries - Utilities (%)
Most Common Industries - Information (%)
Most Common Industries - Finance and insurance, and real estate and rental and leasing (%)
Most Common Industries - Finance and insurance (%)
Most Common Industries - Real estate and rental and leasing (%)
Most Common Industries - Professional, scientific, and management, and administrative and waste management services (%)
Most Common Industries - Professional, scientific, and technical services (%)
Most Common Industries - Management of companies and enterprises (%)
Most Common Industries - Administrative and support and waste management services (%)
Most Common Industries - Educational services, and health care and social assistance (%)
Most Common Industries - Educational services (%)
Most Common Industries - Health care and social assistance (%)
Most Common Industries - Arts, entertainment, and recreation, and accommodation and food services (%)
Most Common Industries - Arts, entertainment, and recreation (%)
Most Common Industries - Accommodation and food services (%)
Most Common Industries - Other services, except public administration (%)
Most Common Industries - Public administration (%)
Occupation diversity
Most Common Occupations - Management, business, science, and arts occupations (%)
Most Common Occupations - Management, business, and financial occupations (%)
Most Common Occupations - Management occupations (%)
Most Common Occupations - Business and financial operations occupations (%)
Most Common Occupations - Computer, engineering, and science occupations (%)
Most Common Occupations - Computer and mathematical occupations (%)
Most Common Occupations - Architecture and engineering occupations (%)
Most Common Occupations - Life, physical, and social science occupations (%)
Most Common Occupations - Education, legal, community service, arts, and media occupations (%)
Most Common Occupations - Community and social service occupations (%)
Most Common Occupations - Legal occupations (%)
Most Common Occupations - Education, training, and library occupations (%)
Most Common Occupations - Arts, design, entertainment, sports, and media occupations (%)
Most Common Occupations - Healthcare practitioners and technical occupations (%)
Most Common Occupations - Health diagnosing and treating practitioners and other technical occupations (%)
Most Common Occupations - Health technologists and technicians (%)
Most Common Occupations - Service occupations (%)
Most Common Occupations - Healthcare support occupations (%)
Most Common Occupations - Protective service occupations (%)
Most Common Occupations - Fire fighting and prevention, and other protective service workers including supervisors (%)
Most Common Occupations - Law enforcement workers including supervisors (%)
Most Common Occupations - Food preparation and serving related occupations (%)
Most Common Occupations - Building and grounds cleaning and maintenance occupations (%)
Most Common Occupations - Personal care and service occupations (%)
Most Common Occupations - Sales and office occupations (%)
Most Common Occupations - Sales and related occupations (%)
Most Common Occupations - Office and administrative support occupations (%)
Most Common Occupations - Natural resources, construction, and maintenance occupations (%)
Most Common Occupations - Farming, fishing, and forestry occupations (%)
Most Common Occupations - Construction and extraction occupations (%)
Most Common Occupations - Installation, maintenance, and repair occupations (%)
Most Common Occupations - Production, transportation, and material moving occupations (%)
Most Common Occupations - Production occupations (%)
Most Common Occupations - Transportation occupations (%)
Most Common Occupations - Material moving occupations (%)
People in Group quarters - Institutionalized population (%)
People in Group quarters - Correctional institutions (%)
People in Group quarters - Federal prisons and detention centers (%)
People in Group quarters - Halfway houses (%)
People in Group quarters - Local jails and other confinement facilities (including police lockups) (%)
People in Group quarters - Military disciplinary barracks (%)
People in Group quarters - State prisons (%)
People in Group quarters - Other types of correctional institutions (%)
People in Group quarters - Nursing homes (%)
People in Group quarters - Hospitals/wards, hospices, and schools for the handicapped (%)
People in Group quarters - Hospitals/wards and hospices for chronically ill (%)
People in Group quarters - Hospices or homes for chronically ill (%)
People in Group quarters - Military hospitals or wards for chronically ill (%)
People in Group quarters - Other hospitals or wards for chronically ill (%)
People in Group quarters - Hospitals or wards for drug/alcohol abuse (%)
People in Group quarters - Mental (Psychiatric) hospitals or wards (%)
People in Group quarters - Schools, hospitals, or wards for the mentally retarded (%)
People in Group quarters - Schools, hospitals, or wards for the physically handicapped (%)
People in Group quarters - Institutions for the deaf (%)
People in Group quarters - Institutions for the blind (%)
People in Group quarters - Orthopedic wards and institutions for the physically handicapped (%)
People in Group quarters - Wards in general hospitals for patients who have no usual home elsewhere (%)
People in Group quarters - Wards in military hospitals for patients who have no usual home elsewhere (%)
People in Group quarters - Juvenile institutions (%)
People in Group quarters - Long-term care (%)
People in Group quarters - Homes for abused, dependent, and neglected children (%)
People in Group quarters - Residential treatment centers for emotionally disturbed children (%)
People in Group quarters - Training schools for juvenile delinquents (%)
People in Group quarters - Short-term care, detention or diagnostic centers for delinquent children (%)
People in Group quarters - Type of juvenile institution unknown (%)
People in Group quarters - Noninstitutionalized population (%)
People in Group quarters - College dormitories (includes college quarters off campus) (%)
People in Group quarters - Military quarters (%)
People in Group quarters - On base (%)
People in Group quarters - Barracks, unaccompanied personnel housing (UPH), (Enlisted/Officer), ;and similar group living quarters for military personnel (%)
People in Group quarters - Transient quarters for temporary residents (%)
People in Group quarters - Military ships (%)
People in Group quarters - Group homes (%)
People in Group quarters - Homes or halfway houses for drug/alcohol abuse (%)
People in Group quarters - Homes for the mentally ill (%)
People in Group quarters - Homes for the mentally retarded (%)
People in Group quarters - Homes for the physically handicapped (%)
People in Group quarters - Other group homes (%)
People in Group quarters - Religious group quarters (%)
People in Group quarters - Dormitories (%)
People in Group quarters - Agriculture workers' dormitories on farms (%)
People in Group quarters - Job Corps and vocational training facilities (%)
People in Group quarters - Other workers' dormitories (%)
People in Group quarters - Crews of maritime vessels (%)
People in Group quarters - Other nonhousehold living situations (%)
People in Group quarters - Other noninstitutional group quarters (%)
Residents speaking English at home (%)
Residents speaking English at home - Born in the United States (%)
Residents speaking English at home - Native, born elsewhere (%)
Residents speaking English at home - Foreign born (%)
Residents speaking Spanish at home (%)
Residents speaking Spanish at home - Born in the United States (%)
Residents speaking Spanish at home - Native, born elsewhere (%)
Residents speaking Spanish at home - Foreign born (%)
Residents speaking other language at home (%)
Residents speaking other language at home - Born in the United States (%)
Residents speaking other language at home - Native, born elsewhere (%)
Residents speaking other language at home - Foreign born (%)
Class of Workers - Employee of private company (%)
Class of Workers - Self-employed in own incorporated business (%)
Class of Workers - Private not-for-profit wage and salary workers (%)
Class of Workers - Local government workers (%)
Class of Workers - State government workers (%)
Class of Workers - Federal government workers (%)
Class of Workers - Self-employed workers in own not incorporated business and Unpaid family workers (%)
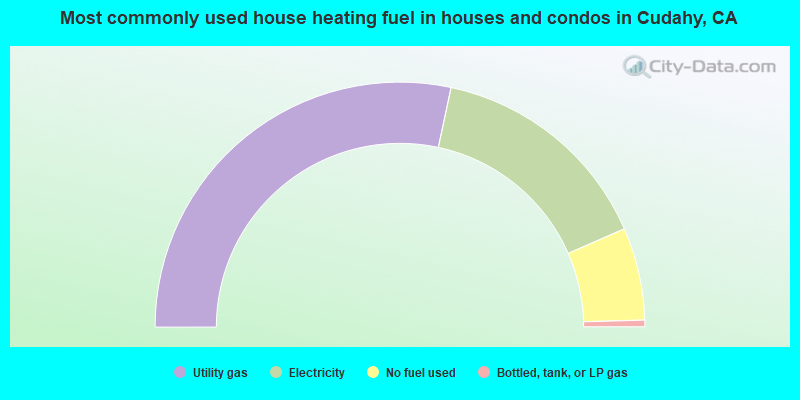
House heating fuel used in houses and condos - Utility gas (%)
House heating fuel used in houses and condos - Bottled, tank, or LP gas (%)
House heating fuel used in houses and condos - Electricity (%)
House heating fuel used in houses and condos - Fuel oil, kerosene, etc. (%)
House heating fuel used in houses and condos - Coal or coke (%)
House heating fuel used in houses and condos - Wood (%)
House heating fuel used in houses and condos - Solar energy (%)
House heating fuel used in houses and condos - Other fuel (%)
House heating fuel used in houses and condos - No fuel used (%)
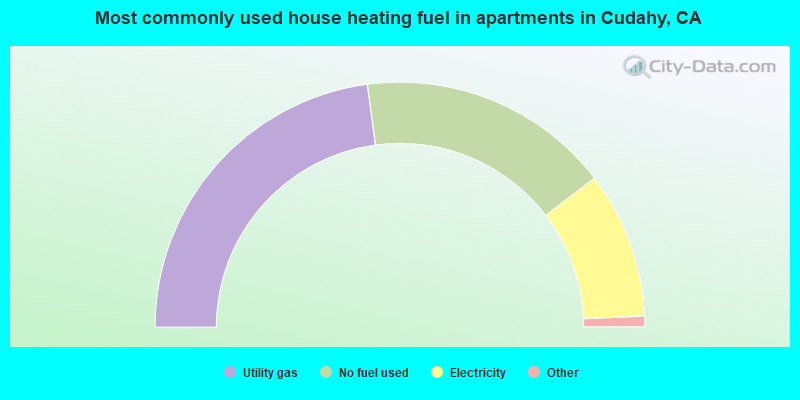
House heating fuel used in apartments - Utility gas (%)
House heating fuel used in apartments - Bottled, tank, or LP gas (%)
House heating fuel used in apartments - Electricity (%)
House heating fuel used in apartments - Fuel oil, kerosene, etc. (%)
House heating fuel used in apartments - Coal or coke (%)
House heating fuel used in apartments - Wood (%)
House heating fuel used in apartments - Solar energy (%)
House heating fuel used in apartments - Other fuel (%)
House heating fuel used in apartments - No fuel used (%)
Armed forces status - In Armed Forces (%)
Armed forces status - Civilian (%)
Armed forces status - Civilian - Veteran (%)
Armed forces status - Civilian - Nonveteran (%)
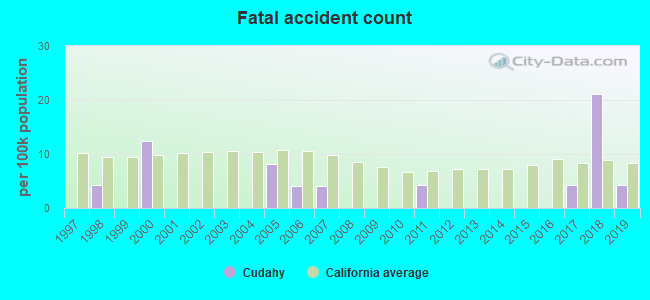
Fatal accidents locations in years 2005-2021
Fatal accidents locations in 2005
Fatal accidents locations in 2006
Fatal accidents locations in 2007
Fatal accidents locations in 2008
Fatal accidents locations in 2009
Fatal accidents locations in 2010
Fatal accidents locations in 2011
Fatal accidents locations in 2012
Fatal accidents locations in 2013
Fatal accidents locations in 2014
Fatal accidents locations in 2015
Fatal accidents locations in 2016
Fatal accidents locations in 2017
Fatal accidents locations in 2018
Fatal accidents locations in 2019
Fatal accidents locations in 2020
Fatal accidents locations in 2021
Alcohol use - People drinking some alcohol every month (%)
Alcohol use - People not drinking at all (%)
Alcohol use - Average days/month drinking alcohol
Alcohol use - Average drinks/week
Alcohol use - Average days/year people drink much
Audiometry - Average condition of hearing (%)
Audiometry - People that can hear a whisper from across a quiet room (%)
Audiometry - People that can hear normal voice from across a quiet room (%)
Audiometry - Ears ringing, roaring, buzzing (%)
Audiometry - Had a job exposure to loud noise (%)
Audiometry - Had off-work exposure to loud noise (%)
Blood Pressure & Cholesterol - Has high blood pressure (%)
Blood Pressure & Cholesterol - Checking blood pressure at home (%)
Blood Pressure & Cholesterol - Frequently checking blood cholesterol (%)
Blood Pressure & Cholesterol - Has high cholesterol level (%)
Consumer Behavior - Money monthly spent on food at supermarket/grocery store
Consumer Behavior - Money monthly spent on food at other stores
Consumer Behavior - Money monthly spent on eating out
Consumer Behavior - Money monthly spent on carryout/delivered foods
Consumer Behavior - Income spent on food at supermarket/grocery store (%)
Consumer Behavior - Income spent on food at other stores (%)
Consumer Behavior - Income spent on eating out (%)
Consumer Behavior - Income spent on carryout/delivered foods (%)
Current Health Status - General health condition (%)
Current Health Status - Blood donors (%)
Current Health Status - Has blood ever tested for HIV virus (%)
Current Health Status - Left-handed people (%)
Dermatology - People using sunscreen (%)
Diabetes - Diabetics (%)
Diabetes - Had a blood test for high blood sugar (%)
Diabetes - People taking insulin (%)
Diet Behavior & Nutrition - Diet health (%)
Diet Behavior & Nutrition - Milk product consumption (# of products/month)
Diet Behavior & Nutrition - Meals not home prepared (#/week)
Diet Behavior & Nutrition - Meals from fast food or pizza place (#/week)
Diet Behavior & Nutrition - Ready-to-eat foods (#/month)
Diet Behavior & Nutrition - Frozen meals/pizza (#/month)
Drug Use - People that ever used marijuana or hashish (%)
Drug Use - Ever used hard drugs (%)
Drug Use - Ever used any form of cocaine (%)
Drug Use - Ever used heroin (%)
Drug Use - Ever used methamphetamine (%)
Health Insurance - People covered by health insurance (%)
Kidney Conditions-Urology - Avg. # of times urinating at night
Medical Conditions - People with asthma (%)
Medical Conditions - People with anemia (%)
Medical Conditions - People with psoriasis (%)
Medical Conditions - People with overweight (%)
Medical Conditions - Elderly people having difficulties in thinking or remembering (%)
Medical Conditions - People who ever received blood transfusion (%)
Medical Conditions - People having trouble seeing even with glass/contacts (%)
Medical Conditions - People with arthritis (%)
Medical Conditions - People with gout (%)
Medical Conditions - People with congestive heart failure (%)
Medical Conditions - People with coronary heart disease (%)
Medical Conditions - People with angina pectoris (%)
Medical Conditions - People who ever had heart attack (%)
Medical Conditions - People who ever had stroke (%)
Medical Conditions - People with emphysema (%)
Medical Conditions - People with thyroid problem (%)
Medical Conditions - People with chronic bronchitis (%)
Medical Conditions - People with any liver condition (%)
Medical Conditions - People who ever had cancer or malignancy (%)
Mental Health - People who have little interest in doing things (%)
Mental Health - People feeling down, depressed, or hopeless (%)
Mental Health - People who have trouble sleeping or sleeping too much (%)
Mental Health - People feeling tired or having little energy (%)
Mental Health - People with poor appetite or overeating (%)
Mental Health - People feeling bad about themself (%)
Mental Health - People who have trouble concentrating on things (%)
Mental Health - People moving or speaking slowly or too fast (%)
Mental Health - People having thoughts they would be better off dead (%)
Oral Health - Average years since last visit a dentist
Oral Health - People embarrassed because of mouth (%)
Oral Health - People with gum disease (%)
Oral Health - General health of teeth and gums (%)
Oral Health - Average days a week using dental floss/device
Oral Health - Average days a week using mouthwash for dental problem
Oral Health - Average number of teeth
Pesticide Use - Households using pesticides to control insects (%)
Pesticide Use - Households using pesticides to kill weeds (%)
Physical Activity - People doing vigorous-intensity work activities (%)
Physical Activity - People doing moderate-intensity work activities (%)
Physical Activity - People walking or bicycling (%)
Physical Activity - People doing vigorous-intensity recreational activities (%)
Physical Activity - People doing moderate-intensity recreational activities (%)
Physical Activity - Average hours a day doing sedentary activities
Physical Activity - Average hours a day watching TV or videos
Physical Activity - Average hours a day using computer
Physical Functioning - People having limitations keeping them from working (%)
Physical Functioning - People limited in amount of work they can do (%)
Physical Functioning - People that need special equipment to walk (%)
Physical Functioning - People experiencing confusion/memory problems (%)
Physical Functioning - People requiring special healthcare equipment (%)
Prescription Medications - Average number of prescription medicines taking
Preventive Aspirin Use - Adults 40+ taking low-dose aspirin (%)
Reproductive Health - Vaginal deliveries (%)
Reproductive Health - Cesarean deliveries (%)
Reproductive Health - Deliveries resulted in a live birth (%)
Reproductive Health - Pregnancies resulted in a delivery (%)
Reproductive Health - Women breastfeeding newborns (%)
Reproductive Health - Women that had a hysterectomy (%)
Reproductive Health - Women that had both ovaries removed (%)
Reproductive Health - Women that have ever taken birth control pills (%)
Reproductive Health - Women taking birth control pills (%)
Reproductive Health - Women that have ever used Depo-Provera or injectables (%)
Reproductive Health - Women that have ever used female hormones (%)
Sexual Behavior - People 18+ that ever had sex (vaginal, anal, or oral) (%)
Sexual Behavior - Males 18+ that ever had vaginal sex with a woman (%)
Sexual Behavior - Males 18+ that ever performed oral sex on a woman (%)
Sexual Behavior - Males 18+ that ever had anal sex with a woman (%)
Sexual Behavior - Males 18+ that ever had any sex with a man (%)
Sexual Behavior - Females 18+ that ever had vaginal sex with a man (%)
Sexual Behavior - Females 18+ that ever performed oral sex on a man (%)
Sexual Behavior - Females 18+ that ever had anal sex with a man (%)
Sexual Behavior - Females 18+ that ever had any kind of sex with a woman (%)
Sexual Behavior - Average age people first had sex
Sexual Behavior - Average number of female sex partners in lifetime (males 18+)
Sexual Behavior - Average number of female vaginal sex partners in lifetime (males 18+)
Sexual Behavior - Average age people first performed oral sex on a woman (18+)
Sexual Behavior - Average number of woman performed oral sex on in lifetime (18+)
Sexual Behavior - Average number of male sex partners in lifetime (males 18+)
Sexual Behavior - Average number of male anal sex partners in lifetime (males 18+)
Sexual Behavior - Average age people first performed oral sex on a man (18+)
Sexual Behavior - Average number of male oral sex partners in lifetime (18+)
Sexual Behavior - People using protection when performing oral sex (%)
Sexual Behavior - Average number of times people have vaginal or anal sex a year
Sexual Behavior - People having sex without condom (%)
Sexual Behavior - Average number of male sex partners in lifetime (females 18+)
Sexual Behavior - Average number of male vaginal sex partners in lifetime (females 18+)
Sexual Behavior - Average number of female sex partners in lifetime (females 18+)
Sexual Behavior - Circumcised males 18+ (%)
Sleep Disorders - Average hours sleeping at night
Sleep Disorders - People that has trouble sleeping (%)
Smoking-Cigarette Use - People smoking cigarettes (%)
Taste & Smell - People 40+ having problems with smell (%)
Taste & Smell - People 40+ having problems with taste (%)
Taste & Smell - People 40+ that ever had wisdom teeth removed (%)
Taste & Smell - People 40+ that ever had tonsils teeth removed (%)
Taste & Smell - People 40+ that ever had a loss of consciousness because of a head injury (%)
Taste & Smell - People 40+ that ever had a broken nose or other serious injury to face or skull (%)
Taste & Smell - People 40+ that ever had two or more sinus infections (%)
Weight - Average height (inches)
Weight - Average weight (pounds)
Weight - Average BMI
Weight - People that are obese (%)
Weight - People that ever were obese (%)
Weight - People trying to lose weight (%)
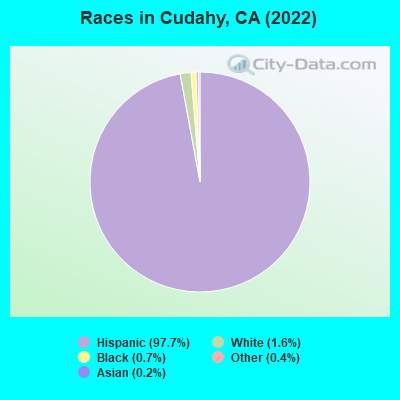
21,653 97.7% Hispanic 364 1.6% White alone 162 0.7% Black alone 81 0.4% Other race alone 52 0.2% Asian alone 8 0.04% Native Hawaiian and Other
According to our research of California and other state lists, there were 11 registered sex offenders living in Cudahy, California as of April 27, 2024 . The ratio of all residents to sex offenders in Cudahy is 2,209 to 1.The ratio of registered sex offenders to all residents in this city is much lower than the state average.
Officers per 1,000 residents here:
0.04California average:
1.98
Latest news from Cudahy, CA collected exclusively by city-data.com from local newspapers, TV, and radio stations
Current Local Time:
Land area: 1.12 square miles.
Population density: 19,627 people per square mile (very high).
9,559 residents are foreign born (43.0% Latin America ).
This city:
43.1%California:
26.5%
Median real estate property taxes paid for housing units in 2000: Cudahy city:
1.1% ($1,590)California:
0.8% ($1,564)
Nearest city with pop. 50,000+: South Gate, CA
Nearest city with pop. 200,000+: Southwest San Gabriel Valley, CA (7.9 miles
Nearest city with pop. 1,000,000+: Los Angeles, CA
Nearest cities:
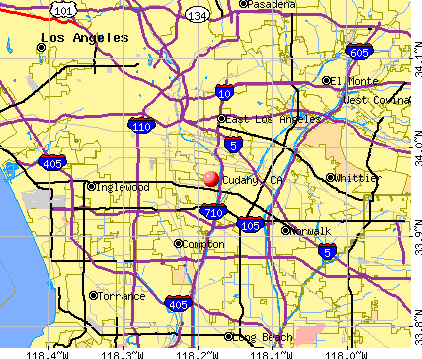
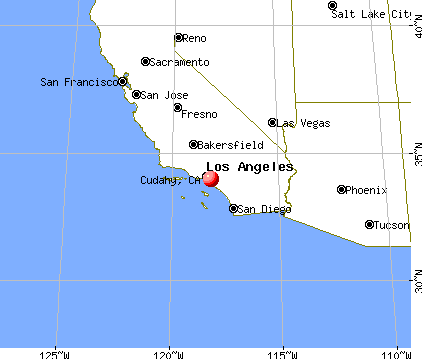
Latitude: 33.96 N, Longitude: 118.18 W
Daytime population change due to commuting: -6,769 (-30.5%)Workers who live and work in this city: 806 (8.5%)
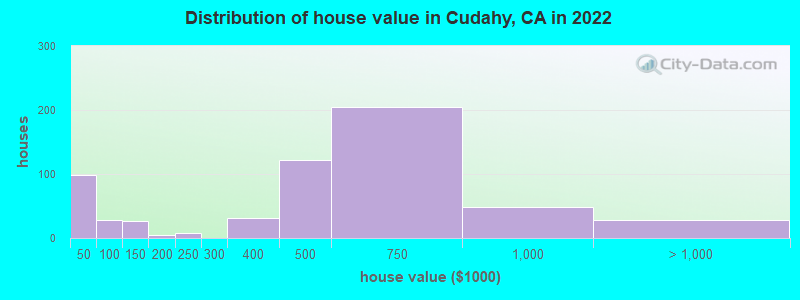
Property values in Cudahy, CA
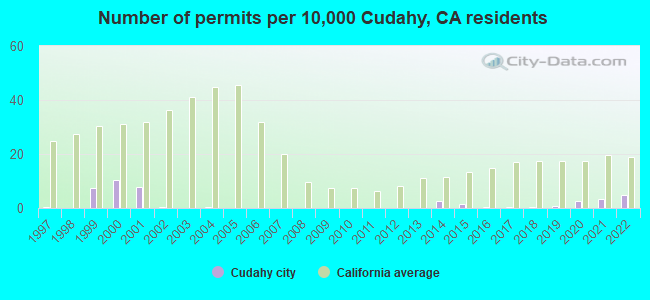
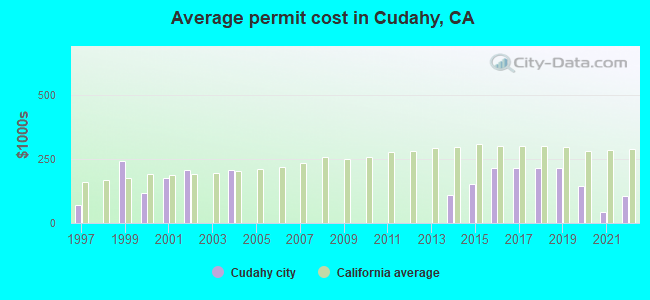
Single-family new house construction building permits:
2022: 12 buildings , average cost: $107,2002021: 8 buildings , average cost: $44,8002020: 6 buildings , average cost: $143,0002019: 2 buildings , average cost: $217,0002018: 1 building , cost: $217,0002017: 1 building , cost: $217,0002016: 1 building , cost: $217,0002015: 4 buildings , average cost: $152,0002014: 6 buildings , average cost: $110,8002004: 1 building , cost: $209,1002002: 1 building , cost: $209,1002001: 19 buildings , average cost: $176,9002000: 25 buildings , average cost: $115,8001999: 18 buildings , average cost: $241,6001997: 1 building , cost: $69,600Unemployment in December 2023:
Population change in the 1990s: +1,304 (+5.7%).
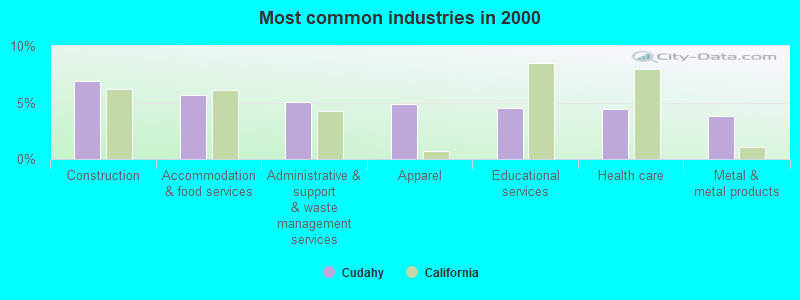
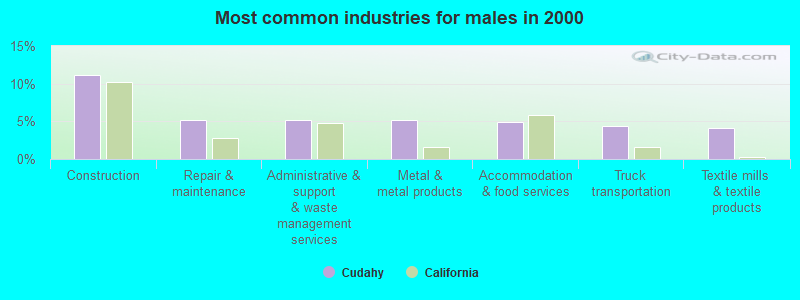
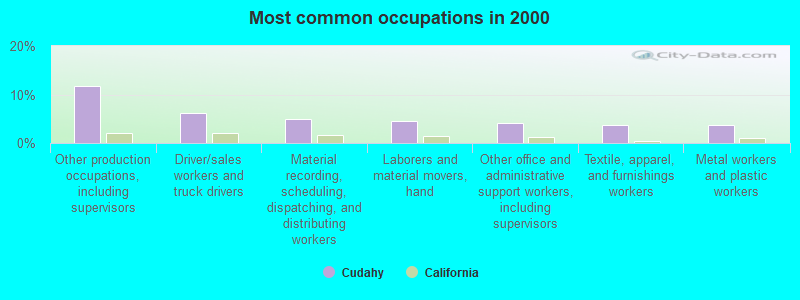
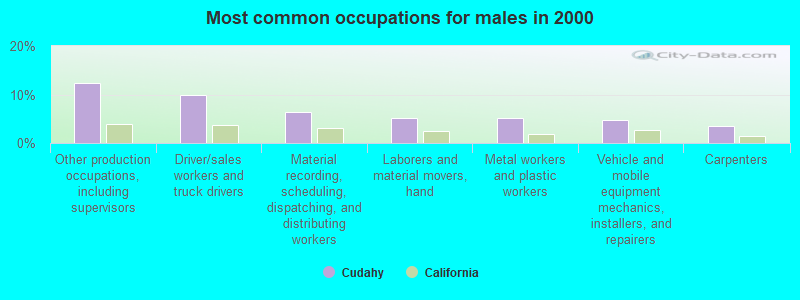
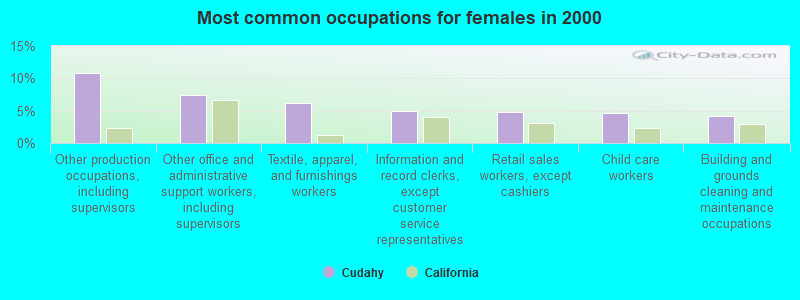
Most common occupations in Cudahy, CA (%)
Both Males Females
Other production occupations, including supervisors (11.8%)
Driver/sales workers and truck drivers (6.2%)
Material recording, scheduling, dispatching, and distributing workers (4.9%)
Laborers and material movers, hand (4.6%)
Other office and administrative support workers, including supervisors (4.2%)
Textile, apparel, and furnishings workers (3.7%)
Metal workers and plastic workers (3.6%)
Other production occupations, including supervisors (12.5%)
Driver/sales workers and truck drivers (9.9%)
Material recording, scheduling, dispatching, and distributing workers (6.3%)
Laborers and material movers, hand (5.2%)
Metal workers and plastic workers (5.1%)
Vehicle and mobile equipment mechanics, installers, and repairers (4.8%)
Carpenters (3.5%)
Other production occupations, including supervisors (10.8%)
Other office and administrative support workers, including supervisors (7.4%)
Textile, apparel, and furnishings workers (6.1%)
Information and record clerks, except customer service representatives (5.0%)
Retail sales workers, except cashiers (4.7%)
Child care workers (4.7%)
Building and grounds cleaning and maintenance occupations (4.3%)
Earthquake activity:
Cudahy-area historical earthquake activity is significantly above California state average. It is 6946% greater than the overall U.S. average. On 7/21/1952 at 11:52:14, a magnitude 7.7 (7.7 UK, Class: Major, Intensity: VIII - XII) earthquake occurred 85.5 miles away from Cudahy center, causing $50,000,000 total damage On 6/28/1992 at 11:57:34, a magnitude 7.6 (6.2 MB, 7.6 MS, 7.3 MW, Depth: 0.7 mi) earthquake occurred 95.8 miles away from the city center, causing 3 deaths ( 1 shaking deaths, 2 other deaths) and 400 injuries, causing $100,000,000 total damage and $40,000,000 insured lossesOn 10/16/1999 at 09:46:44, a magnitude 7.4 (6.3 MB, 7.4 MS, 7.2 MW, 7.3 ML) earthquake occurred 106.9 miles away from the city center On 11/4/1927 at 13:51:53, a magnitude 7.5 (7.5 UK) earthquake occurred 175.3 miles away from Cudahy center On 1/17/1994 at 12:30:55, a magnitude 6.8 (6.4 MB, 6.8 MS, 6.7 MW, Depth: 11.4 mi, Class: Strong, Intensity: VII - IX) earthquake occurred 26.1 miles away from Cudahy center, causing 60 deaths ( 60 shaking deaths) and 7000 injuriesOn 4/21/1918 at 22:32:30, a magnitude 6.8 (6.8 UK) earthquake occurred 43.9 miles away from Cudahy center Magnitude types: body-wave magnitude (MB), local magnitude (ML), surface-wave magnitude (MS), moment magnitude (MW) Natural disasters: The number of natural disasters in Los Angeles County (57) is a lot greater than the US average (15).Major Disasters (Presidential) Declared: 27Emergencies Declared: 3Fires: 37, Floods: 16, Storms: 9, Winter Storms: 6, Landslides: 5, Mudslides: 5, Earthquakes: 3, Freeze: 1, Heavy Rain: 1, Hurricane: 1, Snow: 1, Tornado: 1, Wind: 1, Other: 1 (Note: some incidents may be assigned to more than one category). Hospitals and medical centers in Cudahy: DAVITA-PREMIER DIALYSIS CENTER (7612 ATLANTIC AVENUE)
Other hospitals and medical centers near Cudahy: BELL CONVALESCENT HOSPITAL (Nursing Home, about 1 miles away; BELL, CA)
BRIARCREST NURSING CENTER (Nursing Home, about 1 miles away; BELL GARDENS, CA)
SATELLITE DIALYSIS OF SOUTH GATE (Dialysis Facility, about 2 miles away; SOUTH GATE, CA)
MAYWOOD SKILLED NURSING AND WELLNESS CENTRE (Nursing Home, about 2 miles away; MAYWOOD, CA)
GREENFIELD CARE CENTER OF SOUTH GATE (Nursing Home, about 2 miles away; SOUTH GATE, CA)
COMMUNITY AND MISSION HOSPITAL OF HUNTINGTON PARK (Hospital, about 2 miles away; HUNTINGTON PARK, CA)
MIMIS HOMES (Hospital, about 2 miles away; DOWNEY, CA)
Amtrak stations near Cudahy: 8 miles: LOS ANGELES (800 N. ALAMEDA ST.) Services: ticket office, fully wheelchair accessible, enclosed waiting area, public restrooms, public payphones, snack bar, free short-term parking, paid long-term parking, car rental agency, taxi stand, public transit connection.
12 miles: GLENDALE (400 W. CERRITOS AVE.) Services: fully wheelchair accessible, public payphones, free short-term parking, free long-term parking, call for taxi service, intercity bus service, public transit connection.
13 miles: PASADENA (150 S. ROBLES AVE.) - Bus Station Services: fully wheelchair accessible, enclosed waiting area, public restrooms, public payphones, full-service food facilities, paid short-term parking, paid long-term parking, taxi stand, public transit connection.
Colleges/universities with over 2000 students nearest to Cudahy:
ICDC College (about 3 miles; Huntington Park, CA ; Full-time enrollment: 2,621)
United Education Institute-Huntington Park Campus (about 3 miles; Huntington Park, CA ; FT enrollment: 5,151)
Marinello Schools of Beauty-Los Angeles (about 5 miles; Los Angeles, CA ; FT enrollment: 3,923)
East Los Angeles College (about 6 miles; Monterey Park, CA ; FT enrollment: 17,297)
El Camino College-Compton Center (about 7 miles; Compton, CA ; FT enrollment: 4,506)
Los Angeles Trade Technical College (about 7 miles; Los Angeles, CA ; FT enrollment: 7,421)
University of Southern California (about 8 miles; Los Angeles, CA ; FT enrollment: 33,161)
Public high school in Cudahy:
Public elementary/middle schools in Cudahy:
See full list of schools located in Cudahy Los Angeles County has a predicted average indoor radon screening level between 2 and 4 pCi/L (pico curies per liter) - Moderate Potential Average household size: This city:
4.2 peopleCalifornia:
2.9 people
Percentage of family households: This city:
89.0%Whole state:
68.7%
Percentage of households with unmarried partners: This city:
11.3%Whole state:
7.2%
Likely homosexual households (counted as self-reported same-sex unmarried-partner households)
Lesbian couples: 0.4% of all households Gay men: 0.4% of all households
8 people in other noninstitutional facilities in 2010people in homes for the mentally ill in 2000
Banks with branches in Cudahy (2011 data):
U.S. Bank National Association: Cudahy Branch at 7220 Atlantic Blvd, branch established on 1989/06/30. Info updated 2012/01/30: Bank assets: $330,470.8 mil, Deposits: $236,091.5 mil, headquarters in Cincinnati, OH, positive income , 3121 total offices , Holding Company: U.S. Bancorp
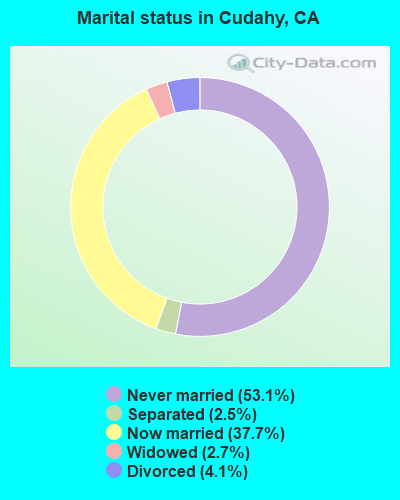
For population 15 years and over in Cudahy:
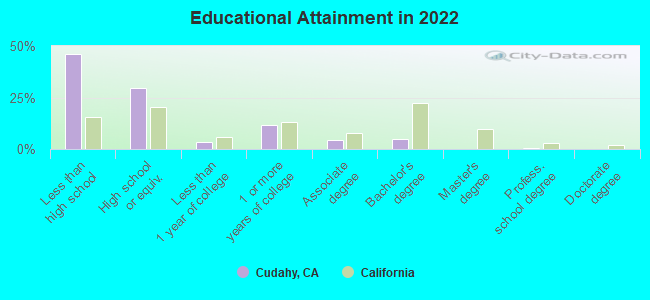
Never married: 53.1%Now married: 37.7%Separated: 2.5%Widowed: 2.7%Divorced: 4.1% For population 25 years and over in Cudahy:
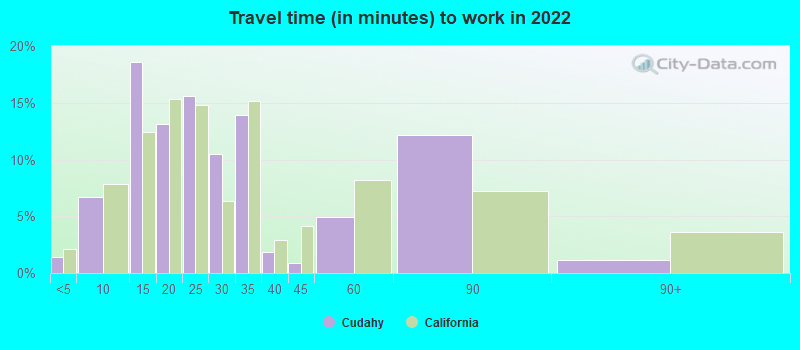
High school or higher: 53.1%Bachelor's degree or higher: 5.3%Graduate or professional degree: 0.6%Unemployed: 10.9%Mean travel time to work (commute): 28.9 minutes
Education Gini index (Inequality in education) Here:
23.5California average:
15.5
Religion statistics for Cudahy, CA (based on Los Angeles County data)
Religion Adherents Congregations Catholic 3,542,994 275 Evangelical Protestant 814,611 3,249 Other 451,594 1,023 Mainline Protestant 229,056 860 Black Protestant 112,338 290 Orthodox 63,517 76 None 4,604,495 -
Source: Clifford Grammich, Kirk Hadaway, Richard Houseal, Dale E.Jones, Alexei Krindatch, Richie Stanley and Richard H.Taylor. 2012. 2010 U.S.Religion Census: Religious Congregations & Membership Study. Association of Statisticians of American Religious Bodies. Jones, Dale E., et al. 2002. Congregations and Membership in the United States 2000. Nashville, TN: Glenmary Research Center. Graphs represent county-level data
Food Environment Statistics: Number of grocery stores : 2,084This county :
2.12 / 10,000 pop.California :
2.14 / 10,000 pop.
Number of supercenters and club stores : 32Here :
0.03 / 10,000 pop.California :
0.04 / 10,000 pop.
Number of convenience stores (no gas) : 567This county :
0.58 / 10,000 pop.California :
0.62 / 10,000 pop.
Number of convenience stores (with gas) : 1,206Los Angeles County :
1.23 / 10,000 pop.California :
1.49 / 10,000 pop.
Number of full-service restaurants : 7,008Los Angeles County :
7.15 / 10,000 pop.California :
7.42 / 10,000 pop.
Adult obesity rate : Los Angeles County :
20.4%State :
21.3%
Low-income preschool obesity rate : Here :
18.6%California :
17.9%
Health and Nutrition: Healthy diet rate : This city:
44.9%California:
49.4%
Average overall health of teeth and gums : People feeling badly about themselves : Here:
23.6%California:
20.2%
People not drinking alcohol at all : Cudahy:
10.2%California:
11.2%
Average hours sleeping at night : Overweight people : Cudahy:
29.1%California:
31.5%
General health condition : This city:
53.3%California:
56.4%
Average condition of hearing : This city:
82.3%California:
80.9%
More about Health and Nutrition of Cudahy, CA Residents
Local government employment and payroll (March 2022)
Function
Full-time employees
Monthly full-time payroll
Average yearly full-time wage
Part-time employees
Monthly part-time payroll
Other and Unallocable
18 $110,697 $73,798 17 $38,438
Totals for Government
18 $110,697 $73,798 17 $38,438
Cudahy government finances - Expenditure in 2017 (per resident):
Construction - Housing and Community Development: $134,000 ($6.10)
Current Operations - Police Protection: $4,129,000 ($187.95)
Central Staff Services: $2,707,000 ($123.22)Regular Highways: $1,405,000 ($63.95)Financial Administration: $923,000 ($42.01)Parks and Recreation: $611,000 ($27.81)General - Other: $387,000 ($17.62)Housing and Community Development: $287,000 ($13.06)Protective Inspection and Regulation - Other: $143,000 ($6.51)Health - Other: $86,000 ($3.91)General - Interest on Debt: $1,017,000 ($46.29)
Intergovernmental to Local - Other - Police Protection: $4,070,000 ($185.26)
Other Capital Outlay - Police Protection: $42,000 ($1.91)
General - Other: $33,000 ($1.50)
Cudahy government finances - Revenue in 2017 (per resident):
Charges - Other: $232,000 ($10.56)
Regular Highways: $85,000 ($3.87)Parks and Recreation: $11,000 ($0.50)Federal Intergovernmental - Other: $420,000 ($19.12)
Housing and Community Development: $208,000 ($9.47)Local Intergovernmental - Other: $327,000 ($14.88)
Miscellaneous - Sale of Property: $1,198,000 ($54.53)
Fines and Forfeits: $160,000 ($7.28)Rents: $117,000 ($5.33)Interest Earnings: $36,000 ($1.64)Donations From Private Sources: $20,000 ($0.91)General Revenue - Other: $14,000 ($0.64)State Intergovernmental - Highways: $470,000 ($21.39)
Other: $321,000 ($14.61)General Local Government Support: $1,000 ($0.05)Tax - Property: $2,892,000 ($131.64)
General Sales and Gross Receipts: $2,400,000 ($109.24)Public Utilities Sales: $1,348,000 ($61.36)Occupation and Business License - Other: $509,000 ($23.17)Other License: $495,000 ($22.53)Other: $63,000 ($2.87)Other Selective Sales: $62,000 ($2.82)Documentary and Stock Transfer: $25,000 ($1.14)
Cudahy government finances - Debt in 2017 (per resident):
Long Term Debt - Beginning Outstanding - Unspecified Public Purpose: $25,433,000 ($1157.68)
Outstanding Unspecified Public Purpose: $24,024,000 ($1093.54)Retired Unspecified Public Purpose: $1,409,000 ($64.14)
Cudahy government finances - Cash and Securities in 2017 (per resident):
Other Funds - Cash and Securities: $10,610,000 ($482.95)
2.98% of this county's 2021 resident taxpayers lived in other counties in 2020 ($81,235 average adjusted gross income )
Here:
2.98%California average:
5.19%
0.01% of residents moved from foreign countries ($155 average AGI )Los Angeles County:
0.01%California average:
0.03%
Top counties from which taxpayers relocated into this county between 2020 and 2021:
4.68% of this county's 2020 resident taxpayers moved to other counties in 2021 ($97,324 average adjusted gross income )
Here:
4.68%California average:
6.14%
0.01% of residents moved to foreign countries ($196 average AGI )Los Angeles County:
0.01%California average:
0.02%
Top counties to which taxpayers relocated from this county between 2020 and 2021:
Businesses in Cudahy, CA
Name Count Name Count
AutoZone 1 Kmart 1 Burger King 1 Little Caesars Pizza 1 El Pollo Loco 1 McDonald's 1 FedEx 1 Payless 1 Forever 21 1 Sears 1 GameStop 1 T-Mobile 1 H&R Block 1 Taco Bell 1 Jamba Juice 1 U-Haul 1
Strongest AM radio stations in Cudahy:
KFWB (980 AM; 50 kW; LOS ANGELES, CA; Owner: INFINITY BROADCASTING OPERATIONS, INC.)
KFI (640 AM; 50 kW; LOS ANGELES, CA; Owner: CAPSTAR TX LIMITED PARTNERSHIP)
KMPC (1540 AM; 50 kW; LOS ANGELES, CA; Owner: ROSE CITY RADIO CORPORATION)
KLAC (570 AM; 50 kW; LOS ANGELES, CA; Owner: AMFM RADIO LICENSES, L.L.C.)
KBLA (1580 AM; 50 kW; SANTA MONICA, CA)
KNX (1070 AM; 50 kW; LOS ANGELES, CA; Owner: INFINITY BROADCASTING OPERATIONS, INC.)
KTNQ (1020 AM; 50 kW; LOS ANGELES, CA; Owner: KTNQ-AM LICENSE CORP.)
KXMX (1190 AM; 25 kW; ANAHEIM, CA; Owner: NEW INSPIRATION BROADCASTING COMPANY)
KXTA (1150 AM; 50 kW; LOS ANGELES, CA; Owner: CITICASTERS LICENSES, L.P.)
KDIS (1110 AM; 50 kW; PASADENA, CA; Owner: ABC,INC.)
KSPN (710 AM; 50 kW; LOS ANGELES, CA; Owner: KABC-AM RADIO, INC.)
KRLA (870 AM; 20 kW; GLENDALE, CA; Owner: NEW INSPIRATION BROADCASTING COMPANY)
KLTX (1390 AM; 5 kW; LONG BEACH, CA; Owner: HI-FAVOR BROADCASTING, LLC)
Strongest FM radio stations in Cudahy:
KZLA-FM (93.9 FM; LOS ANGELES, CA; Owner: EMMIS RADIO LICENSE CORPORATION)
KPWR (105.9 FM; LOS ANGELES, CA; Owner: EMMIS RADIO LICENSE CORPORATION)
KLSX (97.1 FM; LOS ANGELES, CA; Owner: INFINITY BROADCASTING OPERATIONS, INC.)
KUSC (91.5 FM; LOS ANGELES, CA; Owner: UNIVERSITY OF SOUTHERN CALIFORNIA)
KKLA-FM (99.5 FM; LOS ANGELES, CA; Owner: NEW INSPIRATION BROADCASTING CO., INC.)
KKBT (100.3 FM; LOS ANGELES, CA; Owner: RADIO ONE LICENSES, LLC)
KRTH-FM (101.1 FM; LOS ANGELES, CA; Owner: INFINITY BROADCASTING OPERATIONS, INC.)
KCBS-FM (93.1 FM; LOS ANGELES, CA; Owner: INFINITY BROADCASTING OPERATIONS, INC.)
KSCA (101.9 FM; GLENDALE, CA; Owner: HBC LICENSE CORPORATION)
KLOS (95.5 FM; LOS ANGELES, CA; Owner: KLOS-FM RADIO, INC.)
K212FA (90.3 FM; TEMPLE CITY, CA; Owner: EDUCATIONAL MEDIA FOUNDATION)
KOST (103.5 FM; LOS ANGELES, CA; Owner: CAPSTAR TX LIMITED PARTNERSHIP)
KIIS-FM (102.7 FM; LOS ANGELES, CA; Owner: CITICASTERS LICENSES, L.P.)
KLVE (107.5 FM; LOS ANGELES, CA; Owner: KLVE-FM LICENSE CORP.)
KPCC (89.3 FM; PASADENA, CA; Owner: PASADENA AREA COMMUNITY COLLEGE DISTRICT)
KHHT (92.3 FM; LOS ANGELES, CA; Owner: AMFM RADIO LICENSES, L.L.C.)
KBIG-FM (104.3 FM; LOS ANGELES, CA; Owner: AMFM RADIO LICENSES, L.L.C.)
KMZT-FM (105.1 FM; LOS ANGELES, CA; Owner: MOUNT WILSON FM BROADCASTERS, INC.)
KPFK (90.7 FM; LOS ANGELES, CA; Owner: PACIFICA FOUNDATION, INC)
KTWV (94.7 FM; LOS ANGELES, CA; Owner: INFINITY BROADCASTING OPERATIONS, INC.)
TV broadcast stations around Cudahy:
KCBS-TV (Channel 2; LOS ANGELES, CA; Owner: CBS BROADCASTING INC.)
KTRO-LP (Channel 50; LANCASTER, CA; Owner: ROBERT D. ADELMAN)
KTLA-TV (Channel 5; LOS ANGELES, CA; Owner: KTLA INC.)
KABC-TV (Channel 7; LOS ANGELES, CA; Owner: ABC HOLDING COMPANY, INC.)
KCAL-TV (Channel 9; LOS ANGELES, CA; Owner: VIACOM TELEVISION STATIONS GROUP OF LOS ANGELES LLC)
KNBC (Channel 4; LOS ANGELES, CA; Owner: NBC SUBSIDIARY (KNBC-TV), INC.)
KMEX-TV (Channel 34; LOS ANGELES, CA; Owner: KMEX LICENSE PARTNERSHIP, G.P.)
KAZA-TV (Channel 54; AVALON, CA; Owner: PAPPAS SOUTHERN CALIFORNIA LICENSE LLC)
KDOC-TV (Channel 56; ANAHEIM, CA; Owner: GOLDEN ORANGE BROADCASTING CO., INC.)
KOCE-TV (Channel 50; HUNTINGTON BEACH, CA; Owner: BD. OF TRUSTEES, COAST COMMUNITY COLLEGE DIST.)
KSCI (Channel 18; LONG BEACH, CA; Owner: KSLS, INC.)
KXLA (Channel 44; RANCHO PALOS VERDES, CA; Owner: RANCHO PALOS VERDES BROADCASTERS, INC.)
KCET (Channel 28; LOS ANGELES, CA; Owner: COMMUNITY TELEVISION OF SOUTHERN CALIFORNIA)
KFTR (Channel 46; ONTARIO, CA; Owner: TELEFUTURA LOS ANGELES LLC)
KTTV (Channel 11; LOS ANGELES, CA; Owner: FOX TELEVISION STATIONS, INC.)
KWHY-TV (Channel 22; LOS ANGELES, CA; Owner: TELEMUNDO OF LOS ANGELES LICENSE CORPORATION)
KVEA (Channel 52; CORONA, CA; Owner: ESTRELLA LICENSE CORPORATION)
KCOP-TV (Channel 13; LOS ANGELES, CA; Owner: FOX TELEVISION STATIONS, INC.)
National Bridge Inventory (NBI) Statistics 1 Number of bridges49ft / 14.5m Total length16,274 Total average daily traffic162 Total average daily truck traffic19,529 Total future (year 2041) average daily traffic
FCC Registered Antenna Towers: 4
Dale R Smith, Cudahy Park 2ca35078 (Lat: 33.958667 Lon: -118.175222), Type: 21.9, Overall height: 21.9 m, Registrant: Mobilitie Investments Ii, LLC, Pm@mobilitie.Com, , Newpo-rt Beach, Phone: (949) 515-1500 Dale R Smith, Cudahy Park 2ca35078 (Lat: 33.958667 Lon: -118.175222), Type: 21.9, Overall height: 21.9 m, Registrant: Mobilitie Investments Ii, LLC, Pm@mobilitie.Com, , Newpo-rt Beach, Phone: (949) 515-1500 Edward G Roach, Cudahy Park 2ca35078 (Lat: 33.958667 Lon: -118.175222), Type: 21.9, Overall height: 21.9 m, Registrant: Sba Monarch Towers Ii, LLC, Eroach@sbasite.Com, , Boca -Raton, Phone: (561) 995-7670 Edward G Roach, Cudahy Park 2ca35078 (Lat: 33.958667 Lon: -118.175222), Type: 21.9, Structure height: 06037 m, Overall height: 21.9 m, Registrant: Sba Monarch Towers Ii, LLC, Eroach@sbasite.Com, , Boca -Raton, Phone: (561) 995-7670 FCC Registered Broadcast Land Mobile Towers: 1
Lat: 33.959944 Lon: -118.175000, Structure height: 0 m, Call Sign: WPXY715, Assigned Frequencies: 453.037 MHz, 458.037 MHz, Grant Date: 07/02/2003, Expiration Date: 07/02/2013, Cancellation Date: 09/07/2013, Certifier: George A Perez, Registrant: City Of Cudahy, 5220 Santa Ana Street, Cudahy, CA 90201, Phone: (323) 773-5143, Fax: (323) 771-2072, Email:
FCC Registered Microwave Towers: 2
CA-LOS6113A, 7300 Atlantic Ave. (Lat: 33.969000 Lon: -118.186306), Type: Pole, Structure height: 17.7 m, Call Sign: WQLU828, Assigned Frequencies: 21875.0 MHz, 21925.0 MHz, 22025.0 MHz, 22075.0 MHz, Grant Date: 06/16/2020, Expiration Date: 04/29/2030, Cancellation Date: 09/13/2021, Certifier: Nadja S Sodos-Wallace, Registrant: T-Mobile Usa, Inc., 12920 Se 38th Street, Bellevue, WA 98006, Phone: (425) 383-8402, Fax: (425) 383-4840, Email:
Chuze Fitness, 8017 Atlantic Ave (Lat: 33.961528 Lon: -118.187389), Type: Building, Structure height: 10.7 m, Call Sign: WREY772, Assigned Frequencies: 17765.0 MHz, 17765.0 MHz, 17765.0 MHz, 17765.0 MHz, 17765.0 MHz, Grant Date: 01/06/2020, Expiration Date: 01/06/2030, Certifier: Ryan Hauf, Registrant: Micronet Communications, Inc., 812 Lexington Dr, Plano, TX 75075, Phone: (972) 422-7200, Email:
FCC Registered Amateur Radio Licenses: 11 (
See the full list of FCC Registered Amateur Radio Licenses in Cudahy )
FAA Registered Aircraft: 1
Aircraft: BEECH 95-B55 (T42A) (Category: Land, Engines: 2, Seats: 6, Weight: Up to 12,499 Pounds, Speed: 165 mph), Engine: CONT MOTOR I0-470 SERIES (260 HP) (Reciprocating)N-Number: 288TB, N288TB, N-288TB, Serial Number: TC-1880, Year manufactured: 1975, Airworthiness Date: 05/28/1975, Certificate Issue Date: 04/26/2004Registrant (Co-Owned): Robert K Cejka, 4601 Cecilia St, Cudahy, CA 90201, Other Owners: Merry A Cejka
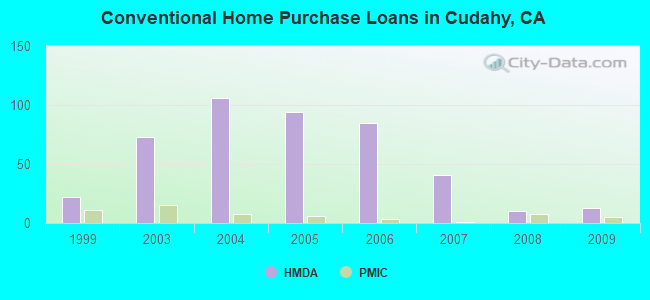
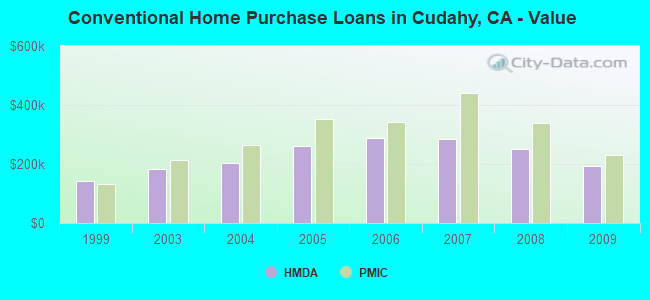
Home Mortgage Disclosure Act Aggregated Statistics For Year 2009(Based on 6 full tracts) A) FHA, FSA/RHS & VA B) Conventional C) Refinancings D) Home Improvement Loans E) Loans on Dwellings For 5+ Families F) Non-occupant Loans on Number Average Value Number Average Value Number Average Value Number Average Value Number Average Value Number Average Value
LOANS ORIGINATED 23 $250,217 13 $194,385 24 $237,083 2 $212,500 1 $757,000 5 $262,400 APPLICATIONS APPROVED, NOT ACCEPTED 1 $165,000 0 $0 7 $176,429 0 $0 0 $0 2 $138,000 APPLICATIONS DENIED 14 $250,357 4 $206,000 44 $267,136 4 $155,750 6 $472,333 6 $214,500 APPLICATIONS WITHDRAWN 4 $260,000 2 $253,000 15 $217,800 1 $25,000 0 $0 1 $95,000 FILES CLOSED FOR INCOMPLETENESS 2 $254,000 0 $0 5 $290,600 2 $35,000 0 $0 0 $0
Aggregated Statistics For Year 2008(Based on 6 full tracts) A) FHA, FSA/RHS & VA B) Conventional C) Refinancings D) Home Improvement Loans E) Loans on Dwellings For 5+ Families F) Non-occupant Loans on G) Loans On Manufactured Number Average Value Number Average Value Number Average Value Number Average Value Number Average Value Number Average Value Number Average Value
LOANS ORIGINATED 5 $273,000 10 $249,300 27 $284,185 6 $288,000 6 $857,333 7 $306,143 2 $77,000 APPLICATIONS APPROVED, NOT ACCEPTED 4 $283,750 10 $138,300 13 $327,846 1 $407,000 1 $500,000 2 $359,500 6 $79,167 APPLICATIONS DENIED 3 $288,000 9 $313,556 55 $291,309 9 $113,889 4 $967,500 4 $240,750 1 $30,000 APPLICATIONS WITHDRAWN 1 $423,000 6 $312,500 12 $309,750 0 $0 2 $620,000 1 $528,000 0 $0 FILES CLOSED FOR INCOMPLETENESS 0 $0 2 $277,000 4 $308,750 2 $50,000 0 $0 1 $170,000 0 $0
Aggregated Statistics For Year 2007(Based on 6 full tracts) B) Conventional C) Refinancings D) Home Improvement Loans E) Loans on Dwellings For 5+ Families F) Non-occupant Loans on G) Loans On Manufactured Number Average Value Number Average Value Number Average Value Number Average Value Number Average Value Number Average Value
LOANS ORIGINATED 41 $285,049 134 $326,761 17 $201,353 29 $1,015,862 15 $357,800 0 $0 APPLICATIONS APPROVED, NOT ACCEPTED 26 $249,038 40 $300,925 5 $322,000 3 $220,000 8 $313,875 4 $70,500 APPLICATIONS DENIED 24 $310,500 89 $351,978 24 $194,833 3 $363,333 22 $295,273 1 $54,000 APPLICATIONS WITHDRAWN 18 $338,111 35 $312,829 7 $273,000 2 $625,000 4 $359,750 0 $0 FILES CLOSED FOR INCOMPLETENESS 5 $367,200 11 $387,636 0 $0 1 $55,000 0 $0 0 $0
Aggregated Statistics For Year 2006(Based on 6 full tracts) B) Conventional C) Refinancings D) Home Improvement Loans E) Loans on Dwellings For 5+ Families F) Non-occupant Loans on G) Loans On Manufactured Number Average Value Number Average Value Number Average Value Number Average Value Number Average Value Number Average Value
LOANS ORIGINATED 85 $289,541 154 $301,123 22 $190,136 19 $670,947 28 $312,429 2 $43,000 APPLICATIONS APPROVED, NOT ACCEPTED 16 $252,812 37 $315,000 8 $106,875 0 $0 6 $339,167 4 $51,500 APPLICATIONS DENIED 34 $348,176 82 $342,122 22 $164,455 2 $166,000 15 $411,000 0 $0 APPLICATIONS WITHDRAWN 17 $286,706 54 $321,259 6 $279,833 0 $0 7 $443,857 0 $0 FILES CLOSED FOR INCOMPLETENESS 6 $229,500 16 $308,312 4 $294,500 1 $555,000 1 $433,000 0 $0
Aggregated Statistics For Year 2005(Based on 6 full tracts) B) Conventional C) Refinancings D) Home Improvement Loans E) Loans on Dwellings For 5+ Families F) Non-occupant Loans on G) Loans On Manufactured Number Average Value Number Average Value Number Average Value Number Average Value Number Average Value Number Average Value
LOANS ORIGINATED 94 $259,564 219 $249,269 20 $207,750 15 $945,200 33 $261,818 0 $0 APPLICATIONS APPROVED, NOT ACCEPTED 30 $204,833 39 $247,538 0 $0 0 $0 4 $210,000 3 $79,667 APPLICATIONS DENIED 53 $262,509 93 $277,344 23 $153,696 2 $402,500 13 $224,769 2 $59,500 APPLICATIONS WITHDRAWN 31 $249,903 68 $256,279 7 $239,286 0 $0 12 $233,750 1 $342,000 FILES CLOSED FOR INCOMPLETENESS 1 $291,000 14 $335,357 3 $207,333 0 $0 1 $416,000 0 $0
Aggregated Statistics For Year 2004(Based on 6 full tracts) A) FHA, FSA/RHS & VA B) Conventional C) Refinancings D) Home Improvement Loans E) Loans on Dwellings For 5+ Families F) Non-occupant Loans on G) Loans On Manufactured Number Average Value Number Average Value Number Average Value Number Average Value Number Average Value Number Average Value Number Average Value
LOANS ORIGINATED 2 $205,500 106 $203,623 191 $211,518 12 $126,750 34 $737,294 25 $248,560 0 $0 APPLICATIONS APPROVED, NOT ACCEPTED 0 $0 16 $225,750 46 $224,043 4 $181,000 1 $325,000 5 $222,200 0 $0 APPLICATIONS DENIED 0 $0 64 $247,859 105 $227,029 21 $130,286 7 $711,000 22 $323,818 2 $74,500 APPLICATIONS WITHDRAWN 0 $0 22 $263,136 60 $217,217 5 $76,600 1 $250,000 6 $203,000 0 $0 FILES CLOSED FOR INCOMPLETENESS 0 $0 9 $262,111 23 $217,261 0 $0 0 $0 3 $320,333 1 $61,000
Aggregated Statistics For Year 2003(Based on 6 full tracts) A) FHA, FSA/RHS & VA B) Conventional C) Refinancings D) Home Improvement Loans E) Loans on Dwellings For 5+ Families F) Non-occupant Loans on Number Average Value Number Average Value Number Average Value Number Average Value Number Average Value Number Average Value
LOANS ORIGINATED 5 $192,400 73 $182,493 243 $163,206 4 $98,250 23 $578,783 34 $149,147 APPLICATIONS APPROVED, NOT ACCEPTED 2 $123,500 13 $183,923 45 $170,289 1 $13,000 1 $1,088,000 7 $208,429 APPLICATIONS DENIED 2 $255,000 24 $169,542 123 $164,520 8 $23,000 2 $427,500 18 $135,278 APPLICATIONS WITHDRAWN 2 $219,000 9 $209,111 80 $169,862 1 $20,000 3 $644,333 10 $216,200 FILES CLOSED FOR INCOMPLETENESS 2 $201,000 1 $207,000 7 $175,429 0 $0 1 $750,000 2 $153,000
Aggregated Statistics For Year 1999(Based on 3 partial tracts) A) FHA, FSA/RHS & VA B) Conventional C) Refinancings D) Home Improvement Loans E) Loans on Dwellings For 5+ Families F) Non-occupant Loans on Number Average Value Number Average Value Number Average Value Number Average Value Number Average Value Number Average Value
LOANS ORIGINATED 12 $172,670 22 $143,601 43 $129,958 17 $28,975 5 $180,712 8 $129,058 APPLICATIONS APPROVED, NOT ACCEPTED 2 $207,700 0 $0 5 $74,630 1 $30,040 0 $0 1 $31,920 APPLICATIONS DENIED 7 $143,616 11 $120,077 20 $112,522 10 $19,207 3 $197,897 5 $120,826 APPLICATIONS WITHDRAWN 5 $121,702 2 $80,275 26 $117,923 1 $18,600 1 $244,590 3 $114,810 FILES CLOSED FOR INCOMPLETENESS 0 $0 2 $102,660 12 $136,595 0 $0 0 $0 1 $192,000
Detailed HMDA statistics for the following Tracts:
5343.01
, 5343.02 , 5344.03 , 5344.04 , 5344.05 , 5344.06
Private Mortgage Insurance Companies Aggregated Statistics For Year 2009(Based on 3 full tracts) A) Conventional Number Average Value
LOANS ORIGINATED 5 $229,600 APPLICATIONS APPROVED, NOT ACCEPTED 1 $351,000 APPLICATIONS DENIED 0 $0 APPLICATIONS WITHDRAWN 0 $0 FILES CLOSED FOR INCOMPLETENESS 0 $0
Aggregated Statistics For Year 2008(Based on 5 full tracts) A) Conventional B) Refinancings Number Average Value Number Average Value
LOANS ORIGINATED 8 $339,125 1 $302,000 APPLICATIONS APPROVED, NOT ACCEPTED 4 $330,500 3 $431,000 APPLICATIONS DENIED 1 $276,000 1 $442,000 APPLICATIONS WITHDRAWN 0 $0 0 $0 FILES CLOSED FOR INCOMPLETENESS 0 $0 0 $0
Aggregated Statistics For Year 2007(Based on 6 full tracts) A) Conventional B) Refinancings C) Non-occupant Loans on Number Average Value Number Average Value Number Average Value
LOANS ORIGINATED 1 $442,000 7 $402,714 0 $0 APPLICATIONS APPROVED, NOT ACCEPTED 1 $333,000 1 $350,000 1 $333,000 APPLICATIONS DENIED 0 $0 4 $315,000 0 $0 APPLICATIONS WITHDRAWN 0 $0 1 $327,000 0 $0 FILES CLOSED FOR INCOMPLETENESS 0 $0 0 $0 0 $0
Aggregated Statistics For Year 2006(Based on 3 full tracts) A) Conventional B) Refinancings C) Non-occupant Loans on Number Average Value Number Average Value Number Average Value
LOANS ORIGINATED 3 $343,667 4 $418,500 1 $333,000 APPLICATIONS APPROVED, NOT ACCEPTED 0 $0 0 $0 0 $0 APPLICATIONS DENIED 0 $0 0 $0 0 $0 APPLICATIONS WITHDRAWN 0 $0 0 $0 0 $0 FILES CLOSED FOR INCOMPLETENESS 0 $0 0 $0 0 $0
Aggregated Statistics For Year 2005(Based on 4 full tracts) A) Conventional B) Refinancings C) Non-occupant Loans on Number Average Value Number Average Value Number Average Value
LOANS ORIGINATED 6 $352,667 3 $289,000 1 $216,000 APPLICATIONS APPROVED, NOT ACCEPTED 1 $470,000 1 $353,000 0 $0 APPLICATIONS DENIED 1 $409,000 0 $0 0 $0 APPLICATIONS WITHDRAWN 1 $314,000 2 $457,500 0 $0 FILES CLOSED FOR INCOMPLETENESS 0 $0 0 $0 0 $0
Aggregated Statistics For Year 2004(Based on 5 full tracts) A) Conventional B) Refinancings C) Non-occupant Loans on Number Average Value Number Average Value Number Average Value
LOANS ORIGINATED 8 $264,375 1 $284,000 0 $0 APPLICATIONS APPROVED, NOT ACCEPTED 3 $172,333 4 $209,000 0 $0 APPLICATIONS DENIED 1 $345,000 0 $0 0 $0 APPLICATIONS WITHDRAWN 2 $345,000 0 $0 1 $345,000 FILES CLOSED FOR INCOMPLETENESS 0 $0 0 $0 0 $0
Aggregated Statistics For Year 2003(Based on 6 full tracts) A) Conventional B) Refinancings Number Average Value Number Average Value
LOANS ORIGINATED 15 $212,133 16 $194,688 APPLICATIONS APPROVED, NOT ACCEPTED 2 $177,000 1 $131,000 APPLICATIONS DENIED 0 $0 0 $0 APPLICATIONS WITHDRAWN 0 $0 0 $0 FILES CLOSED FOR INCOMPLETENESS 0 $0 0 $0
Aggregated Statistics For Year 1999(Based on 3 partial tracts) A) Conventional B) Refinancings Number Average Value Number Average Value
LOANS ORIGINATED 11 $130,682 7 $148,456 APPLICATIONS APPROVED, NOT ACCEPTED 1 $167,120 0 $0 APPLICATIONS DENIED 1 $88,820 1 $92,070 APPLICATIONS WITHDRAWN 1 $99,590 1 $122,060 FILES CLOSED FOR INCOMPLETENESS 0 $0 1 $118,300
Detailed PMIC statistics for the following Tracts:
5343.01
, 5343.02 , 5344.03 , 5344.04 , 5344.05 , 5344.06 Cudahy compared to California state average:
Median household income below state average. Black race population percentage significantly below state average. Hispanic race population percentage above state average. Median age below state average. Renting percentage above state average. Length of stay since moving in significantly above state average. Percentage of population with a bachelor's degree or higher significantly below state average.
#18 on the list of "Top 101 cities with the lowest percentage of English-only speaking households, population 5,000+"
#35 on the list of "Top 100 least-educated cities (pop. 5,000+)"
#44 on the list of "Top 100 cities with highest percentage of renters (pop. 5,000+)"
#50 on the list of "Top 100 least racially diverse cities (pop. 5,000+)"
#54 on the list of "Top 101 cities with the highest percentage of family households, population 10,000+"
#60 on the list of "Top 101 cities with the least people having Master's or Doctorate degrees (population 5,000+)"
#60 on the list of "Top 101 cities with the smallest percentage of divorced people (15+ years)(population 5,000+)"
#64 on the list of "Top 101 cities with largest percentage of females in occupations: material moving occupations (population 5,000+)"
#64 on the list of "Top 101 cities with the most residents born in Central America (population 500+)"
#68 on the list of "Top 100 cities with smallest houses (pop. 5,000+)"
#70 on the list of "Top 100 cities with highest percentage of foreign-born residents (pop. 5,000+)"
#82 on the list of "Top 101 cities with the most residents born in Americas (population 500+)"
#82 on the list of "Top 101 cities with the most residents born in Latin America (population 500+)"
#86 on the list of "Top 101 cities with the highest housing density (population 2,000+)"
#92 on the list of "Top 101 cities with the largest percentage of unmarried partner households (population 5,000+)"
#13 (90255) on the list of "Top 101 zip codes with the largest percentage of taxpayers using paid preparers for 2012 taxes (pop 5,000+)"
#65 (90255) on the list of "Top 101 zip codes with the smallest percentage of taxpayers reporting net capital gain/loss in 2012 (pop 5,000+)"
#86 (90255) on the list of "Top 101 zip codes with the largest percentage of Greek first ancestries (pop 5,000+)"
#1 on the list of "Top 101 counties with the most Evangelical Protestant congregations"
#1 on the list of "Top 101 counties with the most Mainline Protestant congregations"
#1 on the list of "Top 101 counties with the most Orthodox adherents"
#1 on the list of "Top 101 counties with the highest ground withdrawal of fresh water for public supply (pop. 50,000+)"
#1 on the list of "Top 101 counties with the most Catholic adherents (pop. 50,000+)"
Top Patent Applicants
Francisco Ochoa (2)
Francisco Javier Ochoa (1)
Edwin Molina (1)
Jose Zavala (1)
Total of 5 patent applications in 2008-2024.


 Recent articles from our blog. Our writers, many of them Ph.D. graduates or candidates, create easy-to-read articles on a wide variety of topics.

 (1.6 miles


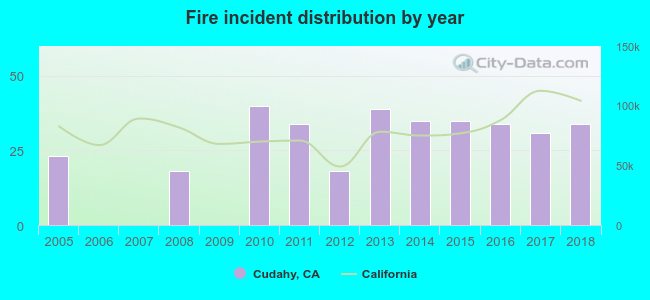 According to the data from the years 2005 - 2018 the average number of fires per year is 24. The highest number of fire incidents - 40 took place in 2010, and the least - 0 in 2006. The data has a rising trend.
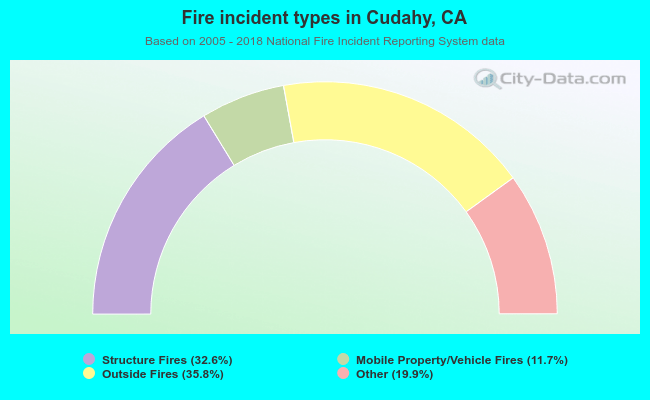 When looking into fire subcategories, the most incidents belonged to: Outside Fires (35.8%), and Structure Fires (32.6%).