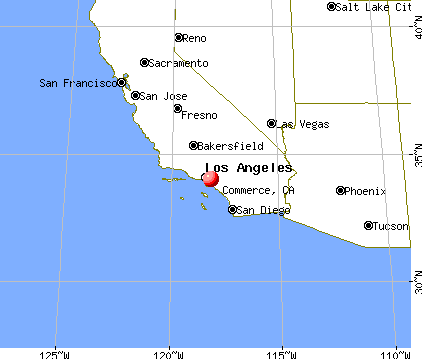
Commerce, California
Submit your own pictures of this city and show them to the world
- OSM Map
- General Map
- Google Map
- MSN Map
Population change since 2000: -5.9%
 |
| Males: 6,051 | |
| Females: 5,777 |
| Median resident age: | 38.1 years |
| California median age: | 37.9 years |
Zip codes: 90022, 90023, 90640.
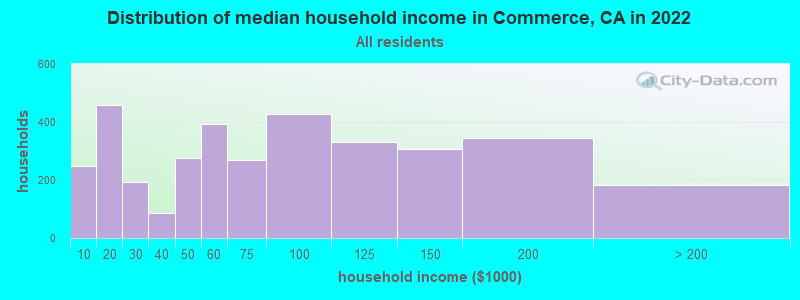
Commerce Zip Code Map| Commerce: | $65,362 |
| CA: | $91,551 |
Estimated per capita income in 2022: $25,272 (it was $11,117 in 2000)
Commerce city income, earnings, and wages data
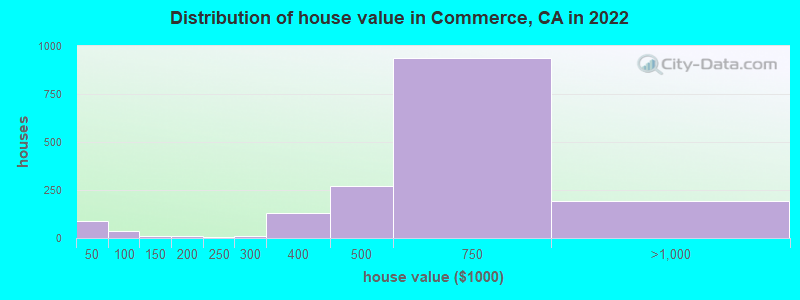
Estimated median house or condo value in 2022: $616,688 (it was $158,700 in 2000)
| Commerce: | $616,688 |
| CA: | $715,900 |
Mean prices in 2022: all housing units: $625,350; detached houses: $627,901; townhouses or other attached units: $594,225
Median gross rent in 2022: $1,310.
(17.7% for White Non-Hispanic residents, 13.4% for Hispanic or Latino residents, 11.8% for other race residents, 10.0% for two or more races residents)
Detailed information about poverty and poor residents in Commerce, CA


Compare current foreclosures near Commerce, CA:
| Photo | Address | Area | Beds / Baths | Price | Details |
|---|---|---|---|---|---|

|
#1
Millbury Ave
Baldwin Park, CA 91706
|
1,632 sq. feet
|
2 baths 4 beds |
$869,000
|
show details |

|
#2
E Norma Ave
West Covina, CA 91791
|
1,134 sq. feet
|
2 baths 3 beds |
$599,000
|
show details |

|
#3
Flicker Way
West Hollywood, CA 90069
|
1,612 sq. feet
|
3 baths 3 beds |
$2,195,500
|
show details |

|
#4
Horn Ave Apt 618
West Hollywood, CA 90069
|
797 sq. feet
|
1 baths 1 beds |
$650,000
|
show details |

|
#5
Hawkstone Ave
Whittier, CA 90605
|
1,444 sq. feet
|
2 baths 4 beds |
$674,900
|
show details |

|
#6
Aberdeen Ave
Los Angeles, CA 90027
|
6,957 sq. feet
|
4 baths 6 beds |
$5,040,000
|
show details |

|
#7
Cedarbrook Dr
Beverly Hills, CA 90210
|
2,371 sq. feet
|
2 baths 3 beds |
$2,350,000
|
show details |

|
#8
1238 S Redondo Blvd
Los Angeles, CA 90019
|
- sq. feet
|
2 baths 4 beds |
$849,900
|
show details |

|
#9
E Holton St
West Covina, CA 91791
|
- sq. feet
|
2 baths 3 beds |
$450,000
|
show details |

|
#10
Wilshire Blvd Apt 703
Los Angeles, CA 90024
|
2,245 sq. feet
|
2 baths 2 beds |
$1,750,000
|
show details |
| Photo | Address | Area | Beds / Baths | Price | Details |
|---|---|---|---|---|---|

|
#11
E 60th St
Los Angeles, CA 90001
|
1,883 sq. feet
|
3 baths 5 beds |
show details | |

|
#12
Redondo Avenue, Units 5-8
Long Beach, CA 90804
|
3,360 sq. feet
|
4 baths 8 beds |
show details | |

|
#13
Elburg St Unit A
Paramount, CA 90723
|
1,131 sq. feet
|
2 baths 3 beds |
show details | |

|
#14
Norwalk Blvd Apt
Hawaiian Gardens, CA 90716
|
800 sq. feet
|
2 baths 1 beds |
show details | |

|
#15
Bohlig Rd Apt 45
Los Angeles, CA 90032
|
813 sq. feet
|
2 baths 2 beds |
show details | |

|
#16
Mira Mar Ave
Long Beach, CA 90814
|
1,902 sq. feet
|
2 baths 4 beds |
show details | |

|
#17
N Commonwealth Ave
Los Angeles, CA 90004
|
3,937 sq. feet
|
6 baths 6 beds |
show details | |

|
#18
N Beachwood Dr
Los Angeles, CA 90068
|
1,848 sq. feet
|
2 baths 2 beds |
show details | |

|
#19
W 110th St
Inglewood, CA 90303
|
3,481 sq. feet
|
4 baths 6 beds |
show details | |

|
#20
And 6111 Northside Drive
Los Angeles, CA 90022
|
1,329 sq. feet
|
4 baths 3 beds |
show details |
| Photo | Address | Area | Beds / Baths | Price | Details |
|---|---|---|---|---|---|

|
#21
W Arbor St # 57
Long Beach, CA 90805
|
1,585 sq. feet
|
2 baths 3 beds |
show details | |

|
#22
Dunrobin Ave
Downey, CA 90242
|
3,000 sq. feet
|
4 baths 8 beds |
show details | |

|
#23
Flintridge Dr
Glendale, CA 91206
|
2,648 sq. feet
|
3 baths 5 beds |
show details | |

|
#24
W 168th Pl
Gardena, CA 90247
|
1,400 sq. feet
|
2 baths 4 beds |
show details | |

|
#25
S Wilmington Ave Apt A
Compton, CA 90220
|
1,137 sq. feet
|
2 baths 3 beds |
show details | |

|
#26
Cole St
Downey, CA 90242
|
1,768 sq. feet
|
2 baths 3 beds |
show details | |

|
#27
Lees Ave
Long Beach, CA 90808
|
887 sq. feet
|
1 baths 2 beds |
show details | |

|
#28
S Dancove Dr
West Covina, CA 91791
|
1,956 sq. feet
|
3 baths 3 beds |
show details | |

|
#29
W 94th St
Los Angeles, CA 90044
|
1,322 sq. feet
|
2 baths 3 beds |
show details | |

|
#30
Santa Fe Ave
Lynwood, CA 90262
|
1,124 sq. feet
|
2 baths 3 beds |
show details |
| Photo | Address | Area | Beds / Baths | Price | Details |
|---|---|---|---|---|---|

|
#31
Harlan Ave
Carson, CA 90746
|
1,422 sq. feet
|
2 baths 3 beds |
show details | |

|
#32
Hathaway Ave Unit 26
Long Beach, CA 90815
|
957 sq. feet
|
2 baths 2 beds |
show details | |

|
#33
E 129th St
Compton, CA 90222
|
1,673 sq. feet
|
1 baths 3 beds |
show details | |

|
#34
N Adelon Ln
Compton, CA 90221
|
1,900 sq. feet
|
3 baths 3 beds |
show details | |

|
#35
W 24th St
Los Angeles, CA 90018
|
1,271 sq. feet
|
2 baths 4 beds |
show details | |

|
#36
Parise Dr
Whittier, CA 90604
|
1,198 sq. feet
|
2 baths 3 beds |
show details | |

|
#37
Silver Lake Blvd
Los Angeles, CA 90026
|
3,192 sq. feet
|
4 baths 7 beds |
show details | |

|
#38
N Mott St
Los Angeles, CA 90033
|
784 sq. feet
|
1 baths 3 beds |
show details | |

|
#39
Lemoran Ave
Pico Rivera, CA 90660
|
1,633 sq. feet
|
2 baths 3 beds |
show details | |

|
#40
Lansdale Ave
El Monte, CA 91732
|
1,866 sq. feet
|
3 baths 6 beds |
show details |
| Photo | Address | Area | Beds / Baths | Price | Details |
|---|---|---|---|---|---|

|
#41
S Broadway
Los Angeles, CA 90061
|
1,620 sq. feet
|
3 baths 4 beds |
show details | |

|
#42
E Pinehurst Ave
La Habra, CA 90631
|
1,125 sq. feet
|
1 baths 3 beds |
show details | |

|
#43
Ocana Ave
Bellflower, CA 90706
|
1,218 sq. feet
|
2 baths 3 beds |
show details | |

|
#44
Johnson Ave
Long Beach, CA 90805
|
1,252 sq. feet
|
2 baths 3 beds |
show details | |

|
#45
Fredonia Dr
Los Angeles, CA 90068
|
1,564 sq. feet
|
2 baths 2 beds |
show details | |

|
#46
Main St.
West Covina, CA 91790
|
- sq. feet
|
- baths - beds |
$575,000
|
show details |

|
#47
Spry St
Norwalk, CA 90650
|
1,142 sq. feet
|
1 baths 3 beds |
show details | |

|
#48
W Tudor St
Covina, CA 91722
|
1,745 sq. feet
|
2 baths 4 beds |
show details | |

|
#49
Granby Pl
Rowland Heights, CA 91748
|
2,358 sq. feet
|
3 baths 5 beds |
show details | |

|
Check over 1 million property listings on Foreclosure.com!
|
browse all offers | |||


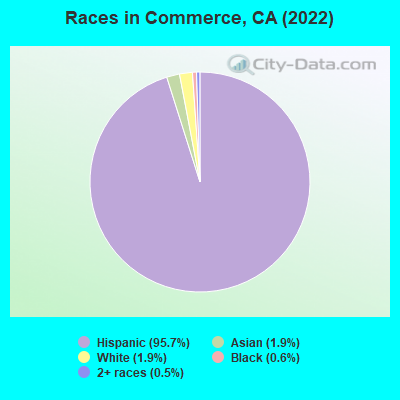
- 11,47695.7%Hispanic
- 2291.9%White alone
- 2301.9%Asian alone
- 670.6%Black alone
- 560.5%Two or more races
- 80.07%Other race alone
According to our research of California and other state lists, there were 6 registered sex offenders living in Commerce, California as of April 27, 2024.
The ratio of all residents to sex offenders in Commerce is 2,184 to 1.
The ratio of registered sex offenders to all residents in this city is much lower than the state average.
Type |
2009 |
2010 |
2011 |
2012 |
2013 |
2014 |
2015 |
2016 |
2017 |
2018 |
2019 |
2020 |
2022 |
|---|---|---|---|---|---|---|---|---|---|---|---|---|---|
| Murders (per 100,000) | 2 (14.8) | 2 (15.6) | 0 (0.0) | 1 (7.7) | 1 (7.7) | 0 (0.0) | 2 (15.2) | 1 (7.6) | 1 (7.7) | 1 (7.7) | 1 (7.8) | 3 (23.7) | 6 (50.9) |
| Rapes (per 100,000) | 2 (14.8) | 4 (31.2) | 5 (38.5) | 2 (15.3) | 2 (15.4) | 3 (23.0) | 10 (76.1) | 7 (53.3) | 6 (46.2) | 9 (69.4) | 5 (39.1) | 4 (31.6) | 8 (67.9) |
| Robberies (per 100,000) | 68 (502.6) | 54 (421.1) | 46 (354.6) | 53 (406.6) | 39 (300.1) | 34 (260.9) | 28 (213.1) | 56 (426.6) | 40 (307.8) | 48 (370.3) | 49 (382.7) | 43 (340.2) | 70 (593.9) |
| Assaults (per 100,000) | 118 (872.2) | 82 (639.5) | 65 (501.0) | 56 (429.6) | 41 (315.5) | 40 (306.9) | 53 (403.4) | 66 (502.7) | 59 (454.1) | 70 (540.1) | 83 (648.2) | 86 (680.3) | 99 (839.9) |
| Burglaries (per 100,000) | 138 (1,020) | 157 (1,224) | 117 (901.8) | 130 (997.3) | 101 (777.2) | 85 (652.2) | 100 (761.2) | 119 (906.5) | 131 (1,008) | 108 (833.3) | 128 (999.7) | 156 (1,234) | 244 (2,070) |
| Thefts (per 100,000) | 597 (4,413) | 511 (3,985) | 507 (3,908) | 616 (4,726) | 515 (3,963) | 622 (4,773) | 798 (6,074) | 744 (5,667) | 698 (5,372) | 646 (4,984) | 624 (4,873) | 555 (4,390) | 894 (7,585) |
| Auto thefts (per 100,000) | 285 (2,107) | 332 (2,589) | 325 (2,505) | 264 (2,025) | 277 (2,132) | 258 (1,980) | 349 (2,657) | 360 (2,742) | 345 (2,655) | 241 (1,859) | 252 (1,968) | 358 (2,832) | 496 (4,208) |
| Arson (per 100,000) | 12 (88.7) | 5 (39.0) | 10 (77.1) | 4 (30.7) | 6 (46.2) | 11 (84.4) | 8 (60.9) | 10 (76.2) | 4 (30.8) | 7 (54.0) | 16 (125.0) | 13 (102.8) | 13 (110.3) |
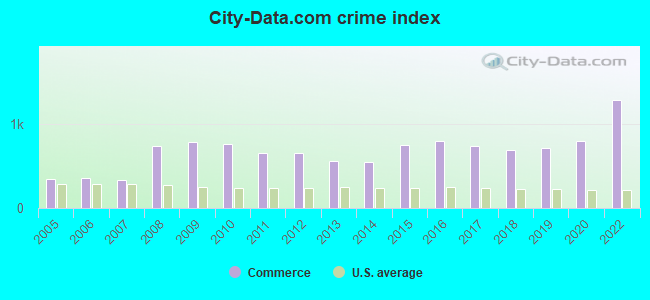
| City-Data.com crime index | 783.1 | 762.6 | 657.2 | 656.4 | 564.3 | 553.0 | 744.8 | 795.9 | 733.3 | 696.6 | 713.7 | 799.5 | 1287.2 |
The City-Data.com crime index weighs serious crimes and violent crimes more heavily. Higher means more crime, U.S. average is 246.1. It adjusts for the number of visitors and daily workers commuting into cities.
Crime rate in Commerce detailed stats: murders, rapes, robberies, assaults, burglaries, thefts, arson
Full-time law enforcement employees in 2015, including police officers: 1 (1 officers - 1 male; 0 female).
| Officers per 1,000 residents here: | 0.08 |
| California average: | 1.98 |
 Recent articles from our blog. Our writers, many of them Ph.D. graduates or candidates, create easy-to-read articles on a wide variety of topics.

 | COVID-19 Thread San Diego (2226 replies) |
| L.A City vs L.A County (46 replies) |
| California’s Most Dangerous Cities (13 replies) |
| Young Family.Work in Commerce. Where to live? (2 replies) |
| Cheapest area to live in CA (46 replies) |
| Anyone live part time or full time in June Lake? (1 reply) |
Latest news from Commerce, CA collected exclusively by city-data.com from local newspapers, TV, and radio stations
Current Local Time: PST time zone
Elevation: 146 feet
Land area: 6.57 square miles.
Population density: 1,801 people per square mile (low).
4,322 residents are foreign born (35.7% Latin America).
| This city: | 36.1% |
| California: | 26.5% |
Median real estate property taxes paid for housing units with mortgages in 2022: $3,834 (0.6%)
Median real estate property taxes paid for housing units with no mortgage in 2022: $2,784 (0.5%)
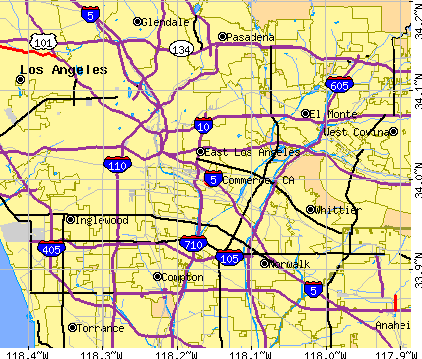
Nearest city with pop. 50,000+: East Los Angeles, CA (2.3 miles  , pop. 124,283).
Nearest city with pop. 200,000+: Southwest San Gabriel Valley, CA (4.9 miles , pop. 320,008).
Nearest city with pop. 1,000,000+: Los Angeles, CA (14.0 miles , pop. 3,694,820).
Nearest cities:
), ), Latitude: 34.00 N, Longitude: 118.15 W
Daytime population change due to commuting: +38,931 (+324.8%)
Workers who live and work in this city: 1,366 (25.0%)
Area code commonly used in this area: 323
Property values in Commerce, CA

Commerce tourist attractions:
Commerce, California accommodation & food services, waste management - Economy and Business Data
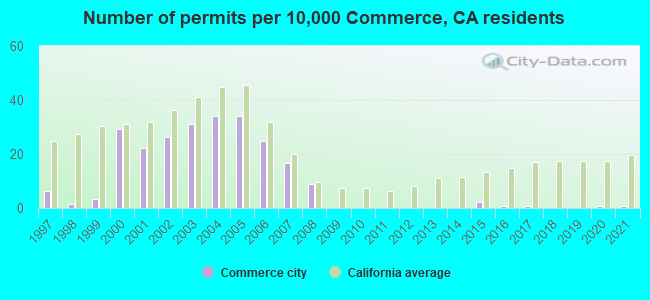
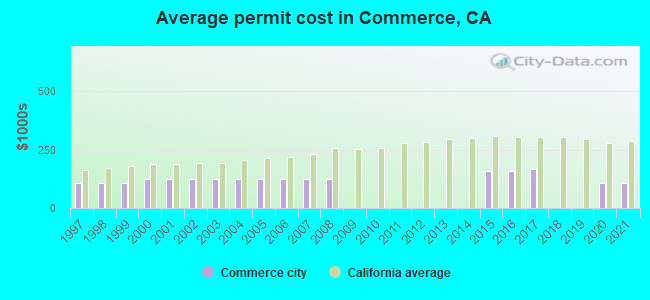
Single-family new house construction building permits:
- 2021: 1 building, cost: $107,400
- 2020: 1 building, cost: $107,400
- 2017: 1 building, cost: $165,000
- 2016: 1 building, cost: $158,600
- 2015: 3 buildings, average cost: $158,200
- 2008: 11 buildings, average cost: $123,300
- 2007: 21 buildings, average cost: $123,300
- 2006: 31 buildings, average cost: $123,300
- 2005: 43 buildings, average cost: $123,300
- 2004: 43 buildings, average cost: $123,300
- 2003: 39 buildings, average cost: $123,300
- 2002: 33 buildings, average cost: $123,300
- 2001: 28 buildings, average cost: $123,300
- 2000: 37 buildings, average cost: $123,300
- 1999: 4 buildings, average cost: $105,000
- 1998: 2 buildings, average cost: $105,000
- 1997: 8 buildings, average cost: $105,000
| Here: | 5.0% |
| California: | 5.1% |
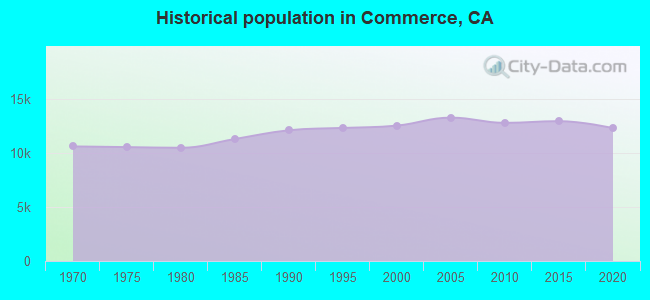
Population change in the 1990s: +435 (+3.6%).
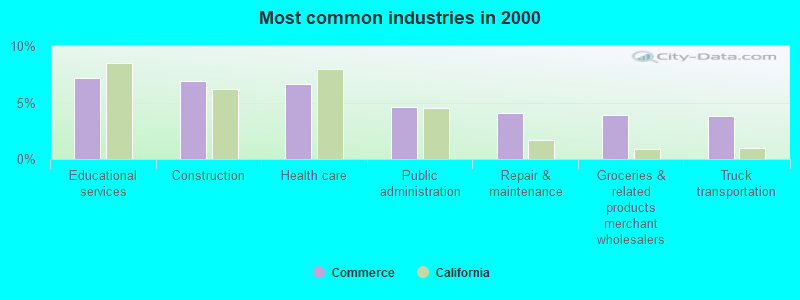
- Educational services (7.2%)
- Construction (6.9%)
- Health care (6.7%)
- Public administration (4.6%)
- Repair & maintenance (4.1%)
- Groceries & related products merchant wholesalers (3.9%)
- Truck transportation (3.8%)
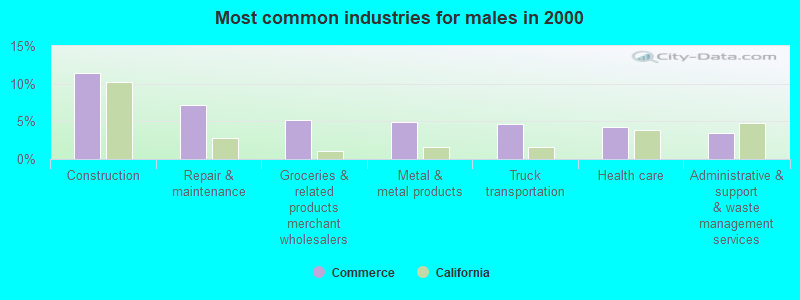
- Construction (11.4%)
- Repair & maintenance (7.1%)
- Groceries & related products merchant wholesalers (5.1%)
- Metal & metal products (4.9%)
- Truck transportation (4.6%)
- Health care (4.2%)
- Administrative & support & waste management services (3.4%)
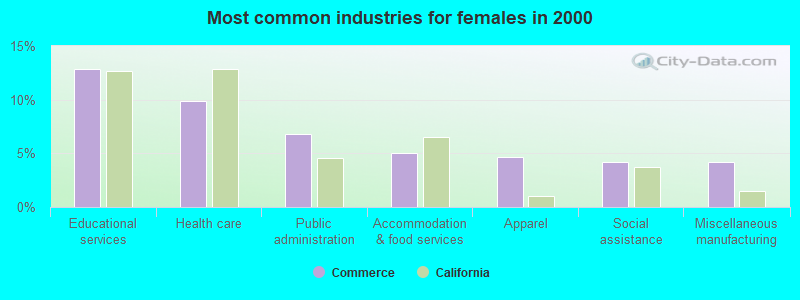
- Educational services (12.9%)
- Health care (9.9%)
- Public administration (6.8%)
- Accommodation & food services (5.0%)
- Apparel (4.7%)
- Social assistance (4.2%)
- Miscellaneous manufacturing (4.2%)
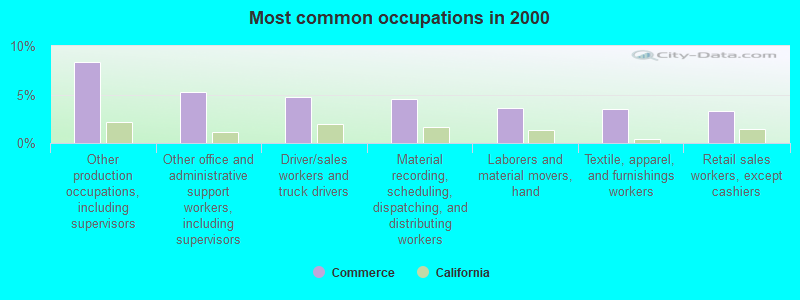
- Other production occupations, including supervisors (8.3%)
- Other office and administrative support workers, including supervisors (5.3%)
- Driver/sales workers and truck drivers (4.7%)
- Material recording, scheduling, dispatching, and distributing workers (4.6%)
- Laborers and material movers, hand (3.6%)
- Textile, apparel, and furnishings workers (3.5%)
- Retail sales workers, except cashiers (3.3%)
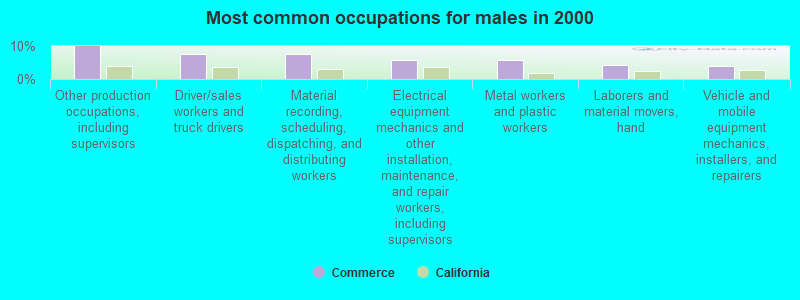
- Other production occupations, including supervisors (9.9%)
- Driver/sales workers and truck drivers (7.7%)
- Material recording, scheduling, dispatching, and distributing workers (7.4%)
- Electrical equipment mechanics and other installation, maintenance, and repair workers, including supervisors (5.7%)
- Metal workers and plastic workers (5.7%)
- Laborers and material movers, hand (4.3%)
- Vehicle and mobile equipment mechanics, installers, and repairers (4.1%)
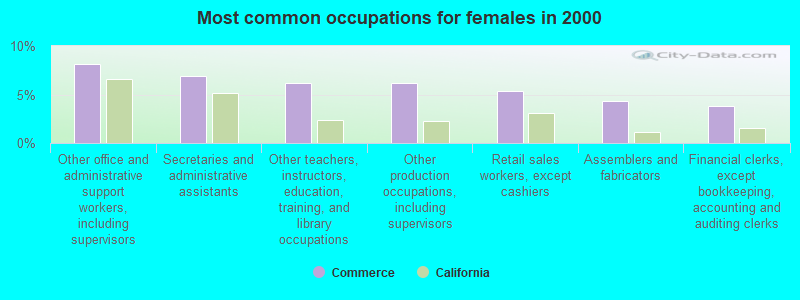
- Other office and administrative support workers, including supervisors (8.1%)
- Secretaries and administrative assistants (6.9%)
- Other teachers, instructors, education, training, and library occupations (6.2%)
- Other production occupations, including supervisors (6.2%)
- Retail sales workers, except cashiers (5.3%)
- Assemblers and fabricators (4.3%)
- Financial clerks, except bookkeeping, accounting and auditing clerks (3.8%)
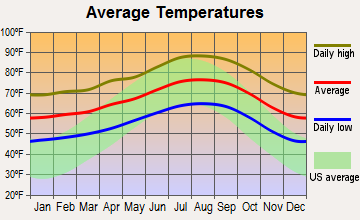
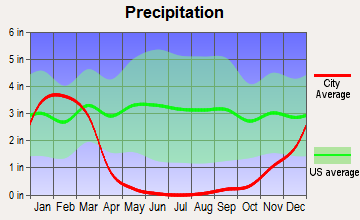
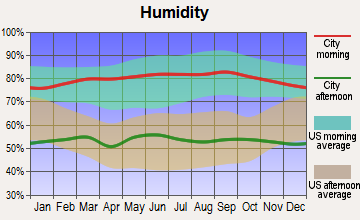
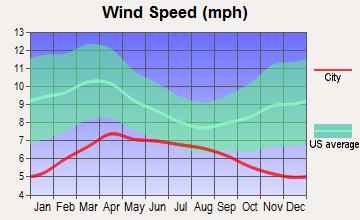
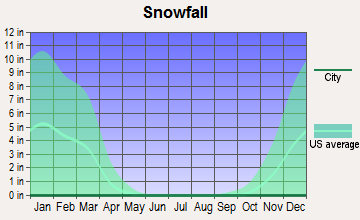
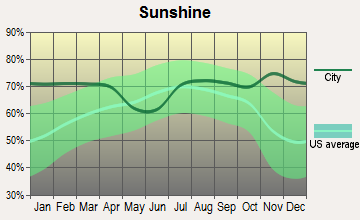
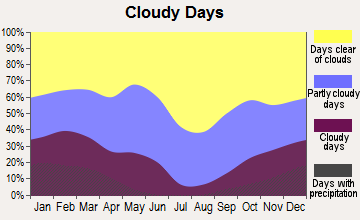
Average climate in Commerce, California
Based on data reported by over 4,000 weather stations
(lower is better)
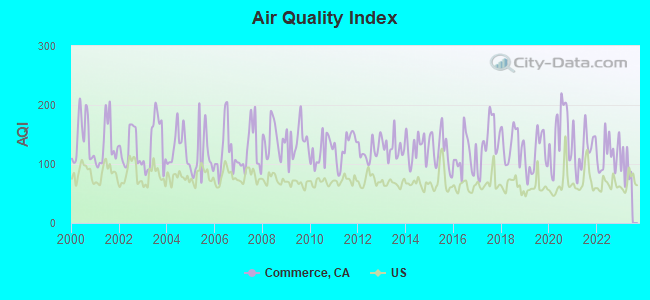
Air Quality Index (AQI) level in 2022 was 117. This is significantly worse than average.
| City: | 117 |
| U.S.: | 73 |
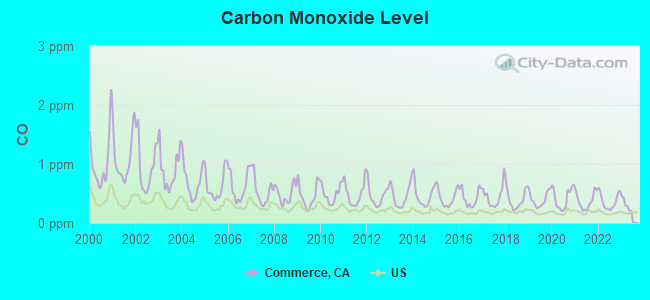
Carbon Monoxide (CO) [ppm] level in 2022 was 0.368. This is significantly worse than average. Closest monitor was 4.3 miles away from the city center.
| City: | 0.368 |
| U.S.: | 0.251 |
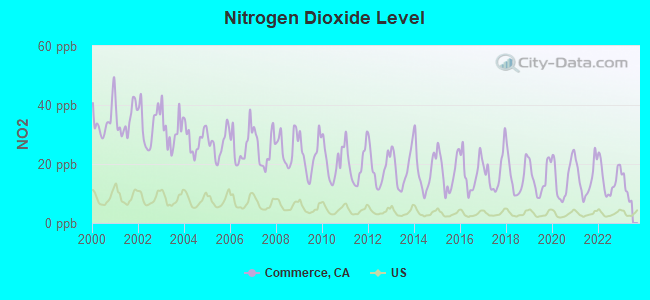
Nitrogen Dioxide (NO2) [ppb] level in 2022 was 14.9. This is significantly worse than average. Closest monitor was 4.3 miles away from the city center.
| City: | 14.9 |
| U.S.: | 5.1 |
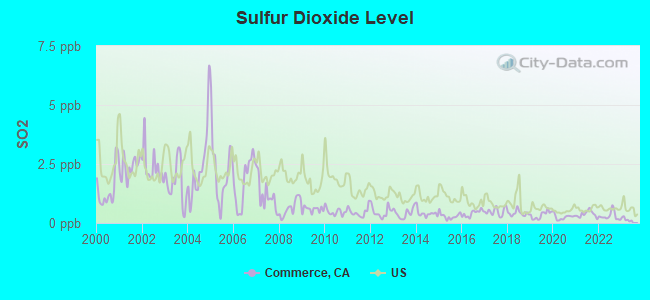
Sulfur Dioxide (SO2) [ppb] level in 2022 was 0.296. This is significantly better than average. Closest monitor was 4.3 miles away from the city center.
| City: | 0.296 |
| U.S.: | 1.515 |
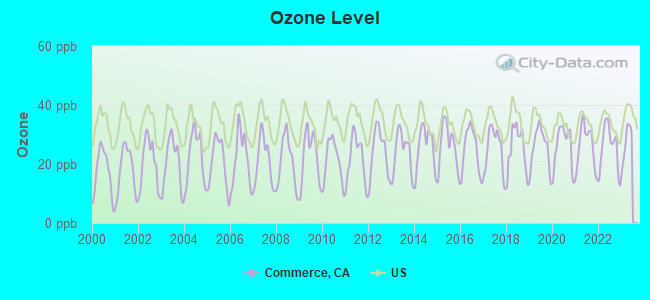
Ozone [ppb] level in 2022 was 25.7. This is better than average. Closest monitor was 4.3 miles away from the city center.
| City: | 25.7 |
| U.S.: | 33.3 |
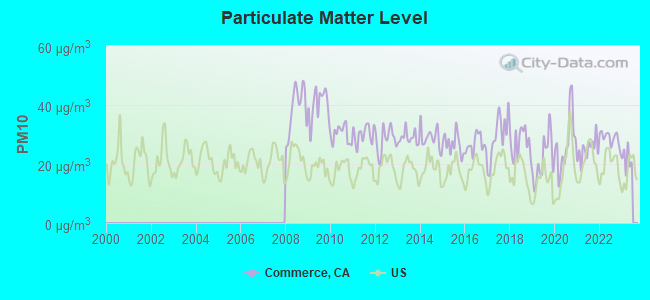
Particulate Matter (PM10) [µg/m3] level in 2022 was 28.7. This is significantly worse than average. Closest monitor was 6.2 miles away from the city center.
| City: | 28.7 |
| U.S.: | 19.2 |
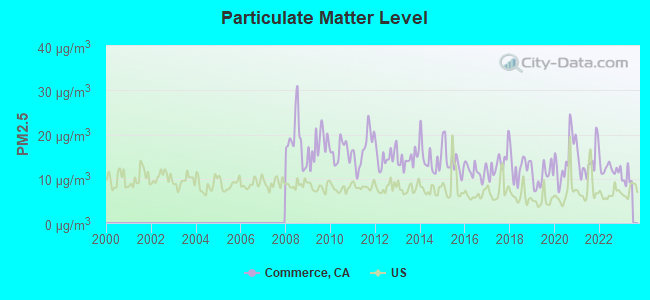
Particulate Matter (PM2.5) [µg/m3] level in 2022 was 12.3. This is significantly worse than average. Closest monitor was 5.0 miles away from the city center.
| City: | 12.3 |
| U.S.: | 8.1 |
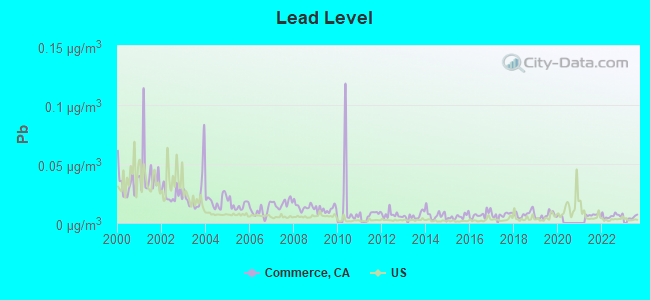
Lead (Pb) [µg/m3] level in 2022 was 0.00605. This is significantly better than average. Closest monitor was 1.3 miles away from the city center.
| City: | 0.00605 |
| U.S.: | 0.00931 |
Earthquake activity:
Commerce-area historical earthquake activity is significantly above California state average. It is 6999% greater than the overall U.S. average.On 7/21/1952 at 11:52:14, a magnitude 7.7 (7.7 UK, Class: Major, Intensity: VIII - XII) earthquake occurred 84.3 miles away from Commerce center, causing $50,000,000 total damage
On 6/28/1992 at 11:57:34, a magnitude 7.6 (6.2 MB, 7.6 MS, 7.3 MW, Depth: 0.7 mi) earthquake occurred 93.8 miles away from Commerce center, causing 3 deaths (1 shaking deaths, 2 other deaths) and 400 injuries, causing $100,000,000 total damage and $40,000,000 insured losses
On 10/16/1999 at 09:46:44, a magnitude 7.4 (6.3 MB, 7.4 MS, 7.2 MW, 7.3 ML) earthquake occurred 104.6 miles away from Commerce center
On 11/4/1927 at 13:51:53, a magnitude 7.5 (7.5 UK) earthquake occurred 175.8 miles away from the city center
On 1/17/1994 at 12:30:55, a magnitude 6.8 (6.4 MB, 6.8 MS, 6.7 MW, Depth: 11.4 mi, Class: Strong, Intensity: VII - IX) earthquake occurred 26.4 miles away from the city center, causing 60 deaths (60 shaking deaths) and 7000 injuries
On 4/21/1918 at 22:32:30, a magnitude 6.8 (6.8 UK) earthquake occurred 43.1 miles away from Commerce center
Magnitude types: body-wave magnitude (MB), local magnitude (ML), surface-wave magnitude (MS), moment magnitude (MW)
Natural disasters:
The number of natural disasters in Los Angeles County (57) is a lot greater than the US average (15).Major Disasters (Presidential) Declared: 27
Emergencies Declared: 3
Causes of natural disasters: Fires: 37, Floods: 16, Storms: 9, Winter Storms: 6, Landslides: 5, Mudslides: 5, Earthquakes: 3, Freeze: 1, Heavy Rain: 1, Hurricane: 1, Snow: 1, Tornado: 1, Wind: 1, Other: 1 (Note: some incidents may be assigned to more than one category).
Main business address for: UNIFIED WESTERN GROCERS INC (WHOLESALE-GROCERIES & GENERAL LINE), INNOVO GROUP INC (MISCELLANEOUS FABRICATED TEXTILE PRODUCTS).
Hospitals and medical centers in Commerce:
Other hospitals and medical centers near Commerce:
- RAI-EAST OLYMPIC-LOS ANGELES (Dialysis Facility, about 2 miles away; LOS ANGELES, CA)
- EAST LOS ANGELES DIALYSIS CENTER (Dialysis Facility, about 2 miles away; EAST LOS ANGELES, CA)
- MONTEBELLO ARTIFICIAL KIDNEY CENTER (Dialysis Facility, about 2 miles away; MONTEBELLO, CA)
- PERITONEAL DIALYSIS CENTER OF AMERICA, INC. (Dialysis Facility, about 2 miles away; MONTEBELLO, CA)
- DOCTORS DIALYSIS CENTER OF EAST LOS ANGELES (Dialysis Facility, about 2 miles away; EAST LOS ANGELES, CA)
- LOS ANGELES COMMUNITY HOSPITAL Acute Care Hospitals (about 3 miles away; LOS ANGELES, CA)
- DOCTORS DIALYSIS CENTER OF MONTEBELLO (Dialysis Facility, about 3 miles away; MONTEBELLO, CA)
Amtrak stations near Commerce:
- 7 miles: LOS ANGELES (800 N. ALAMEDA ST.) . Services: ticket office, fully wheelchair accessible, enclosed waiting area, public restrooms, public payphones, snack bar, free short-term parking, paid long-term parking, car rental agency, taxi stand, public transit connection.
- 10 miles: PASADENA (150 S. ROBLES AVE.) - Bus Station . Services: fully wheelchair accessible, enclosed waiting area, public restrooms, public payphones, full-service food facilities, paid short-term parking, paid long-term parking, taxi stand, public transit connection.
- 11 miles: GLENDALE (400 W. CERRITOS AVE.) . Services: fully wheelchair accessible, public payphones, free short-term parking, free long-term parking, call for taxi service, intercity bus service, public transit connection.
College/University in Commerce:
Colleges/universities with over 2000 students nearest to Commerce:
- East Los Angeles College (about 3 miles; Monterey Park, CA; Full-time enrollment: 17,297)
- Marinello Schools of Beauty-Los Angeles (about 5 miles; Los Angeles, CA; FT enrollment: 3,923)
- United Education Institute-Huntington Park Campus (about 5 miles; Huntington Park, CA; FT enrollment: 5,151)
- ICDC College (about 5 miles; Huntington Park, CA; FT enrollment: 2,621)
- California State University-Los Angeles (about 5 miles; Los Angeles, CA; FT enrollment: 17,545)
- Fashion Institute of Design & Merchandising-Los Angeles (about 7 miles; Los Angeles, CA; FT enrollment: 3,705)
- Los Angeles Trade Technical College (about 7 miles; Los Angeles, CA; FT enrollment: 7,421)
Public elementary/middle schools in Commerce:
- ROSEWOOD PARK (Students: 701, Location: 2353 COMMERCE WAY, Grades: KG-8)
- LAGUNA NUEVA (Students: 540, Location: 6360 S. GARFIELD AVE., Grades: KG-8)
- BANDINI ELEMENTARY (Students: 332, Location: 2318 COUTS AVE., Grades: KG-5)
Points of interest:
Notable locations in Commerce: Commerce Public Library (A), Commerce City Hall (B), Los Angeles County Fire Department Station 27 (C), Hazardous Material Unit Central Los Angeles County (D), Los Angeles County Fire Department Station 50 (E), Los Angeles County Fire Department Station 22 (F). Display/hide their locations on the map
Main business address in Commerce include: UNIFIED WESTERN GROCERS INC (A), INNOVO GROUP INC (B). Display/hide their locations on the map
Churches in Commerce include: Greenwood Community Church (A), Church of God (B). Display/hide their locations on the map
Cemeteries: Mount Carmel Cemetery (1), Russian Molokan Cemetery (2), Memorial Park (3), Park Lawn Cemetery (4). Display/hide their locations on the map
Parks in Commerce include: Bristow Park (1), Rosewood Park (2), Bandini Park (3), Veterans Memorial Park (4). Display/hide their locations on the map
Birthplace of: Carlos Molina - Boxer.
Drinking water stations with addresses in Commerce that have no violations reported:
- HENNINGER FLATS (Population served: 25, Primary Water Source Type: Surface water)
- CENTRAL BASIN MWD (Population served: 0, Primary Water Source Type: Groundwater)
| This city: | 3.8 people |
| California: | 2.9 people |
| This city: | 80.1% |
| Whole state: | 68.7% |
| This city: | 8.0% |
| Whole state: | 7.2% |
Likely homosexual households (counted as self-reported same-sex unmarried-partner households)
- Lesbian couples: 0.3% of all households
- Gay men: 0.4% of all households
2 people in other noninstitutional facilities in 2010
People in group quarters in Commerce in 2000:
- 97 people in training schools for juvenile delinquents
- 3 people in other nonhousehold living situations
- 2 people in religious group quarters
Banks with branches in Commerce (2011 data):
- Banco Popular North America: City Of Commerce Branch at 6001 East Washington Boulevard, branch established on 1983/06/16. Info updated 2012/01/27: Bank assets: $8,605.3 mil, Deposits: $6,167.7 mil, headquarters in New York, NY, positive income, Commercial Lending Specialization, 97 total offices, Holding Company: Popular, Inc.
- OneWest Bank, FSB: 5701 South Eastern Ave. at 5701 South Eastern Ave. Ste 108, branch established on 2005/11/27. Info updated 2011/07/21: Bank assets: $26,181.3 mil, Deposits: $15,408.4 mil, headquarters in Pasadena, CA, positive income, 79 total offices
For population 15 years and over in Commerce:
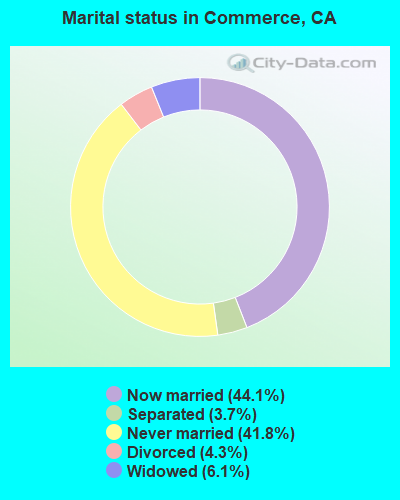
- Never married: 41.8%
- Now married: 44.1%
- Separated: 3.7%
- Widowed: 6.1%
- Divorced: 4.3%
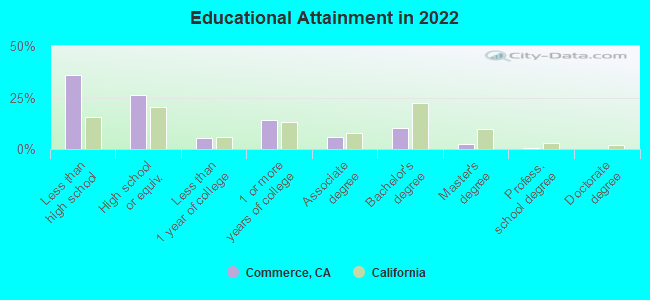
For population 25 years and over in Commerce:
- High school or higher: 63.8%
- Bachelor's degree or higher: 12.2%
- Graduate or professional degree: 2.5%
- Unemployed: 14.9%
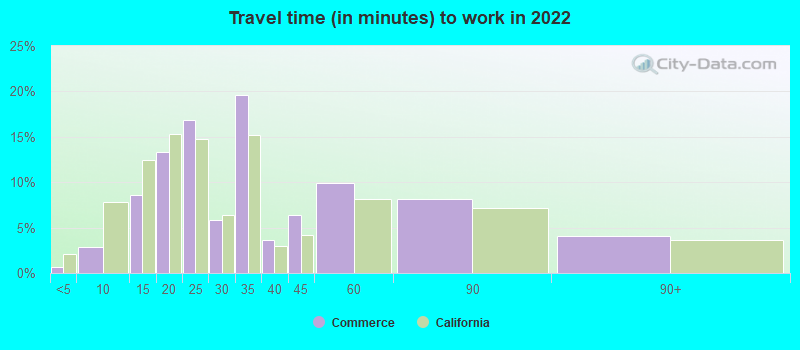
- Mean travel time to work (commute): 23.6 minutes
| Here: | 20.7 |
| California average: | 15.5 |


Graphs represent county-level data. Detailed 2008 Election Results
Religion statistics for Commerce, CA (based on Los Angeles County data)


| Religion | Adherents | Congregations |
|---|---|---|
| Catholic | 3,542,994 | 275 |
| Evangelical Protestant | 814,611 | 3,249 |
| Other | 451,594 | 1,023 |
| Mainline Protestant | 229,056 | 860 |
| Black Protestant | 112,338 | 290 |
| Orthodox | 63,517 | 76 |
| None | 4,604,495 | - |
Food Environment Statistics:
| Los Angeles County: | 2.12 / 10,000 pop. |
| California: | 2.14 / 10,000 pop. |
| This county: | 0.03 / 10,000 pop. |
| California: | 0.04 / 10,000 pop. |
| Los Angeles County: | 0.58 / 10,000 pop. |
| State: | 0.62 / 10,000 pop. |
| Los Angeles County: | 1.23 / 10,000 pop. |
| California: | 1.49 / 10,000 pop. |
| Los Angeles County: | 7.15 / 10,000 pop. |
| California: | 7.42 / 10,000 pop. |
| Los Angeles County: | 7.5% |
| State: | 7.3% |
| This county: | 20.4% |
| California: | 21.3% |
| Here: | 18.6% |
| State: | 17.9% |
Health and Nutrition:
| Here: | 46.0% |
| California: | 49.4% |
| This city: | 43.7% |
| California: | 48.0% |
| This city: | 28.3 |
| California: | 28.1 |
| Commerce: | 22.7% |
| California: | 20.2% |
| Commerce: | 11.1% |
| California: | 11.2% |
| Commerce: | 6.8 |
| California: | 6.8 |
| This city: | 29.7% |
| California: | 31.5% |
| Here: | 52.1% |
| California: | 56.4% |
| Here: | 80.9% |
| California: | 80.9% |
More about Health and Nutrition of Commerce, CA Residents
| Local government employment and payroll (March 2022) | |||||
| Function | Full-time employees | Monthly full-time payroll | Average yearly full-time wage | Part-time employees | Monthly part-time payroll |
|---|---|---|---|---|---|
| Other Government Administration | 31 | $306,883 | $118,793 | 1 | $3,572 |
| Parks and Recreation | 30 | $202,343 | $80,937 | 98 | $199,505 |
| Transit | 27 | $189,908 | $84,404 | 20 | $83,617 |
| Local Libraries | 16 | $107,334 | $80,501 | 3 | $11,489 |
| Other and Unallocable | 14 | $72,638 | $62,261 | 7 | $25,596 |
| Financial Administration | 8 | $56,864 | $85,296 | 2 | $5,980 |
| Housing and Community Development (Local) | 3 | $32,459 | $129,836 | 0 | $0 |
| Welfare | 2 | $13,720 | $82,320 | 17 | $67,330 |
| Totals for Government | 131 | $982,148 | $89,968 | 148 | $397,090 |
Commerce government finances - Expenditure in 2021 (per resident):
- Construction - Regular Highways: $4,257,000 ($359.91)
General - Other: $250,000 ($21.14)
Parks and Recreation: $52,000 ($4.40)
General Public Buildings: $25,000 ($2.11)
- Current Operations - Central Staff Services: $16,970,000 ($1434.73)
Transit Utilities: $15,229,000 ($1287.54)
Local Fire Protection: $12,783,000 ($1080.74)
Police Protection: $10,124,000 ($855.94)
Regular Highways: $8,149,000 ($688.96)
Parks and Recreation: $6,616,000 ($559.35)
Protective Inspection and Regulation - Other: $3,390,000 ($286.61)
Libraries: $2,922,000 ($247.04)
Gas Utilities: $2,602,000 ($219.99)
Financial Administration: $1,529,000 ($129.27)
Judicial and Legal Services: $544,000 ($45.99)
Health - Other: $407,000 ($34.41)
General - Other: $310,000 ($26.21)
Housing and Community Development: $127,000 ($10.74)
Water Utilities: $116,000 ($9.81)
- General - Interest on Debt: $1,178,000 ($99.59)
- Other Capital Outlay - Transit Utilities: $1,314,000 ($111.09)
Commerce government finances - Revenue in 2021 (per resident):
- Charges - Other: $2,613,000 ($220.92)
Solid Waste Management: $1,223,000 ($103.40)
Parks and Recreation: $44,000 ($3.72)
- Federal Intergovernmental - Transit Utilities: $3,745,000 ($316.62)
Other: $159,000 ($13.44)
Housing and Community Development: $56,000 ($4.73)
- Local Intergovernmental - Transit Utilities: $2,006,000 ($169.60)
- Miscellaneous - General Revenue - Other: $3,907,000 ($330.32)
Fines and Forfeits: $1,392,000 ($117.69)
Interest Earnings: $952,000 ($80.49)
Rents: $898,000 ($75.92)
Special Assessments: $352,000 ($29.76)
Donations From Private Sources: $160,000 ($13.53)
- Revenue - Gas Utilities: $3,216,000 ($271.90)
Water Utilities: $845,000 ($71.44)
Transit Utilities: $12,000 ($1.01)
- State Intergovernmental - Other: $1,730,000 ($146.26)
Transit Utilities: $1,090,000 ($92.15)
Highways: $541,000 ($45.74)
General Local Government Support: $8,000 ($0.68)
- Tax - General Sales and Gross Receipts: $32,410,000 ($2740.11)
Other: $13,529,000 ($1143.81)
Property: $5,440,000 ($459.93)
Other License: $2,666,000 ($225.40)
Other Selective Sales: $1,717,000 ($145.16)
Occupation and Business License - Other: $1,314,000 ($111.09)
Public Utilities Sales: $1,115,000 ($94.27)
Documentary and Stock Transfer: $113,000 ($9.55)
Commerce government finances - Debt in 2021 (per resident):
- Long Term Debt - Beginning Outstanding - Unspecified Public Purpose: $17,374,000 ($1468.89)
Outstanding Unspecified Public Purpose: $16,593,000 ($1402.86)
Retired Unspecified Public Purpose: $780,000 ($65.95)
Commerce government finances - Cash and Securities in 2021 (per resident):
- Bond Funds - Cash and Securities: $26,263,000 ($2220.41)
- Other Funds - Cash and Securities: $49,558,000 ($4189.89)
- Sinking Funds - Cash and Securities: $17,069,000 ($1443.10)
2.98% of this county's 2021 resident taxpayers lived in other counties in 2020 ($81,235 average adjusted gross income)
| Here: | 2.98% |
| California average: | 5.19% |
0.01% of residents moved from foreign countries ($155 average AGI)
Los Angeles County: 0.01% California average: 0.03%
Top counties from which taxpayers relocated into this county between 2020 and 2021:
| from Orange County, CA | |
| from San Bernardino County, CA | |
| from Riverside County, CA |
4.68% of this county's 2020 resident taxpayers moved to other counties in 2021 ($97,324 average adjusted gross income)
| Here: | 4.68% |
| California average: | 6.14% |
0.01% of residents moved to foreign countries ($196 average AGI)
Los Angeles County: 0.01% California average: 0.02%
Top counties to which taxpayers relocated from this county between 2020 and 2021:
| to Orange County, CA | |
| to San Bernardino County, CA | |
| to Riverside County, CA |
| Businesses in Commerce, CA | ||||
| Name | Count | Name | Count | |
|---|---|---|---|---|
| 7-Eleven | 1 | Justice | 1 | |
| Aeropostale | 1 | Kmart | 1 | |
| Aerosoles | 1 | Levi Strauss & Co. | 1 | |
| Ann Taylor | 1 | MasterBrand Cabinets | 2 | |
| Banana Republic | 1 | Nike | 3 | |
| Casual Male XL | 1 | Office Depot | 1 | |
| Church's Chicken | 1 | Old Navy | 1 | |
| Clarks | 1 | Ramada | 2 | |
| Costco | 1 | SAS Shoes | 1 | |
| FedEx | 1 | Sears | 1 | |
| Foot Locker | 1 | Skechers USA | 1 | |
| Gap | 1 | Sprint Nextel | 1 | |
| H&R Block | 1 | Subway | 1 | |
| Hilton | 1 | Super 8 | 1 | |
| Holiday Inn | 1 | T-Mobile | 1 | |
| Home Depot | 1 | Taco Bell | 1 | |
| Jack In The Box | 2 | U-Haul | 1 | |
| Jones New York | 1 | Vans | 3 | |
| Journeys | 1 | Verizon Wireless | 1 | |
Strongest AM radio stations in Commerce:
- KFWB (980 AM; 50 kW; LOS ANGELES, CA; Owner: INFINITY BROADCASTING OPERATIONS, INC.)
- KMPC (1540 AM; 50 kW; LOS ANGELES, CA; Owner: ROSE CITY RADIO CORPORATION)
- KLAC (570 AM; 50 kW; LOS ANGELES, CA; Owner: AMFM RADIO LICENSES, L.L.C.)
- KFI (640 AM; 50 kW; LOS ANGELES, CA; Owner: CAPSTAR TX LIMITED PARTNERSHIP)
- KXMX (1190 AM; 25 kW; ANAHEIM, CA; Owner: NEW INSPIRATION BROADCASTING COMPANY)
- KTNQ (1020 AM; 50 kW; LOS ANGELES, CA; Owner: KTNQ-AM LICENSE CORP.)
- KBLA (1580 AM; 50 kW; SANTA MONICA, CA)
- KXTA (1150 AM; 50 kW; LOS ANGELES, CA; Owner: CITICASTERS LICENSES, L.P.)
- KDIS (1110 AM; 50 kW; PASADENA, CA; Owner: ABC,INC.)
- KRLA (870 AM; 20 kW; GLENDALE, CA; Owner: NEW INSPIRATION BROADCASTING COMPANY)
- KNX (1070 AM; 50 kW; LOS ANGELES, CA; Owner: INFINITY BROADCASTING OPERATIONS, INC.)
- KSPN (710 AM; 50 kW; LOS ANGELES, CA; Owner: KABC-AM RADIO, INC.)
- KLTX (1390 AM; 5 kW; LONG BEACH, CA; Owner: HI-FAVOR BROADCASTING, LLC)
Strongest FM radio stations in Commerce:
- KZLA-FM (93.9 FM; LOS ANGELES, CA; Owner: EMMIS RADIO LICENSE CORPORATION)
- KPWR (105.9 FM; LOS ANGELES, CA; Owner: EMMIS RADIO LICENSE CORPORATION)
- KLSX (97.1 FM; LOS ANGELES, CA; Owner: INFINITY BROADCASTING OPERATIONS, INC.)
- KUSC (91.5 FM; LOS ANGELES, CA; Owner: UNIVERSITY OF SOUTHERN CALIFORNIA)
- KKLA-FM (99.5 FM; LOS ANGELES, CA; Owner: NEW INSPIRATION BROADCASTING CO., INC.)
- KRTH-FM (101.1 FM; LOS ANGELES, CA; Owner: INFINITY BROADCASTING OPERATIONS, INC.)
- KCBS-FM (93.1 FM; LOS ANGELES, CA; Owner: INFINITY BROADCASTING OPERATIONS, INC.)
- KKBT (100.3 FM; LOS ANGELES, CA; Owner: RADIO ONE LICENSES, LLC)
- KSCA (101.9 FM; GLENDALE, CA; Owner: HBC LICENSE CORPORATION)
- KLOS (95.5 FM; LOS ANGELES, CA; Owner: KLOS-FM RADIO, INC.)
- K212FA (90.3 FM; TEMPLE CITY, CA; Owner: EDUCATIONAL MEDIA FOUNDATION)
- KOST (103.5 FM; LOS ANGELES, CA; Owner: CAPSTAR TX LIMITED PARTNERSHIP)
- KIIS-FM (102.7 FM; LOS ANGELES, CA; Owner: CITICASTERS LICENSES, L.P.)
- KLVE (107.5 FM; LOS ANGELES, CA; Owner: KLVE-FM LICENSE CORP.)
- KPCC (89.3 FM; PASADENA, CA; Owner: PASADENA AREA COMMUNITY COLLEGE DISTRICT)
- KHHT (92.3 FM; LOS ANGELES, CA; Owner: AMFM RADIO LICENSES, L.L.C.)
- KBIG-FM (104.3 FM; LOS ANGELES, CA; Owner: AMFM RADIO LICENSES, L.L.C.)
- KMZT-FM (105.1 FM; LOS ANGELES, CA; Owner: MOUNT WILSON FM BROADCASTERS, INC.)
- KTWV (94.7 FM; LOS ANGELES, CA; Owner: INFINITY BROADCASTING OPERATIONS, INC.)
- KPFK (90.7 FM; LOS ANGELES, CA; Owner: PACIFICA FOUNDATION, INC)
TV broadcast stations around Commerce:
- KCBS-TV (Channel 2; LOS ANGELES, CA; Owner: CBS BROADCASTING INC.)
- KTRO-LP (Channel 50; LANCASTER, CA; Owner: ROBERT D. ADELMAN)
- KTLA-TV (Channel 5; LOS ANGELES, CA; Owner: KTLA INC.)
- KABC-TV (Channel 7; LOS ANGELES, CA; Owner: ABC HOLDING COMPANY, INC.)
- KCAL-TV (Channel 9; LOS ANGELES, CA; Owner: VIACOM TELEVISION STATIONS GROUP OF LOS ANGELES LLC)
- KNBC (Channel 4; LOS ANGELES, CA; Owner: NBC SUBSIDIARY (KNBC-TV), INC.)
- KMEX-TV (Channel 34; LOS ANGELES, CA; Owner: KMEX LICENSE PARTNERSHIP, G.P.)
- KAZA-TV (Channel 54; AVALON, CA; Owner: PAPPAS SOUTHERN CALIFORNIA LICENSE LLC)
- KDOC-TV (Channel 56; ANAHEIM, CA; Owner: GOLDEN ORANGE BROADCASTING CO., INC.)
- KOCE-TV (Channel 50; HUNTINGTON BEACH, CA; Owner: BD. OF TRUSTEES, COAST COMMUNITY COLLEGE DIST.)
- KSCI (Channel 18; LONG BEACH, CA; Owner: KSLS, INC.)
- KHIZ (Channel 64; BARSTOW, CA; Owner: SUNBELT TELEVISION, INC.)
- KXLA (Channel 44; RANCHO PALOS VERDES, CA; Owner: RANCHO PALOS VERDES BROADCASTERS, INC.)
- KCET (Channel 28; LOS ANGELES, CA; Owner: COMMUNITY TELEVISION OF SOUTHERN CALIFORNIA)
- KFTR (Channel 46; ONTARIO, CA; Owner: TELEFUTURA LOS ANGELES LLC)
- KTTV (Channel 11; LOS ANGELES, CA; Owner: FOX TELEVISION STATIONS, INC.)
- KWHY-TV (Channel 22; LOS ANGELES, CA; Owner: TELEMUNDO OF LOS ANGELES LICENSE CORPORATION)
- KVEA (Channel 52; CORONA, CA; Owner: ESTRELLA LICENSE CORPORATION)
- KCOP-TV (Channel 13; LOS ANGELES, CA; Owner: FOX TELEVISION STATIONS, INC.)
- KTBN-TV (Channel 40; SANTA ANA, CA; Owner: TRINITY BROADCASTING NETWORK, INC.)
- KLCS (Channel 58; LOS ANGELES, CA; Owner: LOS ANGELES UNIFIED SCHOOL DISTRICT)
- KSFV-LP (Channel 26; SAN FERNANDO VALLEY, CA; Owner: VENTURE TECHNOLOGIES GROUP, LLC)
- National Bridge Inventory (NBI) Statistics
- 50Number of bridges
- 630ft / 192mTotal length
- 5,006,591Total average daily traffic
- 402,273Total average daily truck traffic
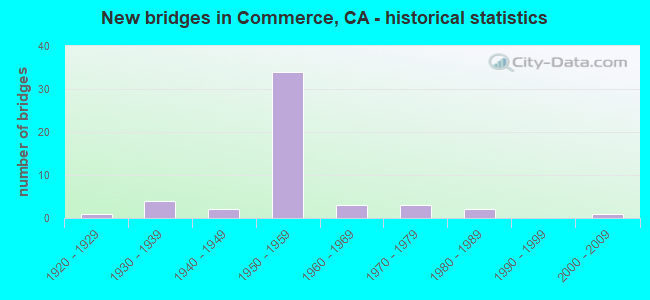
- New bridges - historical statistics
- 11920-1929
- 41930-1939
- 21940-1949
- 341950-1959
- 31960-1969
- 31970-1979
- 21980-1989
- 12000-2009
FCC Registered Antenna Towers:
2- Edward G Roach, 6080 Ferguson Dr. (Ca45691-A) (Lat: 34.008806 Lon: -118.141944), Type: 17.1, Structure height: 06037 m, Overall height: 15.3 m, Licensee ID: L, Registrant: Sba 2012 Tc Assets, LLC, Eroach@sbasite.Com, , Boca -Raton, Phone: (561) 995-7670
- Edward G Roach, 6080 Ferguson Dr. (Ca45691-A) (Lat: 34.008806 Lon: -118.141944), Type: 17.1, Structure height: 06037 m, Overall height: 15.3 m, Registrant: Sba 2012 Tc Assets, LLC, Eroach@sbasite.Com, , Boca -Raton, Phone: (561) 995-7670
FCC Registered Private Land Mobile Towers:
1 (See the full list of FCC Registered Private Land Mobile Towers in Commerce, CA)FCC Registered Broadcast Land Mobile Towers:
39 (See the full list of FCC Registered Broadcast Land Mobile Towers)FCC Registered Microwave Towers:
72 (See the full list of FCC Registered Microwave Towers in this town)FCC Registered Paging Towers:
2 (See the full list of FCC Registered Paging Towers)FCC Registered Amateur Radio Licenses:
18 (See the full list of FCC Registered Amateur Radio Licenses in Commerce)FAA Registered Aircraft:
4- Aircraft: BELLANCA 7KCAB (Category: Land, Seats: 2, Weight: Up to 12,499 Pounds, Speed: 90 mph), Engine: LYCOMING IO-320 SERIES (150 HP) (Reciprocating)
N-Number: 11659, N11659, N-11659, Serial Number: 304-72, Year manufactured: 1972, Airworthiness Date: 04/05/1972, Certificate Issue Date: 06/18/2011
Registrant (LLC): Villa Holdings LLC, 2600 S Eastern Ave, Commerce, CA 90040 - Aircraft: RAYTHEON AIRCRAFT COMPANY A36 (Category: Land, Seats: 6, Weight: Up to 12,499 Pounds), Engine: CONT MOTOR IO-550 SERIES (300 HP) (Reciprocating)
N-Number: 807DJ, N807DJ, N-807DJ, Serial Number: E-3371, Year manufactured: 2001, Airworthiness Date: 02/06/2001, Certificate Issue Date: 06/16/2008
Registrant (Corporation): Great West Produce Co Inc, 2600 S Eastern Ave, Commerce, CA 90040 - Aircraft: EUROCOPTER AS 350 B2 (Category: Land, Seats: 6, Weight: Up to 12,499 Pounds), Engine: TURBOMECA ARRIEL 1D1 (712 HP) (Turbo-shaft)
N-Number: 80NT, N80NT, N-80NT, Serial Number: 4352, Year manufactured: 2007, Airworthiness Date: 03/13/2008, Certificate Issue Date: 11/27/2018
Registrant (Government): Los Angeles Interagency Metropolitan Police, 5700 S Eastern Ave, Commerce, CA 90040 - Aircraft: AEROSPATIALE AS350B (Category: Land, Seats: 6, Weight: Up to 12,499 Pounds), Engine: LYCOMING LTS 101 600A (592 HP) (Turbo-shaft)
N-Number: 909KP, N909KP, N-909KP, Serial Number: 1472, Year manufactured: 1982, Airworthiness Date: 12/01/1982, Certificate Issue Date: 08/04/2017
Registrant (LLC): Hcrcm LLC, 4500 Dunham St, Commerce, CA 90040
Deregistered: Cancel Date: 12/05/2020
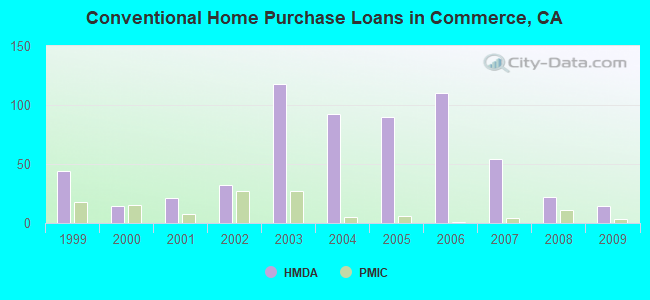
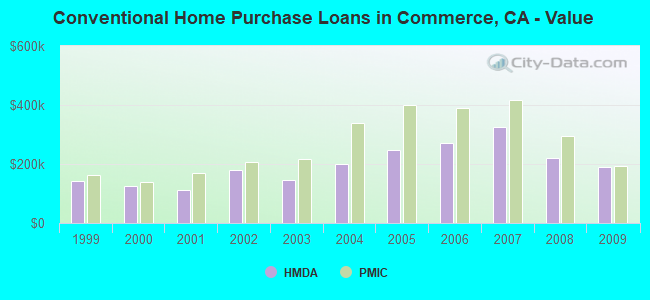
| Home Mortgage Disclosure Act Aggregated Statistics For Year 2009 (Based on 2 full and 1 partial tracts) | ||||||||||
| A) FHA, FSA/RHS & VA Home Purchase Loans | B) Conventional Home Purchase Loans | C) Refinancings | D) Home Improvement Loans | F) Non-occupant Loans on < 5 Family Dwellings (A B C & D) | ||||||
|---|---|---|---|---|---|---|---|---|---|---|
| Number | Average Value | Number | Average Value | Number | Average Value | Number | Average Value | Number | Average Value | |
| LOANS ORIGINATED | 18 | $231,282 | 14 | $189,026 | 51 | $199,991 | 3 | $145,643 | 4 | $151,580 |
| APPLICATIONS APPROVED, NOT ACCEPTED | 2 | $235,500 | 3 | $186,173 | 12 | $231,847 | 0 | $0 | 2 | $115,000 |
| APPLICATIONS DENIED | 4 | $312,055 | 11 | $179,769 | 50 | $241,447 | 9 | $35,379 | 5 | $292,694 |
| APPLICATIONS WITHDRAWN | 6 | $253,212 | 2 | $239,360 | 21 | $198,459 | 4 | $171,325 | 4 | $194,930 |
| FILES CLOSED FOR INCOMPLETENESS | 0 | $0 | 1 | $196,240 | 5 | $191,560 | 0 | $0 | 0 | $0 |
Detailed HMDA statistics for the following Tracts: 5323.02 , 5323.03, 5323.04
| Private Mortgage Insurance Companies Aggregated Statistics For Year 2009 (Based on 2 full and 1 partial tracts) | ||||
| A) Conventional Home Purchase Loans | B) Refinancings | |||
|---|---|---|---|---|
| Number | Average Value | Number | Average Value | |
| LOANS ORIGINATED | 3 | $194,203 | 1 | $234,000 |
| APPLICATIONS APPROVED, NOT ACCEPTED | 4 | $208,750 | 3 | $363,333 |
| APPLICATIONS DENIED | 0 | $0 | 0 | $0 |
| APPLICATIONS WITHDRAWN | 0 | $0 | 0 | $0 |
| FILES CLOSED FOR INCOMPLETENESS | 0 | $0 | 0 | $0 |
Detailed PMIC statistics for the following Tracts: 5323.02 , 5323.03, 5323.04
2005 - 2018 National Fire Incident Reporting System (NFIRS) incidents
- Fire incident types reported to NFIRS in Commerce, CA
- 30840.5%Mobile Property/Vehicle Fires
- 28437.3%Outside Fires
- 11815.5%Structure Fires
- 516.7%Other
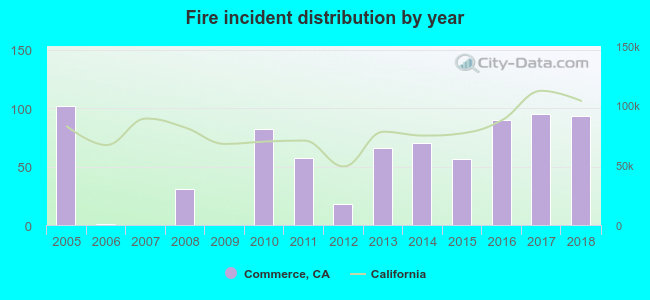 Based on the data from the years 2005 - 2018 the average number of fire incidents per year is 54. The highest number of reported fires - 102 took place in 2005, and the least - 0 in 2007. The data has a dropping trend.
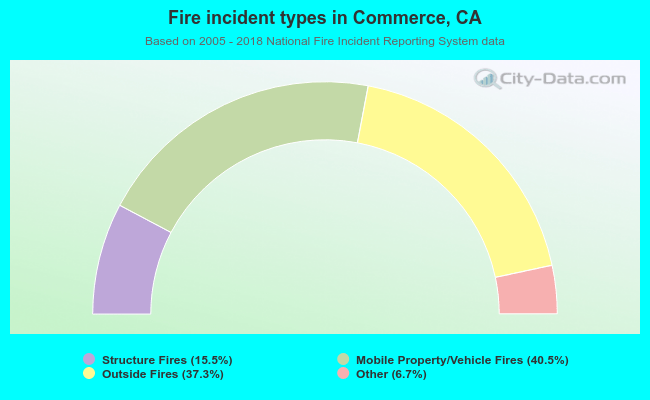 When looking into fire subcategories, the most reports belonged to: Mobile Property/Vehicle Fires (40.5%), and Outside Fires (37.3%).
Fire-safe hotels and motels in Commerce, California:
- Best Western Plus - Commerce Hotel, 7272 E Gage Ave, Commerce, California 90040 , Phone: (562) 806-4777
- Americas Best Value Inn & Suits, 7701 E Slauson Ave, Commerce, California 90040 , Phone: (323) 728-5165, Fax: (323) 721-1039
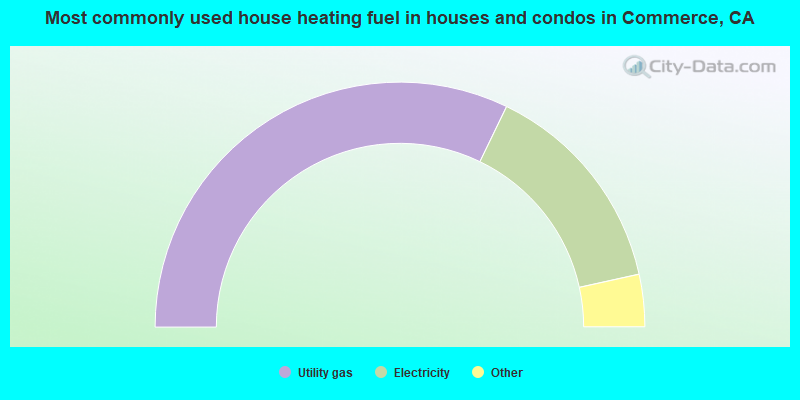
- 64.4%Utility gas
- 28.8%Electricity
- 3.7%Bottled, tank, or LP gas
- 3.1%No fuel used
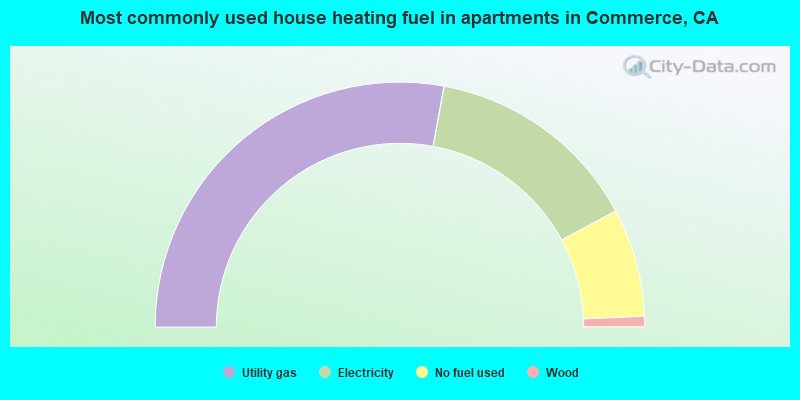
- 55.8%Utility gas
- 28.5%Electricity
- 14.3%No fuel used
- 1.4%Wood
Commerce compared to California state average:
- Black race population percentage significantly below state average.
- Hispanic race population percentage above state average.
- Length of stay since moving in significantly above state average.
- Percentage of population with a bachelor's degree or higher below state average.
Commerce on our top lists:
- #2 on the list of "Top 101 cities that people commute into (largest positive percentage daily daytime population change due to commuting) (population 5,000+)"
- #3 on the list of "Top 101 cities with the most local government spending on current operations of parks and recreation per resident (population 10,000+)"
- #3 on the list of "Top 101 cities with the most local government spending on current operations of libraries per resident (population 10,000+)"
- #5 on the list of "Top 101 cities with the highest number of auto thefts per 100,000 residents, excludes tourist destinations and others with a lot of outsiders visiting based on city industries data (population 5,000+)"
- #69 on the list of "Top 101 cities with the largest percentage of people in training schools for juvenile delinquents (population 1,000+)"
- #91 on the list of "Top 101 cities with the most cars per house, population 5,000+"
- #93 on the list of "Top 100 least-educated cities (pop. 5,000+)"
- #98 on the list of "Top 101 cities with the highest number of robberies per 100,000 residents, excludes tourist destinations and others with a lot of outsiders visiting based on city industries data (population 5,000+)"
- #56 (90023) on the list of "Top 101 zip codes with the largest percentage of taxpayers using paid preparers for 2012 taxes (pop 5,000+)"
- #60 (90023) on the list of "Top 101 zip codes with the largest percentage of United States first ancestries (pop 5,000+)"
- #75 (90640) on the list of "Top 101 zip codes with the largest percentage of Arab first ancestries (pop 5,000+)"
- #1 on the list of "Top 101 counties with the most Evangelical Protestant congregations"
- #1 on the list of "Top 101 counties with the most Mainline Protestant congregations"
- #1 on the list of "Top 101 counties with the most Orthodox adherents"
- #1 on the list of "Top 101 counties with the highest ground withdrawal of fresh water for public supply (pop. 50,000+)"
- #1 on the list of "Top 101 counties with the most Catholic adherents (pop. 50,000+)"

|
|
Total of 31 patent applications in 2008-2024.