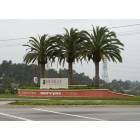
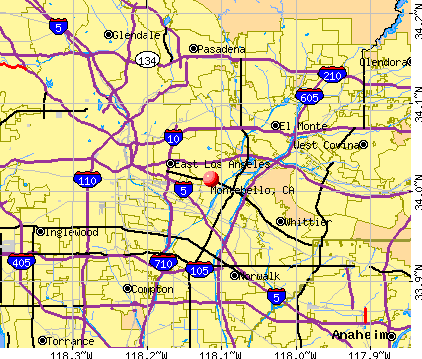
Montebello, California
Montebello: Montebello Sunset
Montebello: Whittier Blvd - Downtown Montebello
Montebello: Whittier Blvd looking west. - Downtown Montebello
Montebello: Holy Cross Church at Dusk
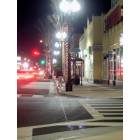
Montebello: Whittier Blvd looking east - Downtown Montebello
Montebello: Love on Whittier Blvd.
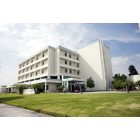
Montebello: Beverly Hospital
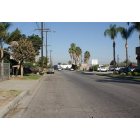
Montebello: Looking west on Date St. South Montebello (Simons)
Montebello: Montebello Town Center
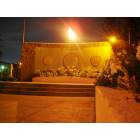
Montebello: War Memorial at Montebello City Park on Whittier Blvd.
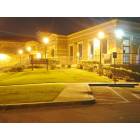
Montebello: Montebello's Senior Citizens Center located at Montebello City Park
- see
14
more - add
your
Submit your own pictures of this city and show them to the world
- OSM Map
- General Map
- Google Map
- MSN Map
Population change since 2000: -2.5%
 |
| Males: 29,490 | |
| Females: 31,079 |
| Median resident age: | 38.8 years |
| California median age: | 37.9 years |
Zip codes: 90640.
| Montebello: | $71,541 |
| CA: | $91,551 |
Estimated per capita income in 2022: $31,564 (it was $15,125 in 2000)
Montebello city income, earnings, and wages data
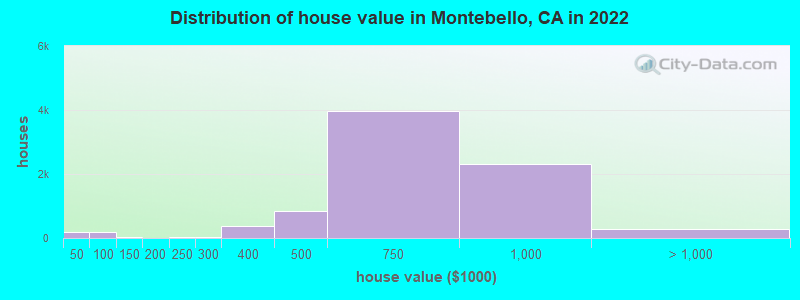
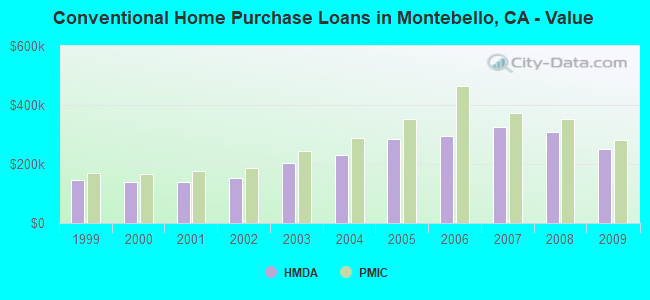
Estimated median house or condo value in 2022: $691,394 (it was $195,100 in 2000)
| Montebello: | $691,394 |
| CA: | $715,900 |
Mean prices in 2022: all housing units: $675,250; detached houses: $725,059; townhouses or other attached units: $520,601; in 2-unit structures: $598,950; in 3-to-4-unit structures: $501,529; in 5-or-more-unit structures: $423,847; mobile homes: $181,790
Median gross rent in 2022: $1,701.
(12.2% for White Non-Hispanic residents, 62.6% for Black residents, 12.9% for Hispanic or Latino residents, 16.8% for American Indian residents, 2.3% for Native Hawaiian and other Pacific Islander residents, 14.1% for other race residents, 9.6% for two or more races residents)
Detailed information about poverty and poor residents in Montebello, CA


Compare current foreclosures in Montebello, CA:
| Photo | Address | Area | Beds / Baths | Price | Details |
|---|---|---|---|---|---|

|
#1
Date St
Montebello, CA 90640
|
1,440 sq. feet
|
2 baths 3 beds |
show details | |

|
#2
S 4th St
Montebello, CA 90640
|
1,728 sq. feet
|
2 baths 4 beds |
show details | |

|
#3
N Montebello Blvd
Montebello, CA 90640
|
1,509 sq. feet
|
2 baths 2 beds |
show details | |

|
#4
N 20th St
Montebello, CA 90640
|
1,488 sq. feet
|
2 baths 4 beds |
show details | |

|
#5
Adelita St
Montebello, CA 90640
|
2,435 sq. feet
|
3 baths 4 beds |
show details | |

|
#6
W Burke Dr
Montebello, CA 90640
|
3,845 sq. feet
|
6 baths 5 beds |
show details | |

|
#7
E Victoria Ave
Montebello, CA 90640
|
1,025 sq. feet
|
1 baths 2 beds |
show details | |

|
#8
N Vera Cruz St
Montebello, CA 90640
|
1,701 sq. feet
|
2 baths 3 beds |
show details | |

|
#9
Carmelita Pl
Montebello, CA 90640
|
1,314 sq. feet
|
2 baths 3 beds |
show details | |

|
#10
N 4th St
Montebello, CA 90640
|
1,514 sq. feet
|
3 baths 5 beds |
show details |
| Photo | Address | Area | Beds / Baths | Price | Details |
|---|---|---|---|---|---|

|
#11
S Greenwood Ave
Montebello, CA 90640
|
1,362 sq. feet
|
2 baths 2 beds |
show details | |

|
#12
Bradley Ave
Montebello, CA 90640
|
3,044 sq. feet
|
4 baths 7 beds |
show details | |

|
#13
Casa Grande Ave
Montebello, CA 90640
|
2,591 sq. feet
|
3 baths 4 beds |
show details | |

|
#14
N Maple Pl
Montebello, CA 90640
|
1,437 sq. feet
|
2 baths 3 beds |
show details | |

|
#15
W Via Corona
Montebello, CA 90640
|
1,672 sq. feet
|
2 baths 3 beds |
show details | |

|
#16
N 18th St
Montebello, CA 90640
|
1,620 sq. feet
|
2 baths 4 beds |
show details | |

|
#17
N Maple Pl
Montebello, CA 90640
|
1,437 sq. feet
|
2 baths 3 beds |
show details | |

|
#18
S 4th St
Montebello, CA 90640
|
846 sq. feet
|
2 baths 4 beds |
show details | |

|
#19
Jacmar Dr
Montebello, CA 90640
|
1,982 sq. feet
|
3 baths 3 beds |
show details | |

|
#20
S 3rd St
Montebello, CA 90640
|
1,216 sq. feet
|
3 baths 3 beds |
show details |
| Photo | Address | Area | Beds / Baths | Price | Details |
|---|---|---|---|---|---|

|
#21
Southside Dr
Montebello, CA 90640
|
1,170 sq. feet
|
1 baths 2 beds |
show details | |

|
#22
Adelita St
Montebello, CA 90640
|
2,435 sq. feet
|
3 baths 4 beds |
show details | |

|
#23
Bradshawe St
Montebello, CA 90640
|
1,292 sq. feet
|
2 baths 3 beds |
show details | |

|
#24
Frankel Ave # 4
Montebello, CA 90640
|
882 sq. feet
|
2 baths 2 beds |
show details | |

|
#25
E Azalea Dr
Montebello, CA 90640
|
1,426 sq. feet
|
2 baths 3 beds |
show details | |

|
#26
N Via Val Verde
Montebello, CA 90640
|
772 sq. feet
|
1 baths 2 beds |
show details | |

|
#27
Baldwin Pl
Montebello, CA 90640
|
1,668 sq. feet
|
2 baths 3 beds |
show details | |

|
#28
W Burke Dr
Montebello, CA 90640
|
3,845 sq. feet
|
6 baths 5 beds |
show details | |

|
#29
Via Vis
Montebello, CA 90640
|
2,452 sq. feet
|
3 baths 6 beds |
show details | |

|
#30
N Park Ave
Montebello, CA 90640
|
1,104 sq. feet
|
1 baths 2 beds |
show details |
| Photo | Address | Area | Beds / Baths | Price | Details |
|---|---|---|---|---|---|

|
#31
S Spruce St
Montebello, CA 90640
|
840 sq. feet
|
3 baths 6 beds |
show details | |

|
#32
Via Vis
Montebello, CA 90640
|
1,217 sq. feet
|
1 baths 2 beds |
show details | |

|
#33
Holger Dr
Montebello, CA 90640
|
1,538 sq. feet
|
2 baths 4 beds |
show details | |

|
#34
W Gary Ave
Montebello, CA 90640
|
1,348 sq. feet
|
2 baths 2 beds |
show details | |

|
#35
N Raywood Ave
Montebello, CA 90640
|
1,623 sq. feet
|
2 baths 3 beds |
show details | |

|
#36
E Avenida De La Merced
Montebello, CA 90640
|
1,620 sq. feet
|
2 baths 4 beds |
show details | |

|
#37
1/4 California Ave
Montebello, CA 90640
|
- sq. feet
|
6 baths 10 beds |
show details | |

|
#38
Ridge Terrace Ln
Montebello, CA 90640
|
- sq. feet
|
- baths - beds |
show details | |

|
#39
N 18th St
Montebello, CA 90640
|
- sq. feet
|
- baths - beds |
show details | |

|
#40
N 18th St
Montebello, CA 90640
|
- sq. feet
|
- baths - beds |
show details |
| Photo | Address | Area | Beds / Baths | Price | Details |
|---|---|---|---|---|---|

|
#41
Acacia Ln
Montebello, CA 90640
|
- sq. feet
|
- baths - beds |
show details | |

|
#42
Frankel Ave Apt D4
Montebello, CA 90640
|
- sq. feet
|
- baths - beds |
show details | |

|
#43
Beach St
Montebello, CA 90640
|
- sq. feet
|
- baths - beds |
show details | |

|
#44
Via Paseo Apt A
Montebello, CA 90640
|
- sq. feet
|
- baths - beds |
show details | |

|
#45
Via Paseo Apt B
Montebello, CA 90640
|
- sq. feet
|
- baths - beds |
show details | |

|
#46
Via San Delarro
Montebello, CA 90640
|
- sq. feet
|
- baths - beds |
show details | |

|
#47
N 2nd St
Montebello, CA 90640
|
- sq. feet
|
- baths - beds |
show details | |

|
#48
N Via Val Verde # 503
Montebello, CA 90640
|
- sq. feet
|
- baths - beds |
show details | |

|
#49
W Cleveland Ave Apt A
Montebello, CA 90640
|
- sq. feet
|
- baths - beds |
show details | |

|
Check over 1 million property listings on Foreclosure.com!
|
browse all offers | |||


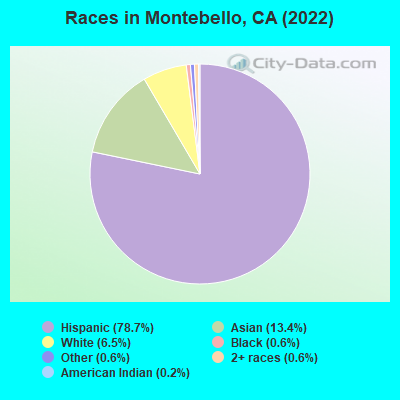
- 47,78278.7%Hispanic
- 8,13013.4%Asian alone
- 3,9686.5%White alone
- 3920.6%Black alone
- 3510.6%Other race alone
- 3470.6%Two or more races
- 1210.2%American Indian alone
According to our research of California and other state lists, there were 64 registered sex offenders living in Montebello, California as of April 27, 2024.
The ratio of all residents to sex offenders in Montebello is 999 to 1.
The ratio of registered sex offenders to all residents in this city is lower than the state average.
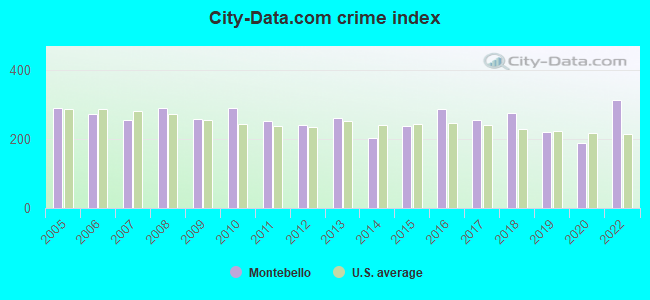
The City-Data.com crime index weighs serious crimes and violent crimes more heavily. Higher means more crime, U.S. average is 246.1. It adjusts for the number of visitors and daily workers commuting into cities.
- means the value is smaller than the state average.- means the value is about the same as the state average.
- means the value is bigger than the state average.
- means the value is much bigger than the state average.
Crime rate in Montebello detailed stats: murders, rapes, robberies, assaults, burglaries, thefts, arson
Full-time law enforcement employees in 2021, including police officers: 94 (71 officers - 64 male; 7 female).
| Officers per 1,000 residents here: | 1.16 |
| California average: | 2.30 |
 Recent articles from our blog. Our writers, many of them Ph.D. graduates or candidates, create easy-to-read articles on a wide variety of topics.


Latest news from Montebello, CA collected exclusively by city-data.com from local newspapers, TV, and radio stations
Ancestries: Armenian (3.0%), American (1.0%).
Current Local Time: PST time zone
Elevation: 200 feet
Land area: 8.25 square miles.
Population density: 7,345 people per square mile (high).
21,967 residents are foreign born (25.4% Latin America, 10.4% Asia).
| This city: | 36.2% |
| California: | 26.5% |
Median real estate property taxes paid for housing units with mortgages in 2022: $5,465 (0.8%)
Median real estate property taxes paid for housing units with no mortgage in 2022: $3,533 (0.5%)
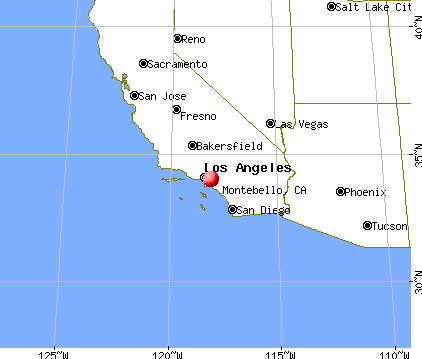
Nearest city with pop. 200,000+: Southwest San Gabriel Valley, CA (3.4 miles  , pop. 320,008).
Nearest city with pop. 1,000,000+: Los Angeles, CA (15.8 miles , pop. 3,694,820).
Nearest cities:
), ), ), Latitude: 34.01 N, Longitude: 118.11 W
Daytime population change due to commuting: -5,969 (-9.8%)
Workers who live and work in this city: 5,568 (19.1%)
Area code: 323
Property values in Montebello, CA

Montebello, California accommodation & food services, waste management - Economy and Business Data
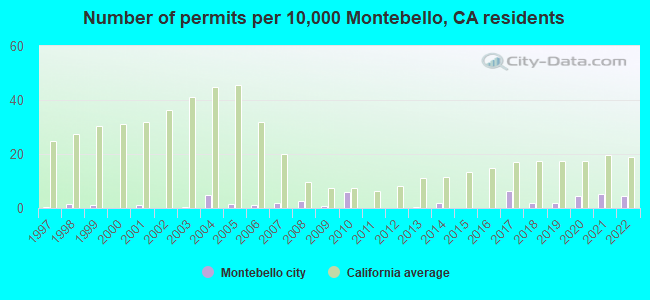
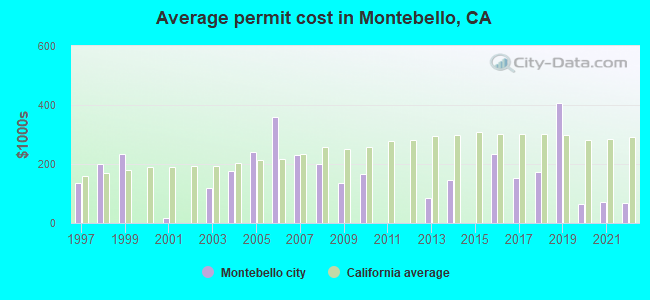
Single-family new house construction building permits:
- 2022: 27 buildings, average cost: $68,400
- 2021: 32 buildings, average cost: $69,500
- 2020: 27 buildings, average cost: $65,700
- 2019: 11 buildings, average cost: $406,700
- 2018: 11 buildings, average cost: $173,800
- 2017: 39 buildings, average cost: $152,400
- 2016: 1 building, cost: $235,100
- 2014: 11 buildings, average cost: $147,100
- 2013: 2 buildings, average cost: $86,200
- 2010: 36 buildings, average cost: $164,700
- 2009: 4 buildings, average cost: $134,200
- 2008: 16 buildings, average cost: $198,700
- 2007: 11 buildings, average cost: $229,200
- 2006: 6 buildings, average cost: $359,500
- 2005: 10 buildings, average cost: $241,700
- 2004: 31 buildings, average cost: $174,500
- 2003: 3 buildings, average cost: $116,900
- 2001: 7 buildings, average cost: $17,300
- 1999: 7 buildings, average cost: $233,400
- 1998: 10 buildings, average cost: $199,800
- 1997: 2 buildings, average cost: $134,700
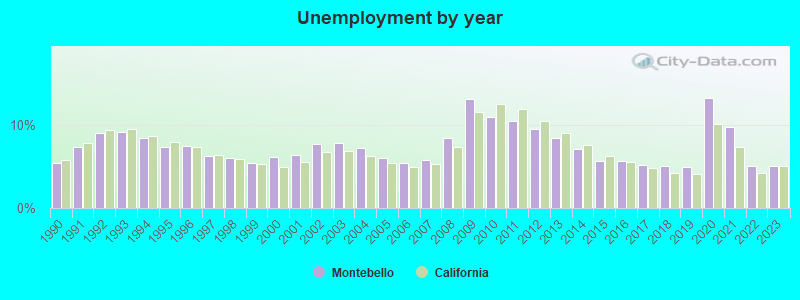
| Here: | 5.0% |
| California: | 5.1% |
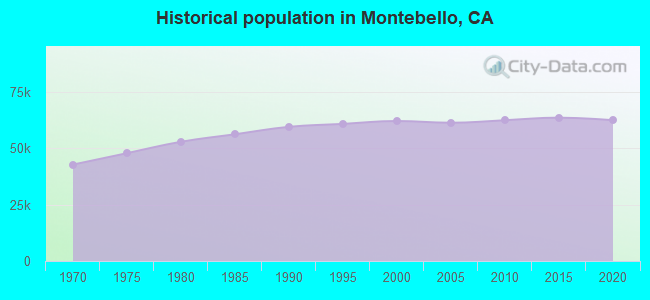
Population change in the 1990s: +2,503 (+4.2%).
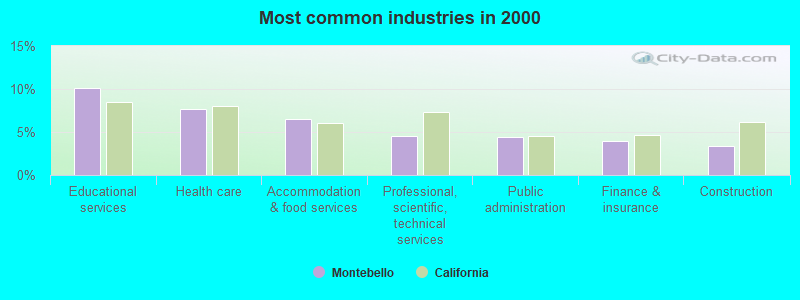
- Educational services (10.1%)
- Health care (7.7%)
- Accommodation & food services (6.5%)
- Professional, scientific, technical services (4.5%)
- Public administration (4.4%)
- Finance & insurance (3.9%)
- Construction (3.4%)
- Accommodation & food services (6.3%)
- Educational services (5.9%)
- Construction (5.8%)
- Administrative & support & waste management services (4.3%)
- Professional, scientific, technical services (4.2%)
- Public administration (4.1%)
- Health care (4.0%)
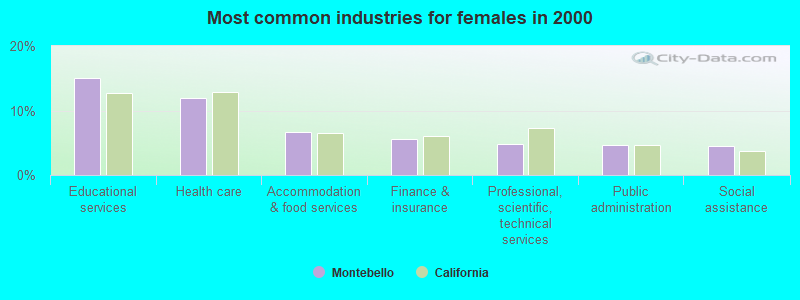
- Educational services (15.0%)
- Health care (12.0%)
- Accommodation & food services (6.7%)
- Finance & insurance (5.5%)
- Professional, scientific, technical services (4.9%)
- Public administration (4.7%)
- Social assistance (4.5%)
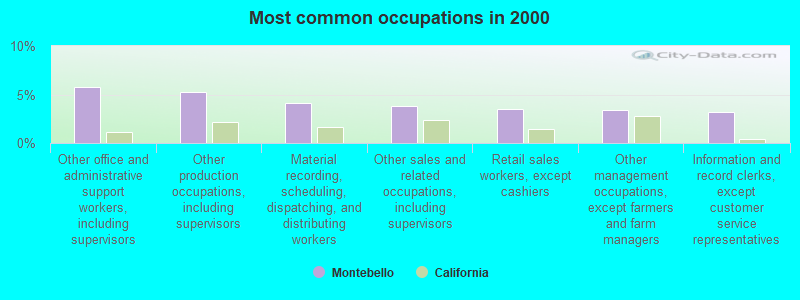
- Other office and administrative support workers, including supervisors (5.8%)
- Other production occupations, including supervisors (5.2%)
- Material recording, scheduling, dispatching, and distributing workers (4.1%)
- Other sales and related occupations, including supervisors (3.8%)
- Retail sales workers, except cashiers (3.5%)
- Other management occupations, except farmers and farm managers (3.4%)
- Information and record clerks, except customer service representatives (3.2%)
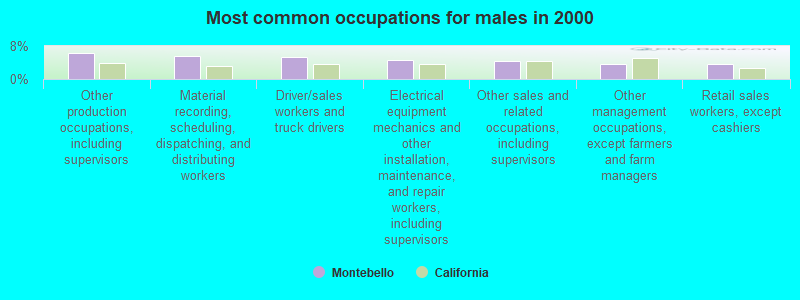
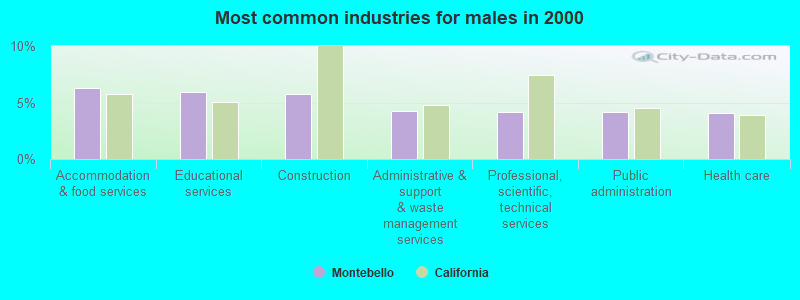
- Other production occupations, including supervisors (6.2%)
- Material recording, scheduling, dispatching, and distributing workers (5.5%)
- Driver/sales workers and truck drivers (5.4%)
- Electrical equipment mechanics and other installation, maintenance, and repair workers, including supervisors (4.7%)
- Other sales and related occupations, including supervisors (4.4%)
- Other management occupations, except farmers and farm managers (3.7%)
- Retail sales workers, except cashiers (3.7%)
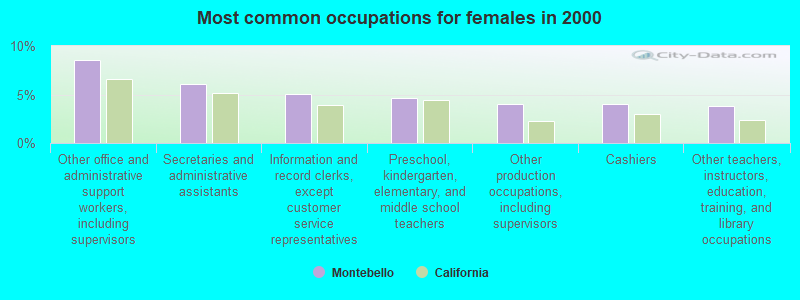
- Other office and administrative support workers, including supervisors (8.6%)
- Secretaries and administrative assistants (6.1%)
- Information and record clerks, except customer service representatives (5.1%)
- Preschool, kindergarten, elementary, and middle school teachers (4.6%)
- Other production occupations, including supervisors (4.0%)
- Cashiers (4.0%)
- Other teachers, instructors, education, training, and library occupations (3.8%)
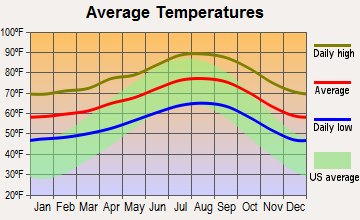
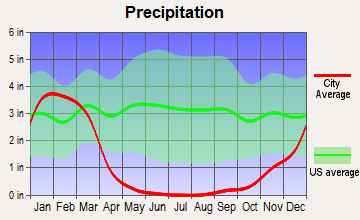
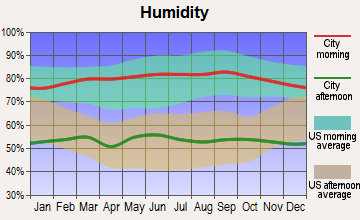
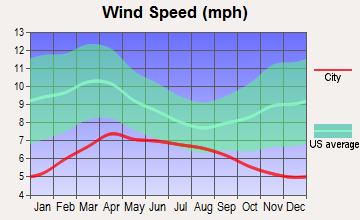
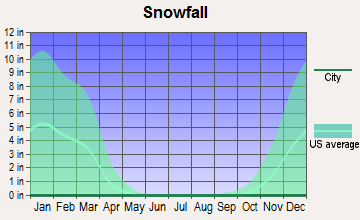
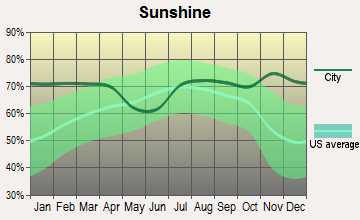
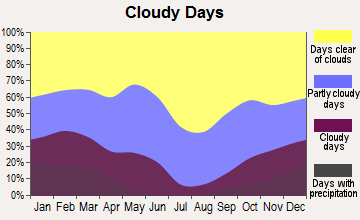
Average climate in Montebello, California
Based on data reported by over 4,000 weather stations
|
|

(lower is better)
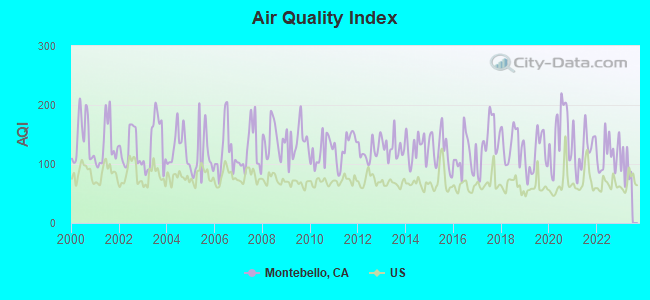
Air Quality Index (AQI) level in 2022 was 117. This is significantly worse than average.
| City: | 117 |
| U.S.: | 73 |
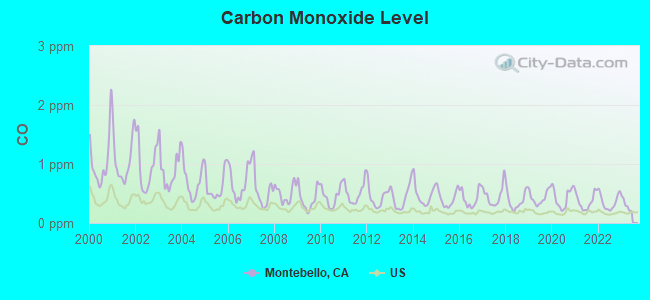
Carbon Monoxide (CO) [ppm] level in 2022 was 0.358. This is significantly worse than average. Closest monitor was 2.7 miles away from the city center.
| City: | 0.358 |
| U.S.: | 0.251 |
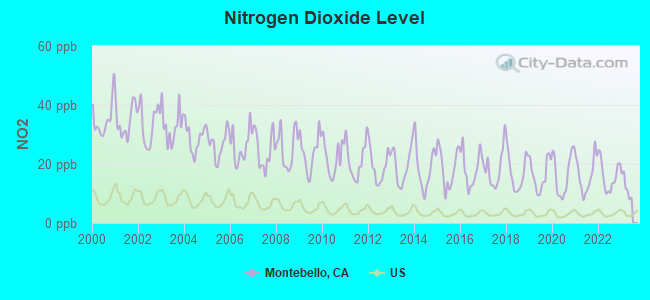
Nitrogen Dioxide (NO2) [ppb] level in 2022 was 16.0. This is significantly worse than average. Closest monitor was 2.7 miles away from the city center.
| City: | 16.0 |
| U.S.: | 5.1 |
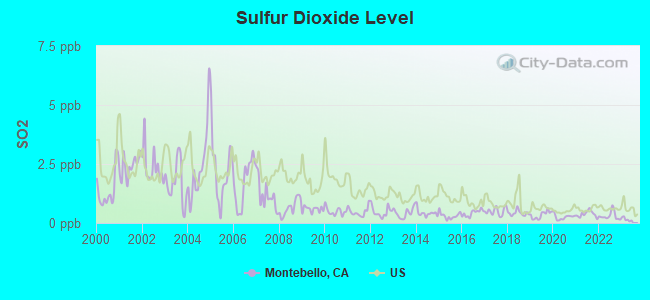
Sulfur Dioxide (SO2) [ppb] level in 2022 was 0.302. This is significantly better than average. Closest monitor was 6.0 miles away from the city center.
| City: | 0.302 |
| U.S.: | 1.515 |
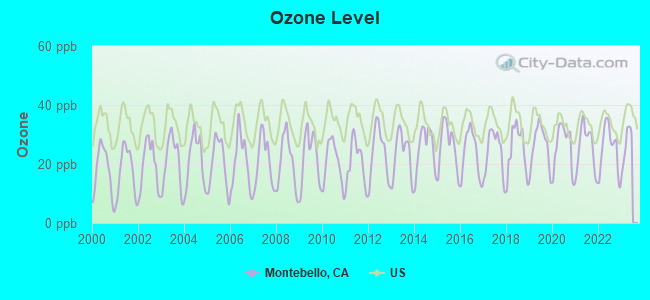
Ozone [ppb] level in 2022 was 25.2. This is better than average. Closest monitor was 2.7 miles away from the city center.
| City: | 25.2 |
| U.S.: | 33.3 |
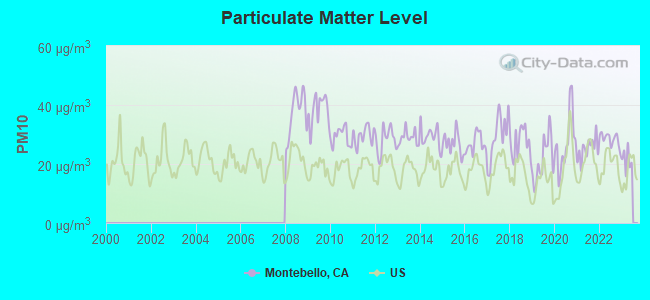
Particulate Matter (PM10) [µg/m3] level in 2022 was 28.3. This is significantly worse than average. Closest monitor was 7.4 miles away from the city center.
| City: | 28.3 |
| U.S.: | 19.2 |
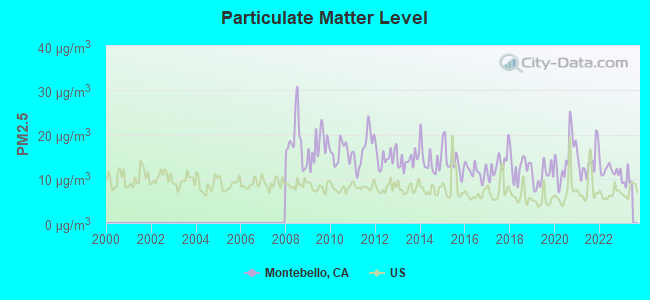
Particulate Matter (PM2.5) [µg/m3] level in 2022 was 12.0. This is significantly worse than average. Closest monitor was 2.7 miles away from the city center.
| City: | 12.0 |
| U.S.: | 8.1 |
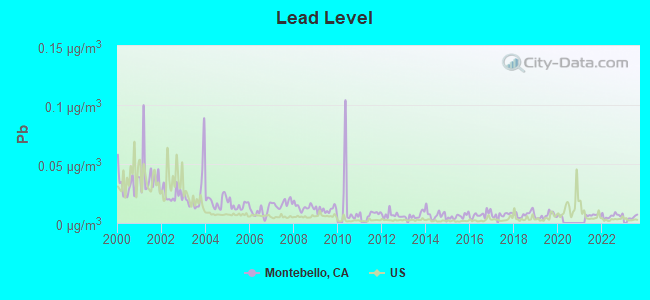
Lead (Pb) [µg/m3] level in 2022 was 0.00606. This is significantly better than average. Closest monitor was 3.6 miles away from the city center.
| City: | 0.00606 |
| U.S.: | 0.00931 |
Earthquake activity:
Montebello-area historical earthquake activity is significantly above California state average. It is 7032% greater than the overall U.S. average.On 7/21/1952 at 11:52:14, a magnitude 7.7 (7.7 UK, Class: Major, Intensity: VIII - XII) earthquake occurred 84.8 miles away from the city center, causing $50,000,000 total damage
On 6/28/1992 at 11:57:34, a magnitude 7.6 (6.2 MB, 7.6 MS, 7.3 MW, Depth: 0.7 mi) earthquake occurred 91.4 miles away from Montebello center, causing 3 deaths (1 shaking deaths, 2 other deaths) and 400 injuries, causing $100,000,000 total damage and $40,000,000 insured losses
On 10/16/1999 at 09:46:44, a magnitude 7.4 (6.3 MB, 7.4 MS, 7.2 MW, 7.3 ML) earthquake occurred 102.1 miles away from the city center
On 11/4/1927 at 13:51:53, a magnitude 7.5 (7.5 UK) earthquake occurred 177.6 miles away from the city center
On 1/17/1994 at 12:30:55, a magnitude 6.8 (6.4 MB, 6.8 MS, 6.7 MW, Depth: 11.4 mi, Class: Strong, Intensity: VII - IX) earthquake occurred 28.1 miles away from the city center, causing 60 deaths (60 shaking deaths) and 7000 injuries
On 4/21/1918 at 22:32:30, a magnitude 6.8 (6.8 UK) earthquake occurred 41.2 miles away from Montebello center
Magnitude types: body-wave magnitude (MB), local magnitude (ML), surface-wave magnitude (MS), moment magnitude (MW)
Natural disasters:
The number of natural disasters in Los Angeles County (57) is a lot greater than the US average (15).Major Disasters (Presidential) Declared: 27
Emergencies Declared: 3
Causes of natural disasters: Fires: 37, Floods: 16, Storms: 9, Winter Storms: 6, Landslides: 5, Mudslides: 5, Earthquakes: 3, Freeze: 1, Heavy Rain: 1, Hurricane: 1, Snow: 1, Tornado: 1, Wind: 1, Other: 1 (Note: some incidents may be assigned to more than one category).

Hospitals in Montebello:
Nursing Homes in Montebello:
- BEVERLY HOSPITAL D P SNF (309 W BEVERLY BLVD)
- MONTEBELLO CARE CENTER (1035 W BEVERLY BLVD)
- RIO HONDO SUBACUTE AND NURSING CENTER (273 E BEVERLY BOULEVARD)
Dialysis Facilities in Montebello:
- DOCTORS DIALYSIS CENTER OF MONTEBELLO (1721 W. WHITTIER BLVD.)
- MONTEBELLO ARTIFICIAL KIDNEY CENTER (3404 W. BEVERLY BLVD.)
- MONTEBELLO DIALYSIS CENTER, LLC (111 W. BEVERLY BLVD., SUITE A)
- PERITONEAL DIALYSIS CENTER OF AMERICA, INC. (3112 W. BEVERLY BLVD.)
Home Health Centers in Montebello:
Amtrak stations near Montebello:
- 8 miles: LOS ANGELES (800 N. ALAMEDA ST.) . Services: ticket office, fully wheelchair accessible, enclosed waiting area, public restrooms, public payphones, snack bar, free short-term parking, paid long-term parking, car rental agency, taxi stand, public transit connection.
- 10 miles: PASADENA (150 S. ROBLES AVE.) - Bus Station . Services: fully wheelchair accessible, enclosed waiting area, public restrooms, public payphones, full-service food facilities, paid short-term parking, paid long-term parking, taxi stand, public transit connection.
- 12 miles: GLENDALE (400 W. CERRITOS AVE.) . Services: fully wheelchair accessible, public payphones, free short-term parking, free long-term parking, call for taxi service, intercity bus service, public transit connection.
College/University in Montebello:
Colleges/universities with over 2000 students nearest to Montebello:
- East Los Angeles College (about 3 miles; Monterey Park, CA; Full-time enrollment: 17,297)
- Rio Hondo College (about 5 miles; Whittier, CA; FT enrollment: 9,610)
- California State University-Los Angeles (about 5 miles; Los Angeles, CA; FT enrollment: 17,545)
- Marinello Schools of Beauty-Los Angeles (about 7 miles; Los Angeles, CA; FT enrollment: 3,923)
- United Education Institute-Huntington Park Campus (about 7 miles; Huntington Park, CA; FT enrollment: 5,151)
- ICDC College (about 7 miles; Huntington Park, CA; FT enrollment: 2,621)
- Fashion Institute of Design & Merchandising-Los Angeles (about 9 miles; Los Angeles, CA; FT enrollment: 3,705)
Public high schools in Montebello:
- MONTEBELLO HIGH (Students: 2,376, Location: 2100 W. CLEVELAND AVE., Grades: 9-12)
- MONTEBELLO COMMUNITY DAY (Students: 85, Location: 123 S. MONTEBELLO BLVD., Grades: 7-12)
- VAIL HIGH (CONTINUATION) (Students: 39, Location: 1230 S. VAIL AVE., Grades: 9-12)
- SCHURR HIGH (Location: 820 N. WILCOX AVE., Grades: 9-12)
- APPLIED TECHNOLOGY CENTER (Location: 1200 W. MINES AVE., Grades: 9-12)
Private high schools in Montebello:
Public elementary/middle schools in Montebello:
- LA MERCED INTERMEDIATE (Students: 1,712, Location: 215 E. AVENIDA DE LA MERCED, Grades: 6-8)
- MONTEBELLO INTERMEDIATE (Students: 1,540, Location: 1600 WHITTIER BLVD., Grades: 6-8)
- EASTMONT INTERMEDIATE (Students: 1,494, Location: 400 N. BRADSHAWE AVE., Grades: 6-8)
- WASHINGTON ELEMENTARY (Students: 533, Location: 1400 W. MADISON AVE., Grades: KG-5)
- LA MERCED ELEMENTARY (Students: 470, Location: 724 N. POPLAR AVE., Grades: KG-5)
- GREENWOOD ELEMENTARY (Students: 434, Location: 900 S. GREENWOOD AVE., Grades: KG-5)
- WILCOX ELEMENTARY (Students: 367, Location: 816 DONNA WAY, Grades: KG-5)
- FREMONT ELEMENTARY (Location: 200 W. MADISON AVE., Grades: KG-5)
Private elementary/middle schools in Montebello:
- ST BENEDICT SCHOOL (Students: 578, Location: 217 N 10TH ST, Grades: PK-8)
- OUR LADY OF THE MIRACULOUS MEDAL (Students: 486, Location: 840 N GARFIELD AVE, Grades: PK-8)
- MONTEBELLO CHRISTIAN SCHOOL (Students: 129, Location: 136 S 7TH ST, Grades: KG-8)
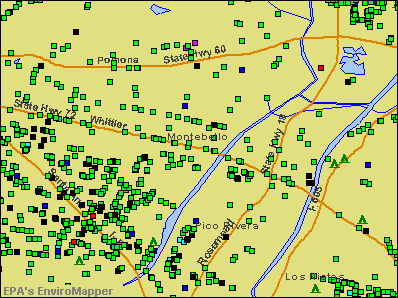
Points of interest:
Notable locations in Montebello: Kenosha Spur (A), Montebello Municipal Golf Course (B), Montebello Branch County of Los Angeles Public Library (C), Chet Holifield Branch County of Los Angeles Public Library (D), Montebello Womans Club (E), Montebello Police Building (F), Montebello City Hall (G), Lifeline Ambulance Service (H), Montebello Fire Department Station 3 (I), Montebello Fire Department Station 2 (J), Montebello Fire Department Station 1 Headquarters (K). Display/hide their locations on the map
Shopping Centers: Crawfords Shopping Center (1), Montebello Town Square Shopping Center (2), Montebello Town Center Shopping Center (3), Montebello Plaza Shopping Center (4), Montebello Mart Shopping Center (5). Display/hide their locations on the map
Churches in Montebello include: Beverly Boulevard Four Square Gospel Church (A), Church of Christ (B), Cross and Crown Lutheran Church (C), First Assembly of God Church of Montebello (D), First Baptist Church of Montebello (E), First Church of Christ Scientist (F), First Church of the Nazarene (G), First Friends Church (H), Iglesia Methodista Libre (I). Display/hide their locations on the map
Cemetery: Resurrection Cemetery (1). Display/hide its location on the map
Parks in Montebello include: Bicknell Park (1), Chet Holifield Park (2), Acuna Park (3), Grant Rea Park (4), Montebello Park (5), Potrero Heights Park (6), Reggie Rodriguez Park (7), Ashiya Park (8). Display/hide their locations on the map
Tourist attractions: Armenian Center Inc (Cultural Attractions- Events- & Facilities; 420 Washington Boulevard), Armenian Center Inc - Bingo Hall (Cultural Attractions- Events- & Facilities; 410 Washington Boulevard), Beverly Bowl (Amusement & Theme Parks; 1201 West Beverly Boulevard).
Hotels: Best Western Montebello Plaza (7709 Telegraph Road), Best Star Inn (7533 Telegraph Road), Best Inn Montebello (525 Washington Boulevard).
Birthplace of: Mirai Nagasu - Figure skater, Bob Ralston - Pianist, Charles Calderon - Politician, Darleen Ortega - Judge, Deborah Foreman - Film actor, Jay Hernandez - Actor, John Paul Fruttero - Tennis player, Judi Evans - Soap opera actor, Marge Villa - Girls Professional Baseball League player, Rochelle Ballard - Surfer.
| This city: | 3.3 people |
| California: | 2.9 people |
| This city: | 77.7% |
| Whole state: | 68.7% |
| This city: | 7.6% |
| Whole state: | 7.2% |
Likely homosexual households (counted as self-reported same-sex unmarried-partner households)
- Lesbian couples: 0.4% of all households
- Gay men: 0.3% of all households
People in group quarters in Montebello in 2010:
- 350 people in nursing facilities/skilled-nursing facilities
- 16 people in group homes intended for adults
- 12 people in other noninstitutional facilities
- 7 people in residential schools for people with disabilities
- 7 people in workers' group living quarters and job corps centers
- 4 people in residential treatment centers for adults
- 2 people in local jails and other municipal confinement facilities
- 2 people in group homes for juveniles (non-correctional)
People in group quarters in Montebello in 2000:
- 256 people in nursing homes
- 21 people in schools, hospitals, or wards for the intellectually disabled
- 13 people in religious group quarters
- 12 people in homes or halfway houses for drug/alcohol abuse
- 7 people in other noninstitutional group quarters
Banks with most branches in Montebello (2011 data):
- Bank of America, National Association: Monte Bello Branch at 700 Whittier Boulevard, branch established on 1912/07/20; Wilcox-Via Campo Branch at 866 North Wilcox Avenue, branch established on 1960/04/28. Info updated 2009/11/18: Bank assets: $1,451,969.3 mil, Deposits: $1,077,176.8 mil, headquarters in Charlotte, NC, positive income, 5782 total offices, Holding Company: Bank Of America Corporation
- Banco Popular North America: Montebello Branch at 2133 West Beverly Boulevard, branch established on 1989/06/12. Info updated 2012/01/27: Bank assets: $8,605.3 mil, Deposits: $6,167.7 mil, headquarters in New York, NY, positive income, Commercial Lending Specialization, 97 total offices, Holding Company: Popular, Inc.
- Professional Business Bank: Montebello Office at 2417 West Whittier Blvd, branch established on 1998/01/02. Info updated 2011/07/07: Bank assets: $239.5 mil, Deposits: $201.2 mil, headquarters in Pasadena, CA, positive income, Commercial Lending Specialization, 4 total offices, Holding Company: Scj, Inc.
- East West Bank: Montebello Branch at 2825 Via Campo, branch established on 1972/01/01. Info updated 2010/06/14: Bank assets: $21,962.4 mil, Deposits: $17,501.8 mil, headquarters in Pasadena, CA, positive income, Commercial Lending Specialization, 131 total offices, Holding Company: East West Bancorp, Inc.
- Citibank, National Association: Whittier Boulevard Branch at 2325 W Whittier Boulevard, branch established on 1999/12/22. Info updated 2012/01/10: Bank assets: $1,288,658.0 mil, Deposits: $882,541.0 mil, headquarters in Sioux Falls, SD, positive income, International Specialization, 1048 total offices, Holding Company: Citigroup Inc.
- Union Bank, National Association: Montebello Branch at 850 North Wilcox Avenue, branch established on 1972/12/15. Info updated 2011/09/01: Bank assets: $88,967.5 mil, Deposits: $65,286.4 mil, headquarters in San Francisco, CA, positive income, Commercial Lending Specialization, 403 total offices, Holding Company: Mitsubishi Ufj Financial Group, Inc.
- Wells Fargo Bank, National Association: Montebello Branch at 777 West Whittier Boulevard, branch established on 2005/05/16. Info updated 2011/04/05: Bank assets: $1,161,490.0 mil, Deposits: $905,653.0 mil, headquarters in Sioux Falls, SD, positive income, 6395 total offices, Holding Company: Wells Fargo & Company
- JPMorgan Chase Bank, National Association: Montebello Branch at 896 West Beverly Boulevard, branch established on 1889/01/01. Info updated 2011/11/10: Bank assets: $1,811,678.0 mil, Deposits: $1,190,738.0 mil, headquarters in Columbus, OH, positive income, International Specialization, 5577 total offices, Holding Company: Jpmorgan Chase & Co.
- U.S. Bank National Association: Montebello Branch at 1611 West Beverly Blvd, branch established on 1928/01/01. Info updated 2012/01/30: Bank assets: $330,470.8 mil, Deposits: $236,091.5 mil, headquarters in Cincinnati, OH, positive income, 3121 total offices, Holding Company: U.S. Bancorp
For population 15 years and over in Montebello:
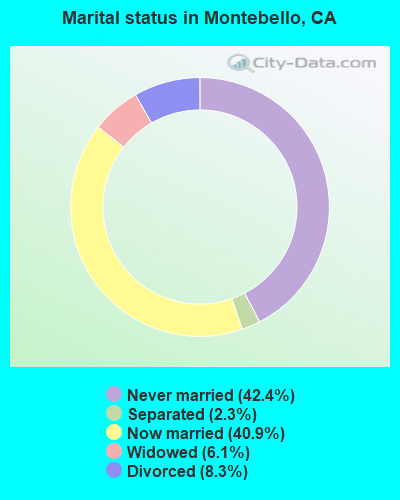
- Never married: 42.4%
- Now married: 40.9%
- Separated: 2.3%
- Widowed: 6.1%
- Divorced: 8.3%
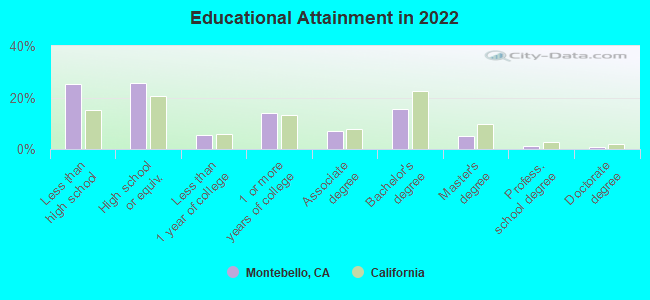
For population 25 years and over in Montebello:
- High school or higher: 74.1%
- Bachelor's degree or higher: 21.5%
- Graduate or professional degree: 6.5%
- Unemployed: 8.7%
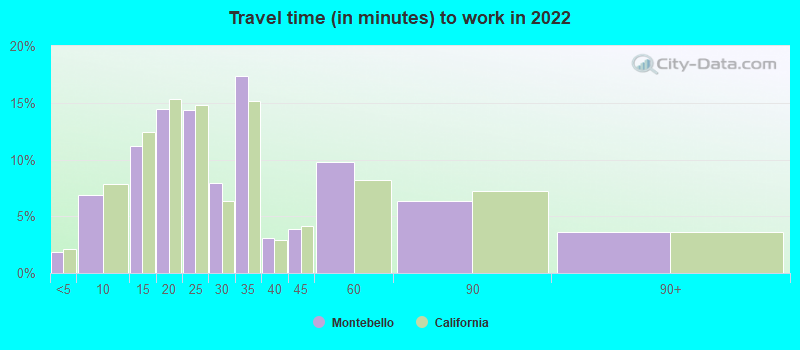
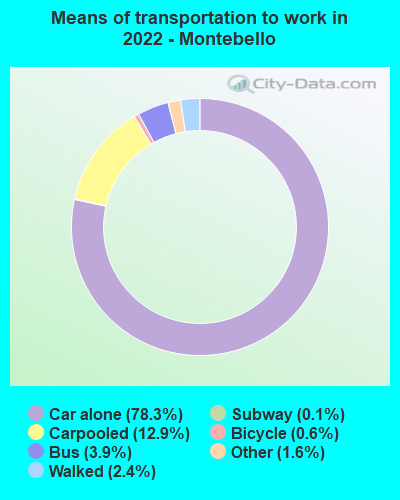
- Mean travel time to work (commute): 27.7 minutes
| Here: | 17.4 |
| California average: | 15.5 |


Graphs represent county-level data. Detailed 2008 Election Results
Religion statistics for Montebello, CA (based on Los Angeles County data)


| Religion | Adherents | Congregations |
|---|---|---|
| Catholic | 3,542,994 | 275 |
| Evangelical Protestant | 814,611 | 3,249 |
| Other | 451,594 | 1,023 |
| Mainline Protestant | 229,056 | 860 |
| Black Protestant | 112,338 | 290 |
| Orthodox | 63,517 | 76 |
| None | 4,604,495 | - |
Food Environment Statistics:
| Los Angeles County: | 2.12 / 10,000 pop. |
| State: | 2.14 / 10,000 pop. |
| Los Angeles County: | 0.03 / 10,000 pop. |
| California: | 0.04 / 10,000 pop. |
| Los Angeles County: | 0.58 / 10,000 pop. |
| California: | 0.62 / 10,000 pop. |
| Los Angeles County: | 1.23 / 10,000 pop. |
| California: | 1.49 / 10,000 pop. |
| Los Angeles County: | 7.15 / 10,000 pop. |
| California: | 7.42 / 10,000 pop. |
| Los Angeles County: | 7.5% |
| State: | 7.3% |
| This county: | 20.4% |
| California: | 21.3% |
| This county: | 18.6% |
| California: | 17.9% |
Health and Nutrition:
| Here: | 48.8% |
| California: | 49.4% |
| This city: | 47.8% |
| State: | 48.0% |
| Montebello: | 28.1 |
| State: | 28.1 |
| This city: | 19.7% |
| California: | 20.2% |
| Here: | 13.3% |
| California: | 11.2% |
| This city: | 6.8 |
| State: | 6.8 |
| Montebello: | 31.3% |
| State: | 31.5% |
| This city: | 54.9% |
| California: | 56.4% |
| Here: | 81.6% |
| California: | 80.9% |
More about Health and Nutrition of Montebello, CA Residents
| Local government employment and payroll (March 2022) | |||||
| Function | Full-time employees | Monthly full-time payroll | Average yearly full-time wage | Part-time employees | Monthly part-time payroll |
|---|---|---|---|---|---|
| Transit | 113 | $669,182 | $71,064 | 50 | $216,026 |
| Police Protection - Officers | 63 | $827,224 | $157,566 | 0 | $0 |
| Firefighters | 51 | $622,740 | $146,527 | 0 | $0 |
| Police - Other | 25 | $144,779 | $69,494 | 2 | $4,017 |
| Other Government Administration | 24 | $177,916 | $88,958 | 0 | $0 |
| Financial Administration | 20 | $126,442 | $75,865 | 2 | $6,342 |
| Streets and Highways | 16 | $97,393 | $73,045 | 4 | $9,090 |
| Parks and Recreation | 16 | $93,514 | $70,136 | 53 | $93,500 |
| Fire - Other | 12 | $67,906 | $67,906 | 0 | $0 |
| Other and Unallocable | 9 | $34,961 | $46,615 | 0 | $0 |
| Housing and Community Development (Local) | 9 | $56,418 | $75,224 | 1 | $2,799 |
| Totals for Government | 358 | $2,918,474 | $97,826 | 112 | $331,773 |
Montebello government finances - Expenditure in 2017 (per resident):
- Construction - Housing and Community Development: $8,201,000 ($135.40)
Transit Utilities: $4,246,000 ($70.10)
Police Protection: $719,000 ($11.87)
Central Staff Services: $704,000 ($11.62)
- Current Operations - Transit Utilities: $47,461,000 ($783.59)
Police Protection: $19,941,000 ($329.23)
Local Fire Protection: $12,541,000 ($207.05)
Central Staff Services: $7,837,000 ($129.39)
Parks and Recreation: $6,033,000 ($99.61)
Regular Highways: $4,726,000 ($78.03)
General - Other: $4,704,000 ($77.66)
Housing and Community Development: $3,264,000 ($53.89)
Solid Waste Management: $3,236,000 ($53.43)
Financial Administration: $2,719,000 ($44.89)
Water Utilities: $2,291,000 ($37.82)
Protective Inspection and Regulation - Other: $840,000 ($13.87)
Correctional Institutions: $435,000 ($7.18)
Health - Other: $30,000 ($0.50)
- General - Interest on Debt: $4,910,000 ($81.06)
- Other Capital Outlay - Police Protection: $755,000 ($12.47)
Parks and Recreation: $539,000 ($8.90)
General - Other: $282,000 ($4.66)
- Total Salaries and Wages: $9,237,000 ($152.50)
- Water Utilities - Interest on Debt: $1,000 ($0.02)
Montebello government finances - Revenue in 2017 (per resident):
- Charges - Other: $11,618,000 ($191.81)
Solid Waste Management: $4,091,000 ($67.54)
Parks and Recreation: $2,563,000 ($42.32)
- Federal Intergovernmental - Transit Utilities: $9,445,000 ($155.94)
Housing and Community Development: $1,463,000 ($24.15)
Other: $359,000 ($5.93)
- Local Intergovernmental - Transit Utilities: $19,783,000 ($326.62)
Other: $236,000 ($3.90)
- Miscellaneous - General Revenue - Other: $3,181,000 ($52.52)
Fines and Forfeits: $2,152,000 ($35.53)
Interest Earnings: $580,000 ($9.58)
Rents: $292,000 ($4.82)
Special Assessments: $55,000 ($0.91)
- Revenue - Transit Utilities: $9,810,000 ($161.96)
Water Utilities: $2,332,000 ($38.50)
- State Intergovernmental - Transit Utilities: $2,751,000 ($45.42)
Highways: $1,207,000 ($19.93)
Other: $1,048,000 ($17.30)
General Local Government Support: $107,000 ($1.77)
- Tax - General Sales and Gross Receipts: $35,373,000 ($584.01)
Property: $28,342,000 ($467.93)
Occupation and Business License - Other: $2,372,000 ($39.16)
Other: $2,195,000 ($36.24)
Public Utilities Sales: $1,494,000 ($24.67)
Other License: $1,309,000 ($21.61)
Other Selective Sales: $402,000 ($6.64)
Documentary and Stock Transfer: $129,000 ($2.13)
Montebello government finances - Debt in 2017 (per resident):
- Long Term Debt - Outstanding Unspecified Public Purpose: $130,201,000 ($2149.63)
Beginning Outstanding - Unspecified Public Purpose: $81,693,000 ($1348.76)
Issue, Unspecified Public Purpose: $55,384,000 ($914.40)
Retired Unspecified Public Purpose: $6,876,000 ($113.52)
Montebello government finances - Cash and Securities in 2017 (per resident):
- Bond Funds - Cash and Securities: $33,062,000 ($545.86)
- Other Funds - Cash and Securities: $87,460,000 ($1443.97)
- Sinking Funds - Cash and Securities: $23,404,000 ($386.40)
2.98% of this county's 2021 resident taxpayers lived in other counties in 2020 ($81,235 average adjusted gross income)
| Here: | 2.98% |
| California average: | 5.19% |
0.01% of residents moved from foreign countries ($155 average AGI)
Los Angeles County: 0.01% California average: 0.03%
Top counties from which taxpayers relocated into this county between 2020 and 2021:
| from Orange County, CA | |
| from San Bernardino County, CA | |
| from Riverside County, CA |
4.68% of this county's 2020 resident taxpayers moved to other counties in 2021 ($97,324 average adjusted gross income)
| Here: | 4.68% |
| California average: | 6.14% |
0.01% of residents moved to foreign countries ($196 average AGI)
Los Angeles County: 0.01% California average: 0.02%
Top counties to which taxpayers relocated from this county between 2020 and 2021:
| to Orange County, CA | |
| to San Bernardino County, CA | |
| to Riverside County, CA |
| Businesses in Montebello, CA | ||||
| Name | Count | Name | Count | |
|---|---|---|---|---|
| 7-Eleven | 3 | Jones New York | 1 | |
| 99 Cents Only Stores | 2 | Journeys | 1 | |
| ALDO | 1 | KFC | 1 | |
| AMF Bowling | 1 | LA Fitness | 1 | |
| AT&T | 2 | Lane Bryant | 1 | |
| Aeropostale | 1 | LensCrafters | 1 | |
| Albertsons | 1 | Little Caesars Pizza | 1 | |
| American Eagle Outfitters | 1 | Macy's | 1 | |
| Applebee's | 1 | Marshalls | 1 | |
| AutoZone | 1 | MasterBrand Cabinets | 1 | |
| Avenue | 1 | McDonald's | 2 | |
| Bakers | 1 | Motherhood Maternity | 2 | |
| Bally Total Fitness | 1 | New York & Co | 1 | |
| Baskin-Robbins | 1 | Nike | 18 | |
| Bath & Body Works | 1 | Office Depot | 1 | |
| Budget Car Rental | 1 | Pac Sun | 1 | |
| Burger King | 2 | Panda Express | 1 | |
| CVS | 2 | Papa John's Pizza | 1 | |
| Carl\s Jr. | 3 | Payless | 2 | |
| Charlotte Russe | 1 | Penske | 2 | |
| Chevrolet | 1 | Pizza Hut | 1 | |
| Cinnabon | 1 | Quiznos | 2 | |
| Costco | 1 | RadioShack | 3 | |
| Curves | 1 | Rite Aid | 1 | |
| Dennys | 1 | Ryder Rental & Truck Leasing | 1 | |
| Domino's Pizza | 1 | Safeway | 1 | |
| El Pollo Loco | 1 | Sears | 1 | |
| Express | 1 | Sephora | 1 | |
| FedEx | 2 | Spencer Gifts | 1 | |
| Finish Line | 1 | Sprint Nextel | 1 | |
| Foot Locker | 1 | Starbucks | 3 | |
| Ford | 1 | Subway | 5 | |
| Forever 21 | 1 | T-Mobile | 6 | |
| GNC | 2 | Taco Bell | 1 | |
| GameStop | 2 | Torrid | 1 | |
| Gap | 1 | Toys"R"Us | 2 | |
| Gymboree | 1 | U-Haul | 1 | |
| H&R Block | 3 | UPS | 3 | |
| Hilton | 1 | Vans | 7 | |
| Hollister Co. | 1 | Verizon Wireless | 1 | |
| HomeTown Buffet | 1 | Victoria's Secret | 1 | |
| Hot Topic | 1 | Vons | 1 | |
| JCPenney | 1 | Walgreens | 1 | |
| Jack In The Box | 4 | YMCA | 1 | |
Strongest AM radio stations in Montebello:
- KFWB (980 AM; 50 kW; LOS ANGELES, CA; Owner: INFINITY BROADCASTING OPERATIONS, INC.)
- KMPC (1540 AM; 50 kW; LOS ANGELES, CA; Owner: ROSE CITY RADIO CORPORATION)
- KLAC (570 AM; 50 kW; LOS ANGELES, CA; Owner: AMFM RADIO LICENSES, L.L.C.)
- KTNQ (1020 AM; 50 kW; LOS ANGELES, CA; Owner: KTNQ-AM LICENSE CORP.)
- KXTA (1150 AM; 50 kW; LOS ANGELES, CA; Owner: CITICASTERS LICENSES, L.P.)
- KFI (640 AM; 50 kW; LOS ANGELES, CA; Owner: CAPSTAR TX LIMITED PARTNERSHIP)
- KDIS (1110 AM; 50 kW; PASADENA, CA; Owner: ABC,INC.)
- KXMX (1190 AM; 25 kW; ANAHEIM, CA; Owner: NEW INSPIRATION BROADCASTING COMPANY)
- KBLA (1580 AM; 50 kW; SANTA MONICA, CA)
- KRLA (870 AM; 20 kW; GLENDALE, CA; Owner: NEW INSPIRATION BROADCASTING COMPANY)
- KSPN (710 AM; 50 kW; LOS ANGELES, CA; Owner: KABC-AM RADIO, INC.)
- KNX (1070 AM; 50 kW; LOS ANGELES, CA; Owner: INFINITY BROADCASTING OPERATIONS, INC.)
- KPLS (830 AM; 50 kW; ORANGE, CA; Owner: CRN LICENSES, LLC)
Strongest FM radio stations in Montebello:
- KZLA-FM (93.9 FM; LOS ANGELES, CA; Owner: EMMIS RADIO LICENSE CORPORATION)
- KPWR (105.9 FM; LOS ANGELES, CA; Owner: EMMIS RADIO LICENSE CORPORATION)
- KLSX (97.1 FM; LOS ANGELES, CA; Owner: INFINITY BROADCASTING OPERATIONS, INC.)
- KUSC (91.5 FM; LOS ANGELES, CA; Owner: UNIVERSITY OF SOUTHERN CALIFORNIA)
- KKLA-FM (99.5 FM; LOS ANGELES, CA; Owner: NEW INSPIRATION BROADCASTING CO., INC.)
- KCBS-FM (93.1 FM; LOS ANGELES, CA; Owner: INFINITY BROADCASTING OPERATIONS, INC.)
- KSCA (101.9 FM; GLENDALE, CA; Owner: HBC LICENSE CORPORATION)
- KLOS (95.5 FM; LOS ANGELES, CA; Owner: KLOS-FM RADIO, INC.)
- KOST (103.5 FM; LOS ANGELES, CA; Owner: CAPSTAR TX LIMITED PARTNERSHIP)
- K212FA (90.3 FM; TEMPLE CITY, CA; Owner: EDUCATIONAL MEDIA FOUNDATION)
- KRTH-FM (101.1 FM; LOS ANGELES, CA; Owner: INFINITY BROADCASTING OPERATIONS, INC.)
- KIIS-FM (102.7 FM; LOS ANGELES, CA; Owner: CITICASTERS LICENSES, L.P.)
- KLVE (107.5 FM; LOS ANGELES, CA; Owner: KLVE-FM LICENSE CORP.)
- KPCC (89.3 FM; PASADENA, CA; Owner: PASADENA AREA COMMUNITY COLLEGE DISTRICT)
- KHHT (92.3 FM; LOS ANGELES, CA; Owner: AMFM RADIO LICENSES, L.L.C.)
- KBIG-FM (104.3 FM; LOS ANGELES, CA; Owner: AMFM RADIO LICENSES, L.L.C.)
- KTWV (94.7 FM; LOS ANGELES, CA; Owner: INFINITY BROADCASTING OPERATIONS, INC.)
- KMZT-FM (105.1 FM; LOS ANGELES, CA; Owner: MOUNT WILSON FM BROADCASTERS, INC.)
- KPFK (90.7 FM; LOS ANGELES, CA; Owner: PACIFICA FOUNDATION, INC)
- K216EM (91.1 FM; ARCADIA, CA; Owner: LIFE ON THE WAY COMMUNICATIONS, INC.)
TV broadcast stations around Montebello:
- KCBS-TV (Channel 2; LOS ANGELES, CA; Owner: CBS BROADCASTING INC.)
- KTRO-LP (Channel 50; LANCASTER, CA; Owner: ROBERT D. ADELMAN)
- KTLA-TV (Channel 5; LOS ANGELES, CA; Owner: KTLA INC.)
- KABC-TV (Channel 7; LOS ANGELES, CA; Owner: ABC HOLDING COMPANY, INC.)
- KNBC (Channel 4; LOS ANGELES, CA; Owner: NBC SUBSIDIARY (KNBC-TV), INC.)
- KCAL-TV (Channel 9; LOS ANGELES, CA; Owner: VIACOM TELEVISION STATIONS GROUP OF LOS ANGELES LLC)
- KMEX-TV (Channel 34; LOS ANGELES, CA; Owner: KMEX LICENSE PARTNERSHIP, G.P.)
- KAZA-TV (Channel 54; AVALON, CA; Owner: PAPPAS SOUTHERN CALIFORNIA LICENSE LLC)
- KSCI (Channel 18; LONG BEACH, CA; Owner: KSLS, INC.)
- KDOC-TV (Channel 56; ANAHEIM, CA; Owner: GOLDEN ORANGE BROADCASTING CO., INC.)
- KOCE-TV (Channel 50; HUNTINGTON BEACH, CA; Owner: BD. OF TRUSTEES, COAST COMMUNITY COLLEGE DIST.)
- KXLA (Channel 44; RANCHO PALOS VERDES, CA; Owner: RANCHO PALOS VERDES BROADCASTERS, INC.)
- KCET (Channel 28; LOS ANGELES, CA; Owner: COMMUNITY TELEVISION OF SOUTHERN CALIFORNIA)
- KFTR (Channel 46; ONTARIO, CA; Owner: TELEFUTURA LOS ANGELES LLC)
- KHIZ (Channel 64; BARSTOW, CA; Owner: SUNBELT TELEVISION, INC.)
- KTTV (Channel 11; LOS ANGELES, CA; Owner: FOX TELEVISION STATIONS, INC.)
- KWHY-TV (Channel 22; LOS ANGELES, CA; Owner: TELEMUNDO OF LOS ANGELES LICENSE CORPORATION)
- KVEA (Channel 52; CORONA, CA; Owner: ESTRELLA LICENSE CORPORATION)
- KCOP-TV (Channel 13; LOS ANGELES, CA; Owner: FOX TELEVISION STATIONS, INC.)
- KTBN-TV (Channel 40; SANTA ANA, CA; Owner: TRINITY BROADCASTING NETWORK, INC.)
- KSFV-LP (Channel 26; SAN FERNANDO VALLEY, CA; Owner: VENTURE TECHNOLOGIES GROUP, LLC)
- KLCS (Channel 58; LOS ANGELES, CA; Owner: LOS ANGELES UNIFIED SCHOOL DISTRICT)
- KHTV-LP (Channel 48; INLAND EMPIRE, CA; Owner: VENTURE TECHNOLOGIES GROUP, LLC)
- National Bridge Inventory (NBI) Statistics
- 17Number of bridges
- 177ft / 53.9mTotal length
- $3,178,000Total costs
- 1,140,442Total average daily traffic
- 40,923Total average daily truck traffic
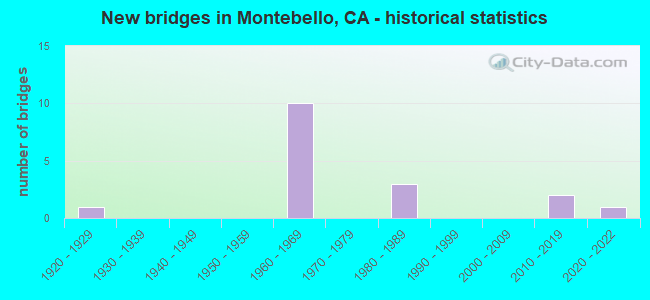
- New bridges - historical statistics
- 11920-1929
- 101960-1969
- 31980-1989
- 22010-2019
- 12020-2022
FCC Registered Antenna Towers:
18 (See the full list of FCC Registered Antenna Towers in Montebello)FCC Registered Private Land Mobile Towers:
1 (See the full list of FCC Registered Private Land Mobile Towers in Montebello, CA)FCC Registered Broadcast Land Mobile Towers:
44 (See the full list of FCC Registered Broadcast Land Mobile Towers)FCC Registered Microwave Towers:
60 (See the full list of FCC Registered Microwave Towers in this town)FCC Registered Paging Towers:
1 (See the full list of FCC Registered Paging Towers)FCC Registered Amateur Radio Licenses:
171 (See the full list of FCC Registered Amateur Radio Licenses in Montebello)FAA Registered Aircraft Manufacturers and Dealers:
1- WORLDWIDE AEROS CORP, 1734 Aeros Way, Montebello, CA 90640
Certificate: D003506 (Corporation), Certificate Issue Date: 08/19/2017, Expiration Date: 08/18/2018
FAA Registered Aircraft:
5- Aircraft: SCHWEIZER 269C (Category: Land, Seats: 3, Weight: Up to 12,499 Pounds), Engine: LYCOMING HIO-360 SER (205 HP) (Reciprocating)
N-Number: 102WP, N102WP, N-102WP, Serial Number: S1572, Year manufactured: 1991, Airworthiness Date: 11/01/1991, Certificate Issue Date: 05/15/2008
Registrant (Individual): Randy S Garcia, Po Box 3179, Montebello, CA 90640 - Aircraft: CESSNA 172S (Category: Land, Seats: 4, Weight: Up to 12,499 Pounds), Engine: LYCOMING IO-360-L2A (180 HP) (Reciprocating)
N-Number: 214GZ, N214GZ, N-214GZ, Serial Number: 172S9862, Year manufactured: 2005, Airworthiness Date: 08/17/2005, Certificate Issue Date: 01/13/2016
Registrant (Individual): Zarik Menassian, 1615 W Mines Ave, Montebello, CA 90640 - Aircraft: CESSNA TU206F (Category: Land, Seats: 6, Weight: Up to 12,499 Pounds, Speed: 127 mph), Engine: CONT MOTOR TSIO-520 SER (300 HP) (Reciprocating)
N-Number: 51237, N51237, N-51237, Serial Number: U20601983, Year manufactured: 1973, Airworthiness Date: 03/02/1973, Certificate Issue Date: 05/30/2012
Registrant (Individual): James A Cox, 1711 S Bluff Rd, Montebello, CA 90640 - Aircraft: BELLANCA 8KCAB (Category: Land, Seats: 2, Weight: Up to 12,499 Pounds, Speed: 101 mph), Engine: LYCOMING AEIO-360 SER (180 HP) (Reciprocating)
N-Number: 5503Y, N5503Y, N-5503Y, Serial Number: 418-78, Year manufactured: 1978, Airworthiness Date: 07/21/1978, Certificate Issue Date: 03/23/2017
Registrant (Co-Owned): Benjamin L Bundt, 405 Bluff Rd, Montebello, CA 90640, Other Owners: Leanne Powers, Dixon Wong - Aircraft: CESSNA 175 (Category: Land, Seats: 4, Weight: Up to 12,499 Pounds, Speed: 105 mph), Engine: CONT MOTOR 0-300 SER (145 HP) (Reciprocating)
N-Number: 6832D, N6832D, N-6832D, Serial Number: 55751, Year manufactured: 1959, Airworthiness Date: 08/20/1959, Certificate Issue Date: 11/07/2016
Registrant (Individual): Belsazar Uriarte, 2208 Easton St, Montebello, CA 90640
Deregistered: Cancel Date: 12/16/2019
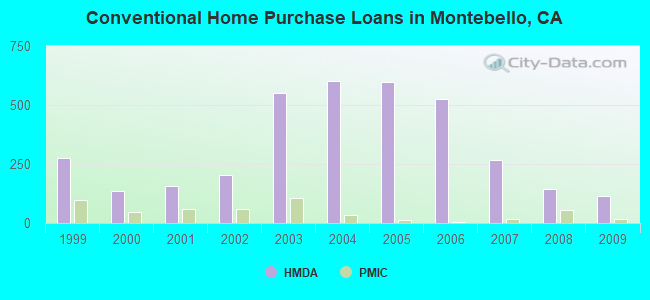
| Home Mortgage Disclosure Act Aggregated Statistics For Year 2009 (Based on 12 full and 3 partial tracts) | ||||||||||||
| A) FHA, FSA/RHS & VA Home Purchase Loans | B) Conventional Home Purchase Loans | C) Refinancings | D) Home Improvement Loans | E) Loans on Dwellings For 5+ Families | F) Non-occupant Loans on < 5 Family Dwellings (A B C & D) | |||||||
|---|---|---|---|---|---|---|---|---|---|---|---|---|
| Number | Average Value | Number | Average Value | Number | Average Value | Number | Average Value | Number | Average Value | Number | Average Value | |
| LOANS ORIGINATED | 86 | $327,102 | 113 | $249,332 | 478 | $254,823 | 48 | $202,236 | 11 | $850,652 | 50 | $239,044 |
| APPLICATIONS APPROVED, NOT ACCEPTED | 10 | $284,453 | 20 | $200,512 | 75 | $286,276 | 8 | $182,834 | 0 | $0 | 12 | $238,360 |
| APPLICATIONS DENIED | 27 | $348,520 | 32 | $255,245 | 229 | $281,141 | 33 | $140,298 | 1 | $937,000 | 28 | $207,106 |
| APPLICATIONS WITHDRAWN | 23 | $328,939 | 21 | $220,256 | 131 | $268,624 | 11 | $157,501 | 1 | $2,400,000 | 12 | $241,961 |
| FILES CLOSED FOR INCOMPLETENESS | 11 | $332,491 | 5 | $204,538 | 46 | $290,305 | 4 | $144,295 | 0 | $0 | 5 | $232,414 |
Detailed mortgage data for all 15 tracts in Montebello, CA
| Private Mortgage Insurance Companies Aggregated Statistics For Year 2009 (Based on 12 full and 3 partial tracts) | ||||
| A) Conventional Home Purchase Loans | B) Refinancings | |||
|---|---|---|---|---|
| Number | Average Value | Number | Average Value | |
| LOANS ORIGINATED | 15 | $281,569 | 5 | $343,936 |
| APPLICATIONS APPROVED, NOT ACCEPTED | 8 | $283,660 | 7 | $380,161 |
| APPLICATIONS DENIED | 3 | $297,867 | 0 | $0 |
| APPLICATIONS WITHDRAWN | 1 | $180,850 | 1 | $390,000 |
| FILES CLOSED FOR INCOMPLETENESS | 1 | $585,000 | 1 | $372,150 |
2005 - 2018 National Fire Incident Reporting System (NFIRS) incidents
- Fire incident types reported to NFIRS in Montebello, CA
- 21438.3%Structure Fires
- 19735.2%Outside Fires
- 11019.7%Mobile Property/Vehicle Fires
- 386.8%Other
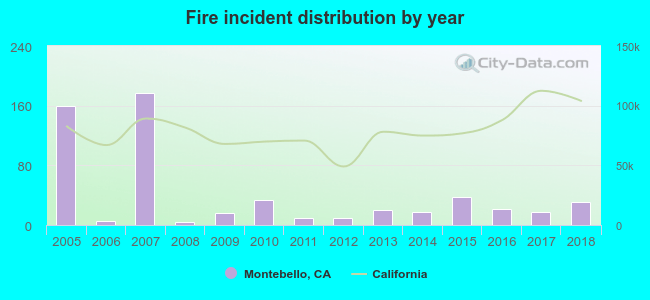 Based on the data from the years 2005 - 2018 the average number of fires per year is 40. The highest number of fires - 177 took place in 2007, and the least - 4 in 2008. The data has a declining trend.
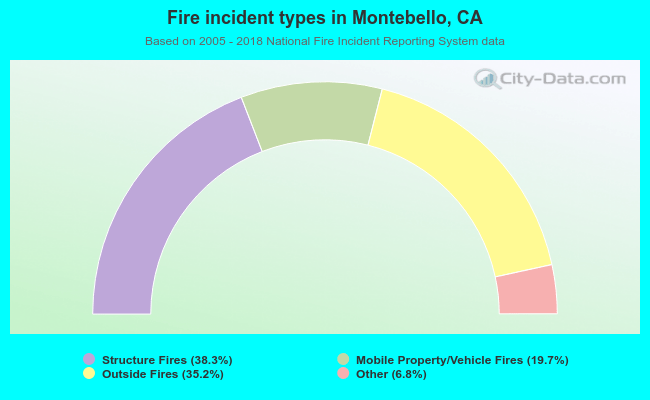 When looking into fire subcategories, the most reports belonged to: Structure Fires (38.3%), and Outside Fires (35.2%).
Fire-safe hotels and motels in Montebello, California:
- Hilton Garden Inn Montebello, 801 Via San Clemente, Montebello, California 90640 , Phone: (323) 724-5900, Fax: (323) 724-3554
- Quality Inn & Suites, 7709 Telegraph Rd, Montebello, California 90640 , Phone: (323) 724-1400, Fax: (323) 721-4410
- Home 2 Suites by Hilton Los Angeles Montebello, 988 Via San Clemente, Montebello, California 90640 , Phone: (323) 621-4111, Fax: (323) 621-4188
| Most common first names in Montebello, CA among deceased individuals | ||
| Name | Count | Lived (average) |
|---|---|---|
| Mary | 256 | 79.2 years |
| John | 242 | 74.5 years |
| Maria | 236 | 80.5 years |
| Frank | 155 | 75.9 years |
| William | 150 | 76.7 years |
| Robert | 146 | 69.7 years |
| Joseph | 142 | 75.6 years |
| George | 129 | 74.4 years |
| Jose | 124 | 74.0 years |
| James | 108 | 71.5 years |
| Most common last names in Montebello, CA among deceased individuals | ||
| Last name | Count | Lived (average) |
|---|---|---|
| Garcia | 145 | 75.0 years |
| Lopez | 139 | 73.8 years |
| Martinez | 128 | 73.4 years |
| Hernandez | 98 | 73.7 years |
| Rodriguez | 90 | 75.8 years |
| Perez | 72 | 76.4 years |
| Ramirez | 71 | 72.1 years |
| Sanchez | 67 | 73.7 years |
| Gonzales | 58 | 72.7 years |
| Gomez | 55 | 78.0 years |
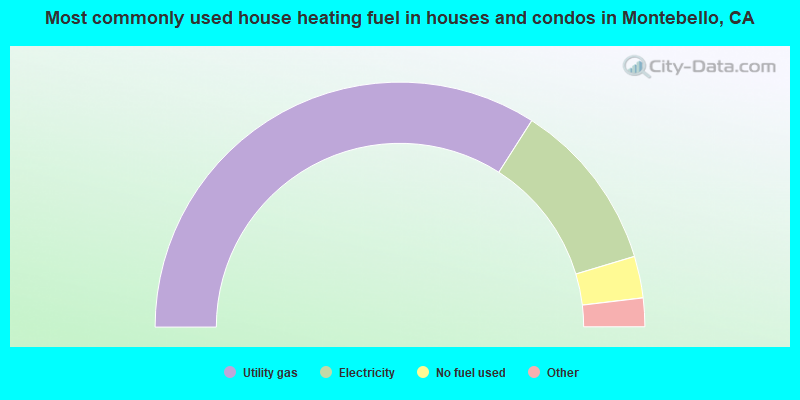
- 68.1%Utility gas
- 22.6%Electricity
- 5.5%No fuel used
- 2.3%Wood
- 1.3%Bottled, tank, or LP gas
- 0.1%Solar energy
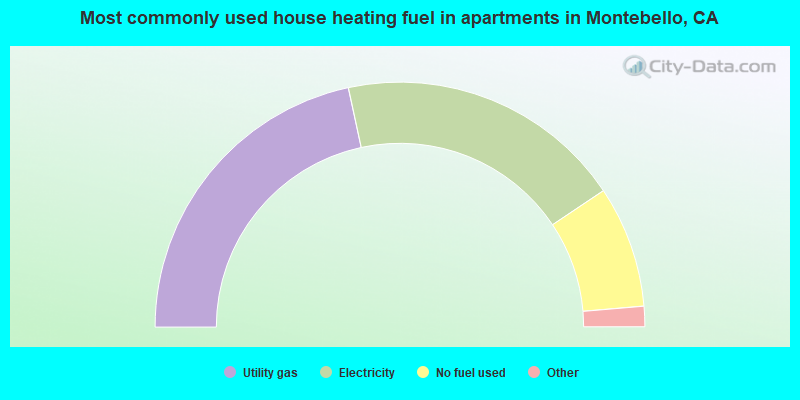
- 43.3%Utility gas
- 38.0%Electricity
- 16.1%No fuel used
- 2.5%Bottled, tank, or LP gas
- 0.2%Wood
Montebello compared to California state average:
- Unemployed percentage below state average.
- Black race population percentage significantly below state average.
- Hispanic race population percentage above state average.
- Length of stay since moving in significantly above state average.
Montebello on our top lists:
- #12 on the list of "Top 101 cities with the most residents born in Armenia (population 500+)"
- #16 on the list of "Top 101 cities with largest percentage of females in industries: wholesale trade (population 50,000+)"
- #21 on the list of "Top 101 cities with the highest number of arson incidents per 100,000 residents, excludes tourist destinations and others with a lot of outsiders visiting based on city industries data (population 50,000+)"
- #21 on the list of "Top 101 cities with the highest average snowfall in a year (population 50,000+)"
- #28 on the list of "Top 101 cities with the lowest number of thefts per 100,000 residents (population 50,000+)"
- #33 on the list of "Top 100 cities with highest ratio of median house value to median household income (pop. 50,000+)"
- #36 on the list of "Top 100 cities with longest commuting times (pop. 50,000+)"
- #38 on the list of "Top 101 cities with the lowest percentage of English-only speaking households, population 50,000+"
- #39 on the list of "Top 101 cities with the most cars per house, population 50,000+"
- #41 on the list of "Top 101 cities with largest percentage of males in industries: other services, except public administration (population 50,000+)"
- #43 on the list of "Top 101 cities with largest percentage of males in occupations: material moving occupations (population 50,000+)"
- #51 on the list of "Top 101 cities with the lowest number of rapes per 100,000 residents (population 50,000+)"
- #61 on the list of "Top 101 cities with the highest number of auto thefts per 100,000 residents, excludes tourist destinations and others with a lot of outsiders visiting based on city industries data (population 50,000+)"
- #66 on the list of "Top 101 cities with largest percentage of males in occupations: office and administrative support occupations (population 50,000+)"
- #66 on the list of "Top 101 cities with largest percentage of females in occupations: office and administrative support occupations (population 50,000+)"
- #70 on the list of "Top 101 cities with largest percentage of males in industries: wholesale trade (population 50,000+)"
- #76 on the list of "Top 100 least-educated cities (pop. 50,000+)"
- #77 on the list of "Top 100 cities with highest percentage of foreign-born residents (pop. 50,000+)"
- #79 on the list of "Top 101 cities with the smallest sunshine amount differences during a year (population 50,000+)"
- #79 on the list of "Top 100 cities with smallest houses (pop. 50,000+)"
- #75 (90640) on the list of "Top 101 zip codes with the largest percentage of Arab first ancestries (pop 5,000+)"
- #1 on the list of "Top 101 counties with the most Evangelical Protestant congregations"
- #1 on the list of "Top 101 counties with the most Mainline Protestant congregations"
- #1 on the list of "Top 101 counties with the most Orthodox adherents"
- #1 on the list of "Top 101 counties with the highest ground withdrawal of fresh water for public supply (pop. 50,000+)"
- #1 on the list of "Top 101 counties with the most Catholic adherents (pop. 50,000+)"

|
|
Total of 78 patent applications in 2008-2024.