Estimated zip code population in 2022: 61,776 Zip code population in 2010: 62,549 Zip code population in 2000: 62,416
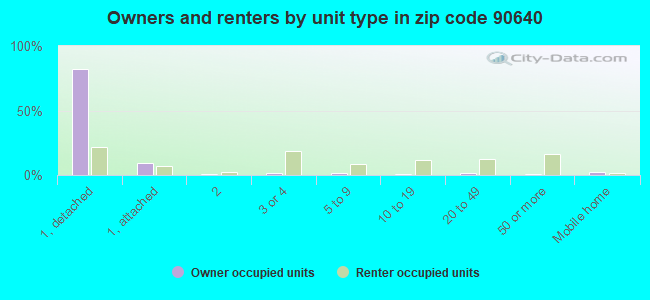
Houses and condos: 20,512 Renter-occupied apartments: 10,500
% of renters here:
53%
State:
44%
March 2022 cost of living index in zip code 90640: 135.6 (high, U.S. average is 100)
Land area: 8.5 sq. mi. Water area: 0.0 sq. mi.
Population density: 7,276 people per square mile
(high).
OSM Map
General Map
Google Map
MSN Map
OSM Map
General Map
Google Map
MSN Map
OSM Map
General Map
Google Map
MSN Map
OSM Map
General Map
Google Map
MSN Map
Please wait while loading the map...
Real estate property taxes paid for housing units in 2022:
This zip code:
0.7% ($4,487)
California:
0.7% ($4,831)
Median real estate property taxes paid for housing units with mortgages in 2022: $5,429 (0.8%) Median real estate property taxes paid for housing units with no mortgage in 2022: $3,545 (0.5%)
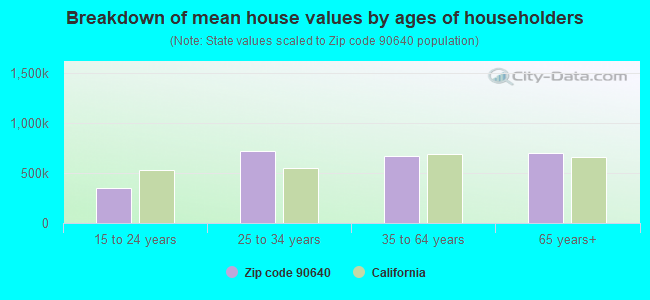
Estimated median house/condo value in 2022: $682,564
90640:
$682,564
California:
$715,900
According to our research of California and other state lists, there were 58 registered sex offenders living in 90640 zip code as of April 26, 2024. The ratio of all residents to sex offenders in zip code 90640 is 1,110 to 1. The ratio of registered sex offenders to all residents in this zip code is lower than the state average.
Median resident age:
This zip code:
38.7 years
California median age:
37.9 years
Average household size:
This zip code:
3.1 people
California:
2.8 people
Averages for the 2020 tax year for zip code 90640, filed in 2021:
Average Adjusted Gross Income (AGI) in 2020: $50,978 (Individual Income Tax Returns)
Here:
$50,978
State:
$95,910
Salary/wage: $47,135 (reported on 81.1% of returns)
Here:
$47,135
State:
$77,331
(% of AGI for various income ranges: 1198.4% for AGIs below $25k, 4019.7% for AGIs $25k-50k, 7509.3% for AGIs $50k-75k, 10990.9% for AGIs $75k-100k, 19189.4% for AGIs $100k-200k, 61368.3% for AGIs over 200k)
Taxable interest for individuals: $1,132 (reported on 24.4% of returns)
This zip code:
$1,132
California:
$2,294
(% of AGI for various income ranges: 11.8% for AGIs below $25k, 11.5% for AGIs $25k-50k, 31.2% for AGIs $50k-75k, 66.5% for AGIs $75k-100k, 128.6% for AGIs $100k-200k, 1580.0% for AGIs over 200k)
Ordinary dividends: $3,781 (reported on 8.8% of returns)
Here:
$3,781
State:
$10,949
(% of AGI for various income ranges: 8.0% for AGIs below $25k, 12.0% for AGIs $25k-50k, 27.8% for AGIs $50k-75k, 57.0% for AGIs $75k-100k, 188.7% for AGIs $100k-200k, 2285.0% for AGIs over 200k)
Net capital gain/loss in AGI: +$9,634 (reported on 9.6% of returns)
Here:
+$9,634
State:
+$49,306
(% of AGI for various income ranges: 5.3% for AGIs $25k-50k, 42.8% for AGIs $50k-75k, 91.1% for AGIs $75k-100k, 368.8% for AGIs $100k-200k, 10970.6% for AGIs over 200k)
Profit/loss from business: +$8,903 (reported on 17.5% of returns)
Here:
+$8,903
State:
+$15,671
(% of AGI for various income ranges: 225.5% for AGIs below $25k, 156.9% for AGIs $25k-50k, 232.5% for AGIs $50k-75k, 304.8% for AGIs $75k-100k, 381.4% for AGIs $100k-200k, 1867.2% for AGIs over 200k)
Taxable individual retirement arrangement distribution: $17,240 (reported on 4.0% of returns)
90640:
$17,240
California:
$23,505
(% of AGI for various income ranges: 23.5% for AGIs below $25k, 33.3% for AGIs $25k-50k, 85.2% for AGIs $50k-75k, 127.4% for AGIs $75k-100k, 540.0% for AGIs $100k-200k, 2375.6% for AGIs over 200k)
Self-employed (Keogh) retirement plans: $18,650 (reported on 0.1% of returns)
90640:
$18,650
California:
$30,163
(% of AGI for various income ranges: 46.0% for AGIs $100k-200k)
Total itemized deductions: $29,699 (reported on 11.0% of returns)
Here:
$29,699
State:
$39,517
(% of AGI for various income ranges: 51.5% for AGIs below $25k, 171.4% for AGIs $25k-50k, 534.9% for AGIs $50k-75k, 1051.8% for AGIs $75k-100k, 2238.1% for AGIs $100k-200k, 9131.1% for AGIs over 200k)
Charity contributions: $5,618 (reported on 9.1% of returns)
Here:
$5,618
State:
$12,598
(% of AGI for various income ranges: 2.9% for AGIs below $25k, 21.7% for AGIs $25k-50k, 73.0% for AGIs $50k-75k, 130.9% for AGIs $75k-100k, 341.7% for AGIs $100k-200k, 2374.4% for AGIs over 200k)
Taxes paid: $8,776 (reported on 11.0% of returns)
90640:
$8,776
State:
$8,807
(% of AGI for various income ranges: 14.3% for AGIs below $25k, 47.4% for AGIs $25k-50k, 167.6% for AGIs $50k-75k, 344.6% for AGIs $75k-100k, 715.0% for AGIs $100k-200k, 1856.1% for AGIs over 200k)
Earned income credit: $2,042 (reported on 18.9% of returns)
Here:
$2,042
State:
$2,074
(% of AGI for various income ranges: 100.6% for AGIs below $25k, 69.5% for AGIs $25k-50k, 0.6% for AGIs $50k-75k)
Percentage of individuals using paid preparers for their 2020 taxes: 90.8%
Here:
91%
State:
92%
(% for various income ranges: 89.5% for AGIs below $25k, 91.6% for AGIs $25k-50k, 91.8% for AGIs $50k-75k, 91.5% for AGIs $75k-100k, 91.5% for AGIs $100k-200k, 90.0% for AGIs over 200k)
Averages for the 2012 tax year for zip code 90640, filed in 2013:
Average Adjusted Gross Income (AGI) in 2012: $41,366 (Individual Income Tax Returns)
Here:
$41,366
State:
$72,726
Salary/wage: $38,262 (reported on 83.3% of returns)
Here:
$38,262
State:
$59,079
(% of AGI for various income ranges: 74.5% for AGIs below $25k, 86.0% for AGIs $25k-50k, 82.9% for AGIs $50k-75k, 78.8% for AGIs $75k-100k, 75.9% for AGIs $100k-200k, 42.8% for AGIs over 200k)
Taxable interest for individuals: $939 (reported on 24.9% of returns)
This zip code:
$939
California:
$2,146
(% of AGI for various income ranges: 0.6% for AGIs below $25k, 0.3% for AGIs $25k-50k, 0.4% for AGIs $50k-75k, 0.5% for AGIs $75k-100k, 0.7% for AGIs $100k-200k, 1.1% for AGIs over 200k)
Ordinary dividends: $3,209 (reported on 8.4% of returns)
Here:
$3,209
State:
$9,308
(% of AGI for various income ranges: 0.5% for AGIs below $25k, 0.3% for AGIs $25k-50k, 0.4% for AGIs $50k-75k, 0.6% for AGIs $75k-100k, 0.9% for AGIs $100k-200k, 1.8% for AGIs over 200k)
Net capital gain/loss in AGI: +$6,152 (reported on 6.8% of returns)
Here:
+$6,152
State:
+$30,460
(% of AGI for various income ranges: 0.9% for AGIs $100k-200k, 10.2% for AGIs over 200k)
Profit/loss from business: +$10,889 (reported on 15.9% of returns)
Here:
+$10,889
State:
+$17,064
(% of AGI for various income ranges: 12.6% for AGIs below $25k, 3.5% for AGIs $25k-50k, 2.3% for AGIs $50k-75k, 2.3% for AGIs $75k-100k, 2.5% for AGIs $100k-200k, 3.0% for AGIs over 200k)
Taxable individual retirement arrangement distribution: $12,190 (reported on 4.9% of returns)
90640:
$12,190
California:
$19,557
(% of AGI for various income ranges: 1.4% for AGIs below $25k, 0.9% for AGIs $25k-50k, 1.3% for AGIs $50k-75k, 1.9% for AGIs $75k-100k, 2.0% for AGIs $100k-200k, 1.6% for AGIs over 200k)
Self-employment retirement plans: $22,600 (reported on 0.1% of returns)
90640:
$22,600
California:
$24,530
Total itemized deductions: $22,983 (29% of AGI, reported on 26.7% of returns)
Here:
$22,983
State:
$34,004
Here:
28.6% of AGI
State:
22.7% of AGI
(% of AGI for various income ranges: 7.2% for AGIs below $25k, 11.1% for AGIs $25k-50k, 16.2% for AGIs $50k-75k, 18.9% for AGIs $75k-100k, 19.8% for AGIs $100k-200k, 16.8% for AGIs over 200k)
Charity contributions: $2,550 (reported on 21.8% of returns)
Here:
$2,550
State:
$4,659
(% of AGI for various income ranges: 0.4% for AGIs below $25k, 0.9% for AGIs $25k-50k, 1.4% for AGIs $50k-75k, 1.7% for AGIs $75k-100k, 2.0% for AGIs $100k-200k, 1.9% for AGIs over 200k)
Taxes paid: $7,705 (reported on 26.6% of returns)
90640:
$7,705
State:
$14,448
(% of AGI for various income ranges: 1.6% for AGIs below $25k, 2.7% for AGIs $25k-50k, 4.7% for AGIs $50k-75k, 6.3% for AGIs $75k-100k, 7.6% for AGIs $100k-200k, 9.3% for AGIs over 200k)
Earned income credit: $2,378 (reported on 25.6% of returns)
Here:
$2,378
State:
$2,286
(% of AGI for various income ranges: 7.8% for AGIs below $25k, 1.4% for AGIs $25k-50k)
Percentage of individuals using paid preparers for their 2012 taxes: 74.4%
Here:
74%
State:
64%
(% for various income ranges: 72.9% for AGIs below $25k, 75.7% for AGIs $25k-50k, 75.5% for AGIs $50k-75k, 75.9% for AGIs $75k-100k, 75.3% for AGIs $100k-200k, 73.1% for AGIs over 200k)
Averages for the 2004 tax year for zip code 90640, filed in 2005:
Average Adjusted Gross Income (AGI) in 2004: $36,909 (Individual Income Tax Returns)
Here:
$36,909
State:
$58,600
Salary/wage: $34,534 (reported on 84.2% of returns)
Here:
$34,534
State:
$49,455
(% of AGI for various income ranges: 144.3% for AGIs below $10k, 79.6% for AGIs $10k-25k, 87.3% for AGIs $25k-50k, 84.3% for AGIs $50k-75k, 81.2% for AGIs $75k-100k, 58.3% for AGIs over 100k)
Taxable interest for individuals: $1,426 (reported on 34.7% of returns)
This zip code:
$1,426
California:
$2,365
(% of AGI for various income ranges: 6.8% for AGIs below $10k, 1.1% for AGIs $10k-25k, 0.9% for AGIs $25k-50k, 1.0% for AGIs $50k-75k, 1.0% for AGIs $75k-100k, 2.2% for AGIs over 100k)
Taxable dividends: $1,887 (reported on 11.2% of returns)
Here:
$1,887
State:
$4,746
(% of AGI for various income ranges: 2.5% for AGIs below $10k, 0.4% for AGIs $10k-25k, 0.3% for AGIs $25k-50k, 0.4% for AGIs $50k-75k, 0.5% for AGIs $75k-100k, 1.0% for AGIs over 100k)
Net capital gain/loss: +$13,342 (reported on 9.5% of returns)
Here:
+$13,342
State:
+$23,418
(% of AGI for various income ranges: -1.5% for AGIs below $10k, -0.1% for AGIs $10k-25k, 0.3% for AGIs $25k-50k, 0.7% for AGIs $50k-75k, 1.3% for AGIs $75k-100k, 13.3% for AGIs over 100k)
Profit/loss from business: +$10,594 (reported on 15.2% of returns)
Here:
+$10,594
State:
+$16,826
(% of AGI for various income ranges: 25.4% for AGIs below $10k, 8.2% for AGIs $10k-25k, 3.9% for AGIs $25k-50k, 3.3% for AGIs $50k-75k, 2.4% for AGIs $75k-100k, 3.3% for AGIs over 100k)
IRA payment deduction: $2,948 (reported on 2.1% of returns)
90640:
$2,948
California:
$3,192
(% of AGI for various income ranges: 0.2% for AGIs below $10k, 0.1% for AGIs $10k-25k, 0.2% for AGIs $25k-50k, 0.2% for AGIs $50k-75k, 0.2% for AGIs $75k-100k, 0.1% for AGIs over 100k)
Self-employed pension: $14,412 (reported on 0.3% of returns)
Here:
$14,412
California:
$17,688
(% of AGI for various income ranges: 0.1% for AGIs $50k-75k, 0.1% for AGIs $75k-100k, 0.3% for AGIs over 100k)
Total itemized deductions: $20,278 (30% of AGI, reported on 29.6% of returns)
Here:
$20,278
State:
$28,113
Here:
29.7% of AGI
State:
25.3% of AGI
(% of AGI for various income ranges: 17.8% for AGIs below $10k, 9.9% for AGIs $10k-25k, 13.9% for AGIs $25k-50k, 19.0% for AGIs $50k-75k, 21.0% for AGIs $75k-100k, 17.9% for AGIs over 100k)
Charity contributions deductions: $2,499 (4% of AGI, reported on 26.1% of returns)
Here:
$2,499
State:
$3,923
Here:
3.5% of AGI
State:
3.3% of AGI
(% of AGI for various income ranges: 0.9% for AGIs below $10k, 0.7% for AGIs $10k-25k, 1.4% for AGIs $25k-50k, 2.1% for AGIs $50k-75k, 2.3% for AGIs $75k-100k, 2.4% for AGIs over 100k)
Total tax: $4,772 (reported on 69.3% of returns)
90640:
$4,772
State:
$10,761
(% of AGI for various income ranges: 6.6% for AGIs below $10k, 3.6% for AGIs $10k-25k, 5.8% for AGIs $25k-50k, 8.4% for AGIs $50k-75k, 9.6% for AGIs $75k-100k, 16.3% for AGIs over 100k)
Earned income credit: $1,840 (reported on 22.9% of returns)
Here:
$1,840
State:
$1,763
Percentage of individuals using paid preparers for their 2004 taxes: 74.4%
Here:
74%
State:
66%
(% for various income ranges: 69.4% for AGIs below $10k, 76.1% for AGIs $10k-25k, 74.9% for AGIs $25k-50k, 75.4% for AGIs $50k-75k, 74.7% for AGIs $75k-100k, 76.7% for AGIs over 100k)
Likely homosexual households (counted as self-reported same-sex unmarried-partner households)
Lesbian couples: 0.2% of all households
Gay men: 0.3% of all households
Household received Food Stamps/SNAP in the past 12 months: 3,451 Household did not receive Food Stamps/SNAP in the past 12 months: 16,437
Women who had a birth in the past 12 months: 683 (373 now married, 312 unmarried) Women who did not have a birth in the past 12 months: 13,891 (4,655 now married, 9,271 unmarried)
Housing units in zip code 90640 with a mortgage: 5,291 (414 second mortgage, 44 home equity loan, 330 both second mortgage and home equity loan) Houses without a mortgage: 85
Median monthly owner costs for units with a mortgage: $2,501 Median monthly owner costs for units without a mortgage: $634
Residents with income below the poverty level in 2022:
This zip code:
13.0%
Whole state:
12.2%
Residents with income below 50% of the poverty level in 2022:
This zip code:
6.6%
Whole state:
6.2%
Median number of rooms in houses and condos:
Here:
5.9
State:
6.0
Median number of rooms in apartments:
Here:
4.0
State:
3.9
Notable locations in this zip code not listed on our city pages
Notable locations in zip code 90640: Kenosha Spur (A), Montebello Municipal Golf Course (B), Montebello Branch County of Los Angeles Public Library (C), Chet Holifield Branch County of Los Angeles Public Library (D), Montebello Womans Club (E), Montebello Police Building (F), Montebello City Hall (G), Lifeline Ambulance Service (H), Montebello Fire Department Station 3 (I), Montebello Fire Department Station 2 (J), Montebello Fire Department Station 1 Headquarters (K). Display/hide their locations on the map
Shopping Centers: Crawfords Shopping Center (1), Montebello Town Square Shopping Center (2), Montebello Town Center Shopping Center (3), Montebello Plaza Shopping Center (4), Montebello Mart Shopping Center (5). Display/hide their locations on the map
Churches in zip code 90640 include: Beverly Boulevard Four Square Gospel Church (A), Church of Christ (B), Cross and Crown Lutheran Church (C), First Assembly of God Church of Montebello (D), First Baptist Church of Montebello (E), First Church of Christ Scientist (F), First Church of the Nazarene (G), First Friends Church (H), Iglesia Methodista Libre (I). Display/hide their locations on the map
Parks in zip code 90640 include: Bicknell Park (1), Chet Holifield Park (2), Acuna Park (3), Grant Rea Park (4), Montebello Park (5), Reggie Rodriguez Park (6), Ashiya Park (7). Display/hide their locations on the map
5,609 married couples with children.
4,520 single-parent households (1,229 men, 3,291 women).
28.7% of residents of 90640 zip code speak English at home.
58.2% of residents speak Spanish at home (63% very well, 15% well, 15% not well, 7% not at all).
4.2% of residents speak other Indo-European language at home (65% very well, 25% well, 10% not well, 1% not at all).
9.5% of residents speak Asian or Pacific Island language at home (41% very well, 26% well, 22% not well, 11% not at all).
0.1% of residents speak other language at home (62% very well, 4% well, 35% not well).
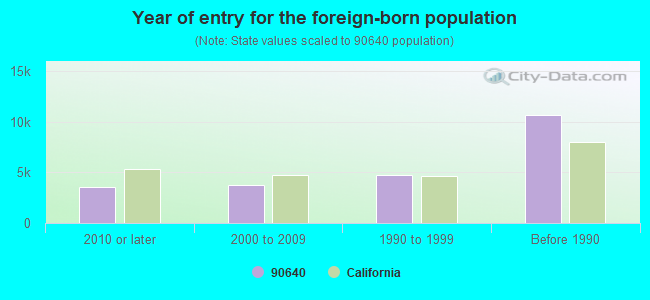
Foreign born population: 22,619 (36.6%) (54.2% of them are naturalized citizens)
Major facilities with environmental interests located in this zip code:
CHEVRON 1001654 MONTEBELLO (601 SOUTH VAIL AVE in MONTEBELLO, CA)
OIL CONTROL (Facility Response Plan for oil discharge) STATE MASTER (California - Hazardous Waste Tracking) - HAZARDOU WASTE PROGRAM CRITERIA AND HAZARDOUS AIR POLLUTANT INVENTORY (Inventory of air pollution sources) Small Quantity Generators, between 100 kg and 1000 kg of hazardous waste/month (Resource Conservation and Recovery Act (tracking hazardous waste)) HAZARDOUS WASTE BIENNIAL REPORTER (Resource Conservation and Recovery Act (tracking hazardous waste)) Large Quantity Generators, more that 1000 kg of hazardous waste/month (Resource Conservation and Recovery Act (tracking hazardous waste)) TRI REPORTER (Tracking of toxic chemicals releasing facilities) Business SIC classification: PETROLEUM BULK STATIONS AND TERMINALS Organizations: CHEVRON U.S.A. PRODUCTS (CONTACT/GENERAL)
, CHEVRON PRODUCTS CO. (CONTACT/OPERATOR)
Alternative names: CHEVRON PRODS. CO. MONTEBELLO TERMINAL, CHEVRON U.S.A. INC (EIS USE), CHEVRON USA INC MONTEBELLO STA, CHEVRON USA INC MONTEBELLO SUPPLY SITE, HEVRON PRODS. CO. MONTEBELLO TERMINAL, HEVRON PRODS. CO. MONTEBELLO TERMINAL, MONTEBELLO TERMINAL
IDEAL RADIATOR CORP (1801 BLUFF RD in MONTEBELLO, CA)
STATE MASTER (California - Hazardous Waste Tracking) - HAZARDOU WASTE PROGRAM Large Quantity Generators, more that 1000 kg of hazardous waste/month (Resource Conservation and Recovery Act (tracking hazardous waste)) - ICIS-, ENFORCEMENT/COMPLIANCE ACTIVITY Business NAICS classification: OTHER AUTOMOTIVE MECHANICAL AND ELECTRICAL REPAIR AND MAINTENANCE.
MONARCH LITHO INCORPORATED (1501 DATE ST in MONTEBELLO, CA)
AIR MAJOR (AIRS/AFS) STATE MASTER (California - Hazardous Waste Tracking) - HAZARDOU WASTE PROGRAM CRITERIA AND HAZARDOUS AIR POLLUTANT INVENTORY (Inventory of air pollution sources) Small Quantity Generators, between 100 kg and 1000 kg of hazardous waste/month (Resource Conservation and Recovery Act (tracking hazardous waste)) - notification TRI REPORTER (Tracking of toxic chemicals releasing facilities) Business SIC classification: COMMERCIAL PRINTING, LITHOGRAPHIC Business NAICS classification: COMMERCIAL LITHOGRAPHIC PRINTING. Organizations: ROBERT LOPEZ (CONTACT/OWNER)
CHEVRON STATION NO 94784 (1761 PARAMOUNT BLVD in MONTEBELLO, CA)
STATE MASTER (California - Hazardous Waste Tracking) - HAZARDOU WASTE PROGRAM Small Quantity Generators, between 100 kg and 1000 kg of hazardous waste/month (Resource Conservation and Recovery Act (tracking hazardous waste)) - notification Small Quantity Generators, between 100 kg and 1000 kg of hazardous waste/month (Resource Conservation and Recovery Act (tracking hazardous waste)) - notification Small Quantity Generators, between 100 kg and 1000 kg of hazardous waste/month (Resource Conservation and Recovery Act (tracking hazardous waste)) - notification Organizations: CHEVRON PRODUCTS CO (CONTACT/OWNER)
MONTEBELLO USD WASHINGTON ELEMENTARY (1400 W MADISON AVE in MONTEBELLO, CA)
(National Center for Education Statistics) - STATE ID-6020663 Small Quantity Generators, between 100 kg and 1000 kg of hazardous waste/month (Resource Conservation and Recovery Act (tracking hazardous waste)) - notification Organizations: MONTEBELLO UNIFIED (SCHOOL DISTRICT)
MONTEBELLO USD SCHURR HIGH SCHL (820 WILCOX AVE in MONTEBELLO, CA)
(National Center for Education Statistics) - STATE ID-1930155 Small Quantity Generators, between 100 kg and 1000 kg of hazardous waste/month (Resource Conservation and Recovery Act (tracking hazardous waste)) - notification Organizations: MONTEBELLO UNIFIED (SCHOOL DISTRICT)
MONTEBELLO USD MONTEBELLO INTERMEDIATE (1600 WHITTIER BLVD in MONTEBELLO, CA)
(National Center for Education Statistics) - STATE ID-6058432 Small Quantity Generators, between 100 kg and 1000 kg of hazardous waste/month (Resource Conservation and Recovery Act (tracking hazardous waste)) - notification Organizations: MONTEBELLO UNIFIED (SCHOOL DISTRICT)
MONTEBELLO USD LA MERCED INTERMEDIATE SC (215 E AVENIDA DE LA MERCED in MONTEBELLO, CA)
(National Center for Education Statistics) - STATE ID-6085674 Small Quantity Generators, between 100 kg and 1000 kg of hazardous waste/month (Resource Conservation and Recovery Act (tracking hazardous waste)) - notification Organizations: MONTEBELLO UNIFIED (SCHOOL DISTRICT)
AERO WHEEL & BRAKE CORP (6900 W ACCO ST in MONTEBELLO, CA)
STATE MASTER (California - Hazardous Waste Tracking) - HAZARDOU WASTE PROGRAM Small Quantity Generators, between 100 kg and 1000 kg of hazardous waste/month (Resource Conservation and Recovery Act (tracking hazardous waste)) - notification TRI REPORTER (Tracking of toxic chemicals releasing facilities) Business SIC classification: TIRES AND INNER TUBES Organizations: AERO WHEEL AND BRAKE SERVICE (CONTACT/OPERATOR)
, MYRON Z CHLAVIN TRUST (CONTACT/OWNER)
Alternative names: AERO WHEEL & BRAKE SERVICE, JOE STEINMETZ
MONTEBELLO USD WILCOX ELEMENTARY SCHOOL (816 DONNA WAY in MONTEBELLO, CA)
(National Center for Education Statistics) - STATE ID-6020671 Small Quantity Generators, between 100 kg and 1000 kg of hazardous waste/month (Resource Conservation and Recovery Act (tracking hazardous waste)) - notification Organizations: MONTEBELLO UNIFIED (SCHOOL DISTRICT)
MONTEBELLO USD FREMONT ELEMENTARY SCHL (200 W MADISON in MONTEBELLO, CA)
(National Center for Education Statistics) - STATE ID-6020556 Small Quantity Generators, between 100 kg and 1000 kg of hazardous waste/month (Resource Conservation and Recovery Act (tracking hazardous waste)) - notification Organizations: MONTEBELLO UNIFIED (SCHOOL DISTRICT)
MONTEBELLO USD EASTMONT INTERMEDIATE SCL (400 N BRADSHAWE AVE in MONTEBELLO, CA)
(National Center for Education Statistics) - STATE ID-6058416 Small Quantity Generators, between 100 kg and 1000 kg of hazardous waste/month (Resource Conservation and Recovery Act (tracking hazardous waste)) - notification Organizations: MONTEBELLO UNIFIED (SCHOOL DISTRICT)
GREENWOOD ELEMENTARY (900 S. GREENWOOD AVE. in MONTEBELLO, CA)
(National Center for Education Statistics) - STATE ID-6020580 Small Quantity Generators, between 100 kg and 1000 kg of hazardous waste/month (Resource Conservation and Recovery Act (tracking hazardous waste)) - notification Organizations: MONTEBELLO USD (CONTACT/OWNER)
, MONTEBELLO UNIFIED (SCHOOL DISTRICT)
Alternative names: MONTEBELLO USD GREENWOOD ELEM SCHL
Housing units lacking complete plumbing facilities: 1.7% Housing units lacking complete kitchen facilities: 2.7%
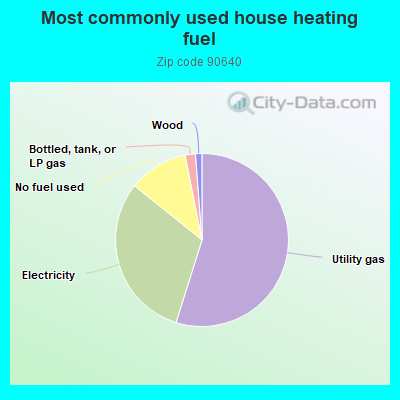
54.8%Utility gas
30.9%Electricity
11.1%No fuel used
1.9%Bottled, tank, or LP gas
1.2%Wood
Population in 1990: 59,068. Population change in the 1990s: +3,348 (+5.7%).
Place of birth for U.S.-born residents:
This state: 36,946
Northeast: 234
Midwest: 356
South: 564
West: 800
60% of the 90640 zip code residents lived in the same house 5 years ago. Out of people who lived in different houses, 91% lived in this county. Out of people who lived in different counties, 50% lived in California.
95% of the 90640 zip code residents lived in the same house 1 year ago. Out of people who lived in different houses, 83% moved from this county. Out of people who lived in different houses, 6% moved from different county within same state. Out of people who lived in different houses, 2% moved from different state. Out of people who lived in different houses, 12% moved from abroad.
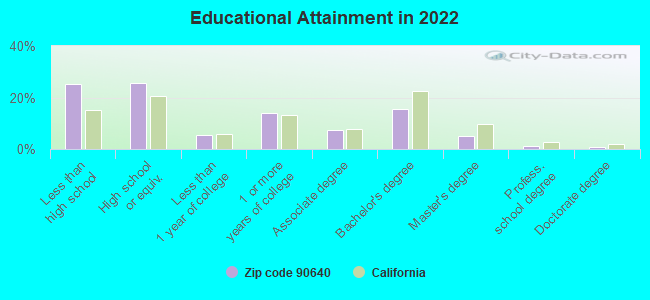
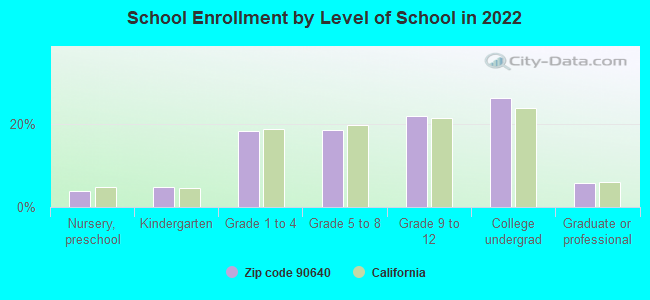
Private vs. public school enrollment:
Students in private schools in grades 1 to 8 (elementary and middle school): 217
Here:
3.9%
California:
10.5%
Students in private schools in grades 9 to 12 (high school): 208
Here:
6.2%
California:
8.5%
Students in private undergraduate colleges: 321
Here:
8.0%
California:
15.9%
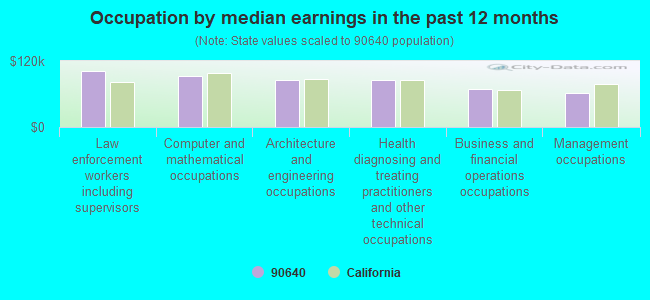
Occupation by median earnings in the past 12 months ($)
102,593Law enforcement workers including supervisors
93,555Computer and mathematical occupations
86,196Architecture and engineering occupations
86,131Health diagnosing and treating practitioners and other technical occupations
68,788Business and financial operations occupations
62,160Management occupations
Companies with biggest federal contracts located in this zip code (MONTEBELLO, CA):
CABRAL ROOFING CORPORATION (815 WEST OLYMPIC BOULEVARD; small business) : $10,931,512 in 125 contractsfrom 2000 to 2006
Contracts for Maintenance, Repair or Alteration of Real Property -- Family Housing Facilities, Maintenance, Repair or Alteration of Real Property -- Miscellaneous Buildings, Maintenance, Repair or Alteration of Real Property -- Ammunition Storage Buildings, Maintenance, Repair or Alteration of Real Property -- Other Administrative Facilities and Service Buildings, and moreby Navy, Department of Veterans Affairs, Air Force Signed by year:2000: $346,159; 2001: $2,885,707; 2002: $1,651,088; 2003: $3,449,725; 2004: $1,920,930; 2005: $350,549; 2006: $327,354.
Biggest contracts:
$1,190,915 with Navy for Maintenance, Repair or Alteration of Real Property -- Family Housing Facilities. Signed on 2001-06-22. Completion date: 2002-01-02.
$1,116,556, same as above.Signed on 2001-01-09. Completion date: 2001-07-30.
$804,898, same as above.Signed on 2003-06-11. Completion date: 2003-10-11.
$609,605 with Navy for Maintenance, Repair or Alteration of Real Property -- Miscellaneous Buildings. Signed on 2003-09-29. Completion date: 2003-12-31.
SERVICE MOTOR PARTS CO INC (1501 BEACH ST; small business) : $1,585,207 in 31 contractsfrom 2000 to 2005
Contracts for Diesel Engines and Components, Maintenance, Repair and Rebuilding of Equipment -- Engines, Turbines, and Components, Valves, Nonpowered by Navy, Defense Logistics Agency Signed by year:2000: $341,310; 2001: $183,760; 2002: $513,466; 2003: $307,854; 2004: $167,767; 2005: $71,050; 2006: $0.
Biggest contracts:
$146,202 with Navy for Diesel Engines and Components. Signed on 2002-11-25. Completion date: 2002-12-27.
$112,918, same as above.Signed on 2003-03-27. Completion date: 2003-03-31.
$71,050 with Navy for Maintenance, Repair and Rebuilding of Equipment -- Engines, Turbines, and Components. Signed on 2005-09-21. Completion date: 2005-11-22.
$70,000 with Navy for Diesel Engines and Components. Signed on 2000-04-21. Completion date: 2000-06-30.
DESSER TIRE & RUBBER CO INC (6900 W ACCO ST; small business) : $674,162 in 9 contractsfrom 1999 to 2006
Contracts for Tires and Tubes, Pneumatic, Aircraft by Air Force, Defense Logistics Agency, Army Signed by year:2000: $81,636; 2001: $0; 2002: $0; 2003: $203,324; 2004: $25,172; 2005: $37,764; 2006: $292,416.
Biggest contracts:
$181,000 with Air Force for Tires and Tubes, Pneumatic, Aircraft. Signed on 2006-04-27. Completion date: 2006-11-30.
$156,304, same as above.Signed on 2003-03-25. Completion date: 2003-11-28.
$111,416, same as above.Signed on 2006-05-04. Completion date: 2006-10-31.
$47,020, same as above.Signed on 2003-12-08. Completion date: 2004-12-31.
MONTIBELLO PLAZA HOTEL (7709 TELEGRAPH RD; small business) : $171,864 in 19 contractsfrom 2002 to 2004
Contracts for Food Services, Lodging - Hotel/Motel by Army Signed by year:2000: $0; 2001: $0; 2002: $46,532; 2003: $67,936; 2004: $57,396; 2005: $0; 2006: $0.
Biggest contracts:
$27,700 with Army for Food Services. Signed on 2002-12-30. Completion date: 2002-12-08.
$26,013 with Army for Lodging - Hotel/Motel. Signed on 2004-02-14. Completion date: 2004-01-26.
$14,750 with Army for Food Services. Signed on 2003-01-03. Completion date: 2002-12-08.
$11,648 with Army for Lodging - Hotel/Motel. Signed on 2002-12-06. Completion date: 2002-12-08.
GROVER SMITH MFG CORP (620 SOUTH VAIL AVENUE; small business) : $133,435 in 4 contractsfrom 2001 to 2005
$61,196 with Navy for Miscellaneous Maintenance and Repair Shop Specialized Equipment. Signed on 2005-03-04. Completion date: 2006-05-30.
$33,000 with Federal Supply Service for Hand Tools, Power Driven. Signed on 2001-04-15. Completion date: 2001-06-15.
$27,000, same as above.Signed on 2001-04-15. Completion date: 2001-06-15.
$12,239 with Navy for Miscellaneous Maintenance and Repair Shop Specialized Equipment. Signed on 2005-05-04. Completion date: 2006-12-30.
DOW-ELCO INC (1313 W OLYMPIC BLVD; small business) : $113,467 in 10 contractsfrom 2002 to 2006
Contracts for Automatic Pilot Mechanisms and Airborne Gyro Components, Hardware, Weapon System, Hardware, Commercial, Specialized Shipping and Storage Containers, and moreby Navy, Army Signed by year:2000: $0; 2001: $0; 2002: $37,105; 2003: $0; 2004: $67,501; 2005: $6,200; 2006: $2,661.
Biggest contracts:
$37,105 with Navy for Automatic Pilot Mechanisms and Airborne Gyro Components. Signed on 2002-09-30. Completion date: 2002-12-20.
$24,350 with Army for Hardware, Weapon System. Signed on 2004-10-29. Completion date: 2005-02-07.
$23,549 with Navy for Hardware, Commercial. Signed on 2004-12-06. Completion date: 2005-04-05.
$8,440 with Army for Specialized Shipping and Storage Containers. Signed on 2004-05-28. Completion date: 2004-08-06.
PENSKE TRUCK LEASING CO, LP (1500 S GREENWOOD) : $76,800 in 4 contractsfrom 2004 to 2005
$20,400 with Army for Miscellaneous Construction Equipment. Signed on 2005-04-11. Completion date: 2006-03-31.
$20,400 with U.S. Army Corps of Engineers - civil program financing only for Miscellaneous Construction Equipment. Signed on 2005-04-11. Completion date: 2006-03-31.
$18,000 with Army for Trucks and Truck Tractors, Wheeled. Signed on 2004-03-05. Completion date: 2005-03-04.
$18,000 with U.S. Army Corps of Engineers - civil program financing only for Trucks and Truck Tractors, Wheeled. Signed on 2004-03-05. Completion date: 2005-03-04.
A A A ELECTRICAL SUPPLY INC (1014 S MONTEBELLO BLVD; small business) : $54,790 in 4 contractsfrom 2003 to 2005
$41,899 with Navy for Electrical Hardware and Supplies. Signed on 2005-09-29. Completion date: 2005-10-25.
$10,817, same as above.Signed on 2005-09-30. Completion date: 2005-10-25.
$5,821 with U.S. Army Corps of Engineers - civil program financing only for Cable, Cord, and Wire Assemblies: Communications Equipment. Taking place in OR. Signed on 2003-02-18. Completion date: 2003-03-17.
-$3,747, same as above.Signed on 2003-03-24. Completion date: 2003-03-17.
KLING & SONS ENTERPRISES INC (623 SOUTH MAPLE AVENUE; small business) : $27,000 in 2 contractsin 2000
$27,000 with Army for Maintenance, Repair and Rebuilding of Equipment -- Chemicals and Chemical Products. Signed on 2000-12-12. Completion date: 2002-06-30.
$0, same as above.Signed on 2000-12-12. Completion date: 2002-06-30.
CAL CUMMINS PACIFIC INC (1105 S GREENWOOD AVE; small business) : $12,840 in 2 contractsfrom 2002 to 2003
$6,420 with Navy for Maintenance, Repair or Alteration of Real Property -- Office Buildings. Taking place in TX. Signed on 2003-09-04. Completion date: 2004-09-05.
$6,420, same as above.Signed on 2002-09-05. Completion date: 2007-09-05.
Top industries in this zip code by the number of employees in 2005:
2005 - 2018 National Fire Incident Reporting System (NFIRS) incidents
According to the data from the years 2005 - 2018 the average number of fires per year is 35. The highest number of fire incidents - 188 took place in 2007, and the least - 3 in 2008. The data has a declining trend.
When looking into fire subcategories, the most reports belonged to: Outside Fires (39.2%), and Structure Fires (32.8%).
Fire incident types reported to NFIRS in Zip Code 90640

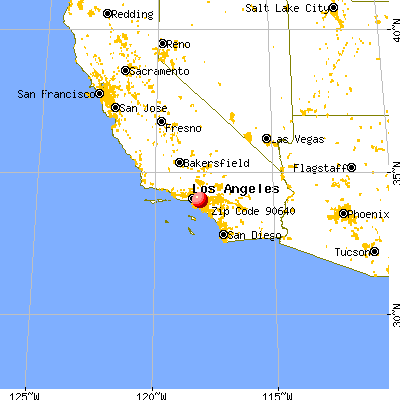


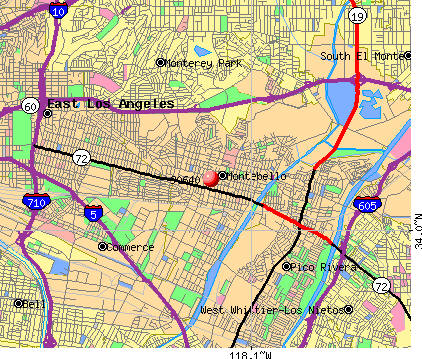 Nearest zip codes: 90660, 91755, 90040, 90022, 91754, 91770.


 According to the data from the years 2005 - 2018 the average number of fires per year is 35. The highest number of fire incidents - 188 took place in 2007, and the least - 3 in 2008. The data has a declining trend.
 When looking into fire subcategories, the most reports belonged to: Outside Fires (39.2%), and Structure Fires (32.8%).