Estimated zip code population in 2022: 33,655 Zip code population in 2010: 32,742 Zip code population in 2000: 33,263
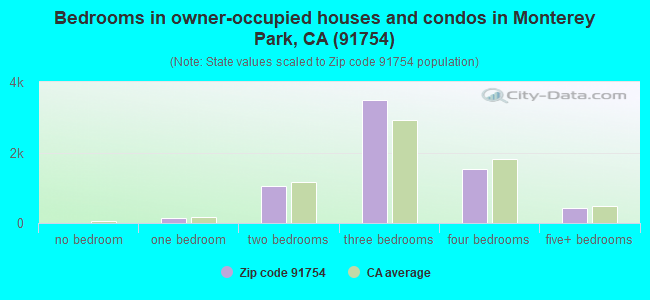
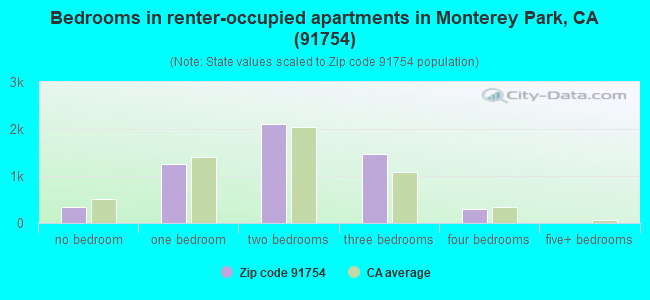
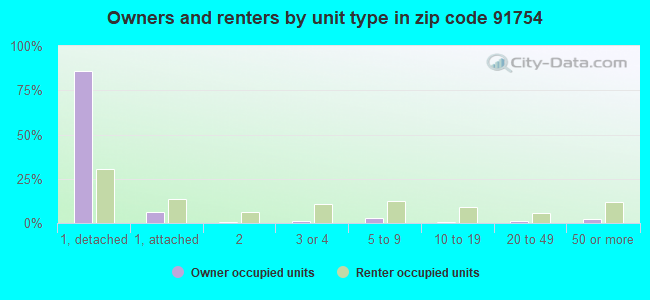
Houses and condos: 12,816 Renter-occupied apartments: 5,493
% of renters here:
45%
State:
44%
March 2022 cost of living index in zip code 91754: 137.5 (high, U.S. average is 100)
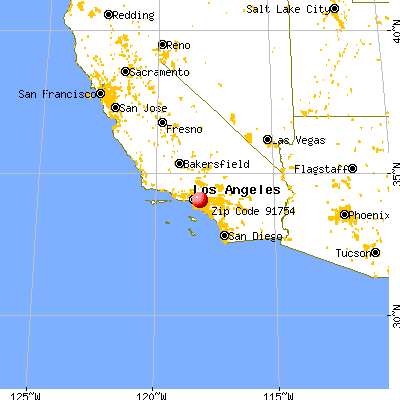
Land area: 4.5 sq. mi. Water area: 0.0 sq. mi.
Population density: 7,425 people per square mile
(high).
OSM Map
General Map
Google Map
MSN Map
OSM Map
General Map
Google Map
MSN Map
OSM Map
General Map
Google Map
MSN Map
OSM Map
General Map
Google Map
MSN Map
Please wait while loading the map...
Real estate property taxes paid for housing units in 2022:
This zip code:
0.7% ($5,727)
California:
0.7% ($4,831)
Median real estate property taxes paid for housing units with mortgages in 2022: $6,812 (0.7%) Median real estate property taxes paid for housing units with no mortgage in 2022: $4,179 (0.5%)
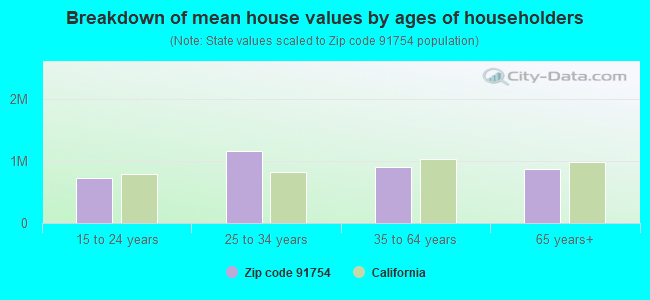
Estimated median house/condo value in 2022: $878,017
91754:
$878,017
California:
$715,900
According to our research of California and other state lists, there were 20 registered sex offenders living in 91754 zip code as of April 27, 2024. The ratio of all residents to sex offenders in zip code 91754 is 1,700 to 1. The ratio of registered sex offenders to all residents in this zip code is lower than the state average.
Median resident age:
This zip code:
44.9 years
California median age:
37.9 years
Average household size:
This zip code:
2.8 people
California:
2.8 people
Averages for the 2020 tax year for zip code 91754, filed in 2021:
Average Adjusted Gross Income (AGI) in 2020: $63,174 (Individual Income Tax Returns)
Here:
$63,174
State:
$95,910
Salary/wage: $55,345 (reported on 70.4% of returns)
Here:
$55,345
State:
$77,331
(% of AGI for various income ranges: 1010.1% for AGIs below $25k, 3828.5% for AGIs $25k-50k, 7705.5% for AGIs $50k-75k, 11137.9% for AGIs $75k-100k, 20111.7% for AGIs $100k-200k, 82016.2% for AGIs over 200k)
Taxable interest for individuals: $2,971 (reported on 34.7% of returns)
This zip code:
$2,971
California:
$2,294
(% of AGI for various income ranges: 35.6% for AGIs below $25k, 52.6% for AGIs $25k-50k, 87.4% for AGIs $50k-75k, 186.1% for AGIs $75k-100k, 334.6% for AGIs $100k-200k, 4830.0% for AGIs over 200k)
Ordinary dividends: $7,292 (reported on 21.2% of returns)
Here:
$7,292
State:
$10,949
(% of AGI for various income ranges: 20.9% for AGIs below $25k, 47.5% for AGIs $25k-50k, 97.9% for AGIs $50k-75k, 197.2% for AGIs $75k-100k, 663.2% for AGIs $100k-200k, 8055.7% for AGIs over 200k)
Net capital gain/loss in AGI: +$16,679 (reported on 21.7% of returns)
Here:
+$16,679
State:
+$49,306
(% of AGI for various income ranges: 10.3% for AGIs below $25k, 70.5% for AGIs $25k-50k, 150.0% for AGIs $50k-75k, 342.0% for AGIs $75k-100k, 1037.6% for AGIs $100k-200k, 23776.7% for AGIs over 200k)
Profit/loss from business: +$9,655 (reported on 24.8% of returns)
Here:
+$9,655
State:
+$15,671
(% of AGI for various income ranges: 380.5% for AGIs below $25k, 355.5% for AGIs $25k-50k, 312.2% for AGIs $50k-75k, 315.2% for AGIs $75k-100k, 527.9% for AGIs $100k-200k, 3160.0% for AGIs over 200k)
Taxable individual retirement arrangement distribution: $18,712 (reported on 6.2% of returns)
91754:
$18,712
California:
$23,505
(% of AGI for various income ranges: 36.0% for AGIs below $25k, 62.7% for AGIs $25k-50k, 168.9% for AGIs $50k-75k, 232.6% for AGIs $75k-100k, 711.2% for AGIs $100k-200k, 3204.3% for AGIs over 200k)
Self-employed (Keogh) retirement plans: $24,786 (reported on 0.4% of returns)
91754:
$24,786
California:
$30,163
(% of AGI for various income ranges: 65.0% for AGIs $75k-100k, 578.6% for AGIs over 200k)
Total itemized deductions: $33,039 (reported on 10.7% of returns)
Here:
$33,039
State:
$39,517
(% of AGI for various income ranges: 53.4% for AGIs below $25k, 177.8% for AGIs $25k-50k, 452.1% for AGIs $50k-75k, 952.6% for AGIs $75k-100k, 2171.8% for AGIs $100k-200k, 10667.6% for AGIs over 200k)
Charity contributions: $6,585 (reported on 8.2% of returns)
Here:
$6,585
State:
$12,598
(% of AGI for various income ranges: 2.3% for AGIs below $25k, 14.5% for AGIs $25k-50k, 41.3% for AGIs $50k-75k, 135.2% for AGIs $75k-100k, 334.1% for AGIs $100k-200k, 2132.4% for AGIs over 200k)
Taxes paid: $8,805 (reported on 10.6% of returns)
91754:
$8,805
State:
$8,807
(% of AGI for various income ranges: 13.6% for AGIs below $25k, 44.4% for AGIs $25k-50k, 135.8% for AGIs $50k-75k, 302.8% for AGIs $75k-100k, 666.7% for AGIs $100k-200k, 2082.9% for AGIs over 200k)
Earned income credit: $1,497 (reported on 19.5% of returns)
Here:
$1,497
State:
$2,074
(% of AGI for various income ranges: 80.5% for AGIs below $25k, 76.2% for AGIs $25k-50k, 0.9% for AGIs $50k-75k)
Percentage of individuals using paid preparers for their 2020 taxes: 90.3%
Here:
90%
State:
92%
(% for various income ranges: 89.2% for AGIs below $25k, 91.3% for AGIs $25k-50k, 91.7% for AGIs $50k-75k, 90.6% for AGIs $75k-100k, 90.5% for AGIs $100k-200k, 89.6% for AGIs over 200k)
Averages for the 2012 tax year for zip code 91754, filed in 2013:
Average Adjusted Gross Income (AGI) in 2012: $51,027 (Individual Income Tax Returns)
Here:
$51,027
State:
$72,726
Salary/wage: $44,828 (reported on 74.4% of returns)
Here:
$44,828
State:
$59,079
(% of AGI for various income ranges: 66.1% for AGIs below $25k, 80.5% for AGIs $25k-50k, 76.8% for AGIs $50k-75k, 71.1% for AGIs $75k-100k, 70.8% for AGIs $100k-200k, 36.9% for AGIs over 200k)
Taxable interest for individuals: $1,711 (reported on 38.0% of returns)
This zip code:
$1,711
California:
$2,146
(% of AGI for various income ranges: 1.5% for AGIs below $25k, 0.9% for AGIs $25k-50k, 0.9% for AGIs $50k-75k, 1.2% for AGIs $75k-100k, 1.1% for AGIs $100k-200k, 1.9% for AGIs over 200k)
Ordinary dividends: $5,726 (reported on 19.7% of returns)
Here:
$5,726
State:
$9,308
(% of AGI for various income ranges: 1.2% for AGIs below $25k, 0.8% for AGIs $25k-50k, 1.1% for AGIs $50k-75k, 2.2% for AGIs $75k-100k, 2.1% for AGIs $100k-200k, 4.5% for AGIs over 200k)
Net capital gain/loss in AGI: +$8,471 (reported on 17.0% of returns)
Here:
+$8,471
State:
+$30,460
(% of AGI for various income ranges: 0.4% for AGIs $75k-100k, 1.2% for AGIs $100k-200k, 11.9% for AGIs over 200k)
Profit/loss from business: +$11,391 (reported on 22.4% of returns)
Here:
+$11,391
State:
+$17,064
(% of AGI for various income ranges: 20.6% for AGIs below $25k, 5.5% for AGIs $25k-50k, 2.6% for AGIs $50k-75k, 2.1% for AGIs $75k-100k, 2.1% for AGIs $100k-200k, 3.6% for AGIs over 200k)
Taxable individual retirement arrangement distribution: $14,406 (reported on 7.8% of returns)
91754:
$14,406
California:
$19,557
(% of AGI for various income ranges: 2.1% for AGIs below $25k, 1.7% for AGIs $25k-50k, 2.2% for AGIs $50k-75k, 2.6% for AGIs $75k-100k, 2.7% for AGIs $100k-200k, 1.9% for AGIs over 200k)
Self-employment retirement plans: $29,043 (reported on 0.4% of returns)
91754:
$29,043
California:
$24,530
Total itemized deductions: $27,628 (25% of AGI, reported on 28.7% of returns)
Here:
$27,628
State:
$34,004
Here:
24.8% of AGI
State:
22.7% of AGI
(% of AGI for various income ranges: 7.9% for AGIs below $25k, 11.2% for AGIs $25k-50k, 14.3% for AGIs $50k-75k, 16.5% for AGIs $75k-100k, 18.8% for AGIs $100k-200k, 18.8% for AGIs over 200k)
Charity contributions: $4,303 (reported on 22.6% of returns)
Here:
$4,303
State:
$4,659
(% of AGI for various income ranges: 0.3% for AGIs below $25k, 0.9% for AGIs $25k-50k, 1.3% for AGIs $50k-75k, 1.6% for AGIs $75k-100k, 1.9% for AGIs $100k-200k, 3.9% for AGIs over 200k)
Taxes paid: $10,767 (reported on 28.7% of returns)
91754:
$10,767
State:
$14,448
(% of AGI for various income ranges: 2.0% for AGIs below $25k, 2.9% for AGIs $25k-50k, 4.5% for AGIs $50k-75k, 6.2% for AGIs $75k-100k, 8.2% for AGIs $100k-200k, 8.7% for AGIs over 200k)
Earned income credit: $1,586 (reported on 26.5% of returns)
Here:
$1,586
State:
$2,286
(% of AGI for various income ranges: 6.2% for AGIs below $25k, 1.0% for AGIs $25k-50k)
Percentage of individuals using paid preparers for their 2012 taxes: 68.7%
Here:
69%
State:
64%
(% for various income ranges: 67.7% for AGIs below $25k, 70.1% for AGIs $25k-50k, 67.3% for AGIs $50k-75k, 67.8% for AGIs $75k-100k, 70.8% for AGIs $100k-200k, 77.3% for AGIs over 200k)
Averages for the 2004 tax year for zip code 91754, filed in 2005:
Average Adjusted Gross Income (AGI) in 2004: $43,247 (Individual Income Tax Returns)
Here:
$43,247
State:
$58,600
Salary/wage: $38,217 (reported on 77.8% of returns)
Here:
$38,217
State:
$49,455
(% of AGI for various income ranges: 225.7% for AGIs below $10k, 73.4% for AGIs $10k-25k, 83.4% for AGIs $25k-50k, 76.0% for AGIs $50k-75k, 72.1% for AGIs $75k-100k, 51.3% for AGIs over 100k)
Taxable interest for individuals: $1,925 (reported on 51.5% of returns)
This zip code:
$1,925
California:
$2,365
(% of AGI for various income ranges: 16.1% for AGIs below $10k, 2.7% for AGIs $10k-25k, 1.6% for AGIs $25k-50k, 2.0% for AGIs $50k-75k, 2.1% for AGIs $75k-100k, 2.4% for AGIs over 100k)
Taxable dividends: $3,464 (reported on 23.3% of returns)
Here:
$3,464
State:
$4,746
(% of AGI for various income ranges: 6.6% for AGIs below $10k, 1.2% for AGIs $10k-25k, 1.0% for AGIs $25k-50k, 1.1% for AGIs $50k-75k, 1.8% for AGIs $75k-100k, 2.8% for AGIs over 100k)
Net capital gain/loss: +$9,367 (reported on 21.3% of returns)
Here:
+$9,367
State:
+$23,418
(% of AGI for various income ranges: -7.2% for AGIs below $10k, -0.1% for AGIs $10k-25k, 0.1% for AGIs $25k-50k, 0.4% for AGIs $50k-75k, 2.0% for AGIs $75k-100k, 11.5% for AGIs over 100k)
Profit/loss from business: +$11,234 (reported on 17.7% of returns)
Here:
+$11,234
State:
+$16,826
(% of AGI for various income ranges: 21.3% for AGIs below $10k, 10.3% for AGIs $10k-25k, 4.5% for AGIs $25k-50k, 2.8% for AGIs $50k-75k, 3.4% for AGIs $75k-100k, 4.0% for AGIs over 100k)
IRA payment deduction: $3,414 (reported on 5.3% of returns)
91754:
$3,414
California:
$3,192
(% of AGI for various income ranges: 0.9% for AGIs below $10k, 0.6% for AGIs $10k-25k, 0.8% for AGIs $25k-50k, 0.5% for AGIs $50k-75k, 0.4% for AGIs $75k-100k, 0.2% for AGIs over 100k)
Self-employed pension: $19,168 (reported on 0.8% of returns)
Here:
$19,168
California:
$17,688
(% of AGI for various income ranges: 0.1% for AGIs $10k-25k, 0.1% for AGIs $25k-50k, 0.1% for AGIs $50k-75k, 0.2% for AGIs $75k-100k, 0.7% for AGIs over 100k)
Total itemized deductions: $21,758 (25% of AGI, reported on 31.1% of returns)
Here:
$21,758
State:
$28,113
Here:
24.9% of AGI
State:
25.3% of AGI
(% of AGI for various income ranges: 25.2% for AGIs below $10k, 10.4% for AGIs $10k-25k, 13.0% for AGIs $25k-50k, 16.4% for AGIs $50k-75k, 19.2% for AGIs $75k-100k, 16.6% for AGIs over 100k)
Charity contributions deductions: $2,998 (3% of AGI, reported on 26.2% of returns)
Here:
$2,998
State:
$3,923
Here:
3.3% of AGI
State:
3.3% of AGI
(% of AGI for various income ranges: 0.8% for AGIs below $10k, 0.7% for AGIs $10k-25k, 1.3% for AGIs $25k-50k, 2.1% for AGIs $50k-75k, 2.3% for AGIs $75k-100k, 2.2% for AGIs over 100k)
Total tax: $7,064 (reported on 72.9% of returns)
91754:
$7,064
State:
$10,761
(% of AGI for various income ranges: 11.6% for AGIs below $10k, 4.2% for AGIs $10k-25k, 6.8% for AGIs $25k-50k, 9.6% for AGIs $50k-75k, 10.7% for AGIs $75k-100k, 18.2% for AGIs over 100k)
Earned income credit: $1,533 (reported on 20.0% of returns)
Here:
$1,533
State:
$1,763
Percentage of individuals using paid preparers for their 2004 taxes: 67.6%
Here:
68%
State:
66%
(% for various income ranges: 63.8% for AGIs below $10k, 70.6% for AGIs $10k-25k, 66.0% for AGIs $25k-50k, 68.4% for AGIs $50k-75k, 67.8% for AGIs $75k-100k, 71.6% for AGIs over 100k)
Likely homosexual households (counted as self-reported same-sex unmarried-partner households)
Lesbian couples: 0.1% of all households
Gay men: 0.1% of all households
Household received Food Stamps/SNAP in the past 12 months: 1,016 Household did not receive Food Stamps/SNAP in the past 12 months: 10,999
Women who had a birth in the past 12 months: 342 (214 now married, 128 unmarried) Women who did not have a birth in the past 12 months: 7,141 (2,700 now married, 4,446 unmarried)
Housing units in zip code 91754 with a mortgage: 3,273 (268 second mortgage, 236 both second mortgage and home equity loan) Houses without a mortgage: 24
Median monthly owner costs for units with a mortgage: $2,894 Median monthly owner costs for units without a mortgage: $691
Residents with income below the poverty level in 2022:
This zip code:
11.8%
Whole state:
12.2%
Residents with income below 50% of the poverty level in 2022:
This zip code:
6.2%
Whole state:
6.2%
Median number of rooms in houses and condos:
Here:
5.5
State:
6.0
Median number of rooms in apartments:
Here:
3.8
State:
3.9
Notable locations in this zip code not listed on our city pages
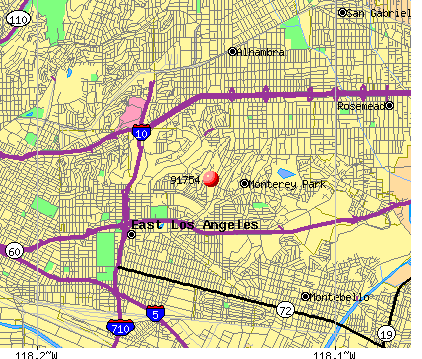
Notable locations in zip code 91754: Monterey Park Golf Course (A), Monterey Park City Hall (B), Bruggemeyer Memorial Library (C), City of Monterey Park Fire Department Station 63 (D), City of Monterey Park Fire Department Station 62 (E), City of Monterey Park Fire Department Station 61 Headquarters (F), Edison Center for the Performing Arts (G). Display/hide their locations on the map
Shopping Centers: Atlantic Square Shopping Center (1), Monterey Park Mall Shopping Center (2), Landmark Shopping Center (3). Display/hide their locations on the map
Churches in zip code 91754 include: Saint Thomas More Roman Catholic Church (A), Christ Lutheran Church (B), Faith Lutheran Church (C), Monterey Park Church of the Nazarene (D), Monterey Park United Methodist Church (E), Saint Pauls Lutheran Church (F), Saint Stephen Catholic Church (G), Saint Thomas Aquinas Church (H). Display/hide their locations on the map
Parks in zip code 91754 include: Weingart Stadium (1), Barnes Memorial Park (2), Highlands Park (3), Sunnyslopes Park (4), Bella Vista Park (5), Cascades Park (6), Langley Park (7), Pinetree Park (8), Sequoia Park (9). Display/hide their locations on the map
3,445 married couples with children.
1,524 single-parent households (444 men, 1,080 women).
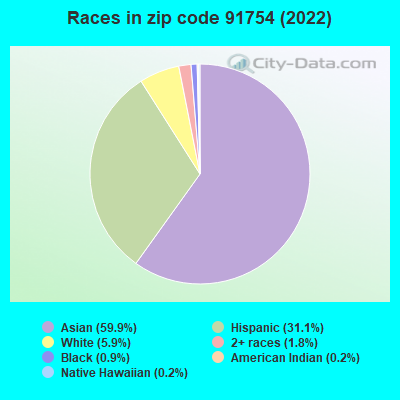
30.0% of residents of 91754 zip code speak English at home.
20.8% of residents speak Spanish at home (77% very well, 14% well, 7% not well, 1% not at all).
1.9% of residents speak other Indo-European language at home (96% very well, 4% well).
46.8% of residents speak Asian or Pacific Island language at home (36% very well, 24% well, 24% not well, 15% not at all).
1.1% of residents speak other language at home (97% very well, 3% not well).
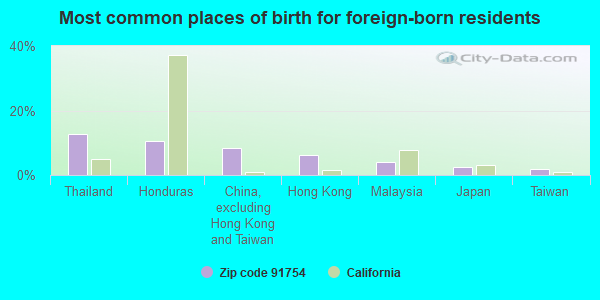
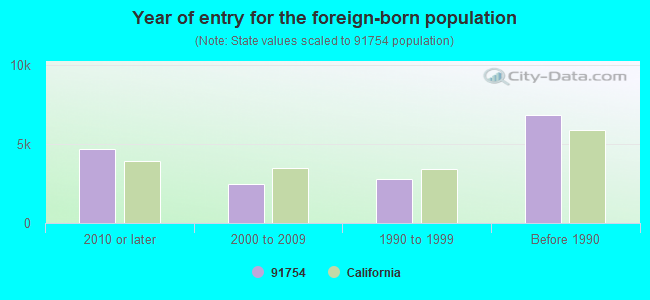
Foreign born population: 16,117 (47.9%) (68.7% of them are naturalized citizens)
Major facilities with environmental interests located in this zip code:
EAST LOS ANGELES COLLEGE (1301 AVINEDA CESAR CHAVEZ in MONTEREY PARK, CA)
AIR MAJOR (AIRS/AFS) STATE MASTER (California - Hazardous Waste Tracking) - HAZARDOU WASTE PROGRAM COMPLIANCE ACTIVITY (Tracking inspections of insecticide, fungicide, and rodenticide, and toxic substances) CRITERIA AND HAZARDOUS AIR POLLUTANT INVENTORY (Inventory of air pollution sources) Small Quantity Generators, between 100 kg and 1000 kg of hazardous waste/month (Resource Conservation and Recovery Act (tracking hazardous waste)) STATE MASTER (California - Used Oil Recycling System ) - USED OIL RECYCLING Business SIC classification: COLLEGES, UNIVERSITIES, AND PROFESSIONAL SCHOOLS; JUNIOR COLLEGES AND TECHNICAL INSTITUTES Business NAICS classification: OTHER SOCIAL ADVOCACY ORGANIZATIONS.
ARCHITECTURAL WOODWORKING CO (582 S MONTEREY PASS RD in MONTEREY PARK, CA)
AIR MAJOR (AIRS/AFS) STATE MASTER (California - Hazardous Waste Tracking) - HAZARDOU WASTE PROGRAM CRITERIA AND HAZARDOUS AIR POLLUTANT INVENTORY (Inventory of air pollution sources) Small Quantity Generators, between 100 kg and 1000 kg of hazardous waste/month (Resource Conservation and Recovery Act (tracking hazardous waste)) Business SIC classification: WOOD OFFICE FURNITURE; WOOD OFFICE AND STORE FIXTURES, PARTITIONS, SHELVING, AND LOCKERS Business NAICS classification: INSTITUTIONAL FURNITURE MANUFACTURING.
MANHOLE ADJUSTING CONTRACTORS INCORPORATED (2300 GREENWOOD AVE in MONTEREY PARK, CA)
STATE MASTER (California - Hazardous Waste Tracking) - HAZARDOU WASTE PROGRAM CRITERIA AND HAZARDOUS AIR POLLUTANT INVENTORY (Inventory of air pollution sources) TRANSPORTER (Resource Conservation and Recovery Act (tracking hazardous waste)) Business SIC classification: GRAY AND DUCTILE IRON FOUNDRIES Organizations: MANHOLE ADJUSTING INC (CONTACT/OWNER)
GETTY SYNTHETIC FUELS INC (900 POTRERO GRANDE in MONTEREY PARK, CA)
(Integrated Compliance Information System) - ICIS-09-1997-0012, FORMAL ENFORCEMENT ACTION, ICIS-09-1998-0171, ICIS-09-1999-0198, ICIS-09-2000-0196, ICIS-09-2001-0155, ICIS-09-1987-0009, ICIS-09-1989-0007, ICIS-09-1999-0134, ICIS-09-1997-0046, Small Quantity Generators, between 100 kg and 1000 kg of hazardous waste/month (Resource Conservation and Recovery Act (tracking hazardous waste)) Business SIC classification: REFUSE SYSTEMS
NICE ONE HOUR PHOTO (404 E S ATLANTIC BLVD in MONTEREY PARK, CA)
STATE MASTER (California - Hazardous Waste Tracking) - HAZARDOU WASTE PROGRAM Small Quantity Generators, between 100 kg and 1000 kg of hazardous waste/month (Resource Conservation and Recovery Act (tracking hazardous waste)) - notification Organizations: VEIN TRI TANG (CONTACT/OWNER)
MILLER L C CO (717 MONTEREY PASS RD in MONTEREY PARK, CA)
STATE MASTER (California - Hazardous Waste Tracking) - HAZARDOU WASTE PROGRAM Small Quantity Generators, between 100 kg and 1000 kg of hazardous waste/month (Resource Conservation and Recovery Act (tracking hazardous waste)) Business NAICS classification: OTHER COMMERCIAL AND SERVICE INDUSTRY MACHINERY MANUFACTURING.; INDUSTRIAL PROCESS FURNACE AND OVEN MANUFACTURING.
EQUILON ENTERPRISES (2291 S ATLANTIC CESAR CHAVEZ in MONTEREY PARK, CA) . Federal Facility
STATE MASTER (California - Hazardous Waste Tracking) - HAZARDOU WASTE PROGRAM Small Quantity Generators, between 100 kg and 1000 kg of hazardous waste/month (Resource Conservation and Recovery Act (tracking hazardous waste)) - notification Organizations: EQUILON ENTERPRISES L L C (CONTACT/OWNER)
Alternative names: SHELL SERVICE STATION
EQUILON ENTERPRISES (631 N GARFIELD in MONTEREY PARK, CA) . Federal Facility
STATE MASTER (California - Hazardous Waste Tracking) - HAZARDOU WASTE PROGRAM Small Quantity Generators, between 100 kg and 1000 kg of hazardous waste/month (Resource Conservation and Recovery Act (tracking hazardous waste)) - notification Organizations: EQUILON ENTERPRISES L L C (CONTACT/OWNER)
Alternative names: SHELL OIL CO
CHINESE DAILY NEWS (1588 CORPORATE CENTER DR in MONTEREY PARK, CA)
STATE MASTER (California - Hazardous Waste Tracking) - HAZARDOU WASTE PROGRAM Small Quantity Generators, between 100 kg and 1000 kg of hazardous waste/month (Resource Conservation and Recovery Act (tracking hazardous waste)) - notification Organizations: DAVID TANG (CONTACT/OWNER)
GOLDEN GLOBE FOODS CTR (573 MONTEREY PASS RD in MONTEREY PARK, CA)
(Integrated Compliance Information System) - ICIS-09-2001-0085, FORMAL ENFORCEMENT ACTION, ICIS-09-2001-0084, COMPLIANCE ACTIVITY (Tracking inspections of insecticide, fungicide, and rodenticide, and toxic substances) Business SIC classification: GROCERY STORES Alternative names: GOLDEN GLOBE FOOD CENTER, INC
CHEVRON STATION NO 93162 (2301 S ATLANTIC BLVD in MONTEREY PARK, CA)
STATE MASTER (California - Hazardous Waste Tracking) - HAZARDOU WASTE PROGRAM Small Quantity Generators, between 100 kg and 1000 kg of hazardous waste/month (Resource Conservation and Recovery Act (tracking hazardous waste)) - notification Organizations: CHEVRON PRODUCTS CO (CONTACT/OWNER)
CHEVRON STATION 91629 (780 W GARVEY AVE in MONTEREY PARK, CA)
STATE MASTER (California - Hazardous Waste Tracking) - HAZARDOU WASTE PROGRAM Small Quantity Generators, between 100 kg and 1000 kg of hazardous waste/month (Resource Conservation and Recovery Act (tracking hazardous waste)) - notification Organizations: CHEVRON PRODUCTS CO (CONTACT/OWNER)
CAMINO REAL CHEVROLET (2401 S ATLANTIC BLVD in MONTEREY PARK, CA)
STATE MASTER (California - Hazardous Waste Tracking) - HAZARDOU WASTE PROGRAM Small Quantity Generators, between 100 kg and 1000 kg of hazardous waste/month (Resource Conservation and Recovery Act (tracking hazardous waste))
Housing units lacking complete plumbing facilities: 0.2% Housing units lacking complete kitchen facilities: 2.9%
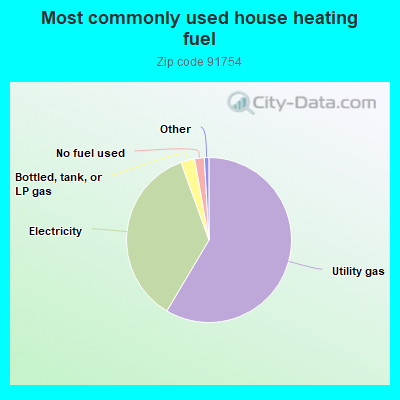
58.6%Utility gas
36.0%Electricity
2.7%Bottled, tank, or LP gas
1.9%No fuel used
Population in 1990: 62,133.
Place of birth for U.S.-born residents:
This state: 15,417
Northeast: 278
Midwest: 270
South: 539
West: 666
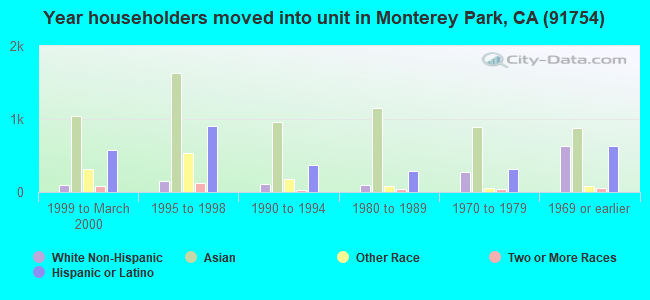
68% of the 91754 zip code residents lived in the same house 5 years ago. Out of people who lived in different houses, 85% lived in this county. Out of people who lived in different counties, 50% lived in California.
89% of the 91754 zip code residents lived in the same house 1 year ago. Out of people who lived in different houses, 71% moved from this county. Out of people who lived in different houses, 12% moved from different county within same state. Out of people who lived in different houses, 4% moved from different state. Out of people who lived in different houses, 12% moved from abroad.
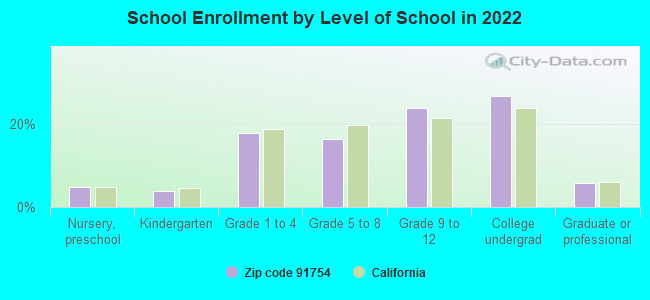
Private vs. public school enrollment:
Students in private schools in grades 1 to 8 (elementary and middle school): 225
Here:
9.7%
California:
10.5%
Students in private schools in grades 9 to 12 (high school): 53
Here:
3.3%
California:
8.5%
Students in private undergraduate colleges: 175
Here:
9.7%
California:
15.9%
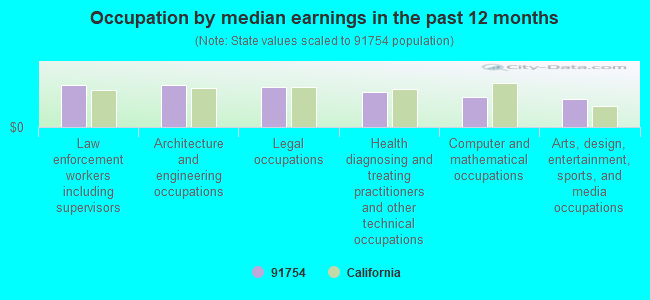
Occupation by median earnings in the past 12 months ($)
113,117Law enforcement workers including supervisors
112,371Architecture and engineering occupations
107,598Legal occupations
94,278Health diagnosing and treating practitioners and other technical occupations
81,238Computer and mathematical occupations
75,834Arts, design, entertainment, sports, and media occupations
Companies with federal contracts located in this zip code (MONTEREY PARK, CA):
CAL-WESTERN GASSEY DEVELOPMENT (701 S ATL BLVD STE 302; small business) 2 employees, $130000 revenue. : $841,135 in 58 contractsfrom 1999 to 2006
Contracts for Lease or Rental of Facilities -- Office Buildings by Public Buildings Service Signed by year:2000: $104,000; 2001: $104,000; 2002: $130,084; 2003: $244,041; 2004: $26,322; 2005: $115,458; 2006: $91,230.
Biggest contracts:
$26,207 with Public Buildings Service for Lease or Rental of Facilities -- Office Buildings. Signed on 2003-06-15. Completion date: 2003-06-15.
$26,207, same as above.Signed on 2003-09-15. Completion date: 2003-09-15.
$26,042, same as above.Signed on 2003-03-15. Completion date: 2003-03-15.
$26,042, same as above.Signed on 2003-09-15. Completion date: 2003-09-15.
AMERICAN REPROGRAPHICS CO, LLC (616 MONTEREY PASS ROAD) : $87,829 in 6 contractsfrom 2001 to 2005
Contracts for ADP Components, ADP Input/Output and Storage Devices, ADP Support Equipment, Maintenance, Repair and Rebuilding of Equipment -- Special Industry Machinery by Air Force, Army, U.S. Army Corps of Engineers - civil program financing only, Navy, and others Signed by year:2000: $0; 2001: $69,117; 2002: $0; 2003: $0; 2004: $0; 2005: $18,712; 2006: $0.
Biggest contracts:
$34,609 with Air Force for ADP Components. Signed on 2001-09-25. Completion date: 2001-08-14.
$34,508 with Army for ADP Input/Output and Storage Devices. Signed on 2001-08-09. Completion date: 2001-09-30.
$9,356 with Army for ADP Support Equipment. Signed on 2005-05-18. Completion date: 2005-06-17.
$9,356 with U.S. Army Corps of Engineers - civil program financing only for ADP Support Equipment. Signed on 2005-05-18. Completion date: 2005-06-17.
BLUE SKY INDUSTRIES INC (1230 MONTEREY PASS ROAD; small business) 50 employees, $0 revenue. : $30,889 in 12 contractsfrom 2003 to 2006
Contracts for Bolts, Rivets, Screws, Wire and Cable, Electrical, and moreby Army, Navy, Air Force Signed by year:2000: $0; 2001: $0; 2002: $0; 2003: $7,135; 2004: $610; 2005: $11,290; 2006: $11,854.
Biggest contracts:
$8,568 with Army for Bolts. Signed on 2006-02-04. Completion date: 2006-02-10.
$6,820 with Navy for Rivets. Signed on 2003-05-07. Completion date: 2003-06-27.
$3,954 with Air Force for Bolts. Signed on 2005-11-01. Completion date: 2005-11-15.
$3,822 with Air Force for Screws. Signed on 2005-10-18. Completion date: 2005-11-01.
AMERICAN RESEARCH CORPORATION (602 MONTEREY PASS ROAD; small business)
$14,555 with Army for Office Information System Equipment. Taking place in GA. Signed on 2002-06-06. Completion date: 2002-07-18.
S HOM (664 WEST GLEASON ST; small business)
$10,400 with Navy for Program Management/Support Services. Signed on 2005-05-18. Completion date: 2005-06-30.
LOS ANGELES COUNTY SHERIFFS DE (4700 RAMONA BL) : $3,402 in 2 contractsfrom 2003 to 2005
$2,930 with Army for Reserve Training (Military). Signed on 2003-05-16. Completion date: 2003-06-08.
$472 with Army for Armament Training Devices. Signed on 2005-03-03. Completion date: 2005-03-06.
Top industries in this zip code by the number of employees in 2005:
2005 - 2018 National Fire Incident Reporting System (NFIRS) incidents
According to the data from the years 2005 - 2018 the average number of fires per year is 45. The highest number of fires - 110 took place in 2007, and the least - 3 in 2013. The data has a decreasing trend.
When looking into fire subcategories, the most incidents belonged to: Structure Fires (47.6%), and Outside Fires (26.4%).
Fire incident types reported to NFIRS in Zip Code 91754


 Nearest zip codes: 91803, 91755, 90022, 91801, 90063, 90032.


 According to the data from the years 2005 - 2018 the average number of fires per year is 45. The highest number of fires - 110 took place in 2007, and the least - 3 in 2013. The data has a decreasing trend.
 When looking into fire subcategories, the most incidents belonged to: Structure Fires (47.6%), and Outside Fires (26.4%).