Estimated zip code population in 2022: 51,576 Zip code population in 2010: 55,758 Zip code population in 2000: 55,666
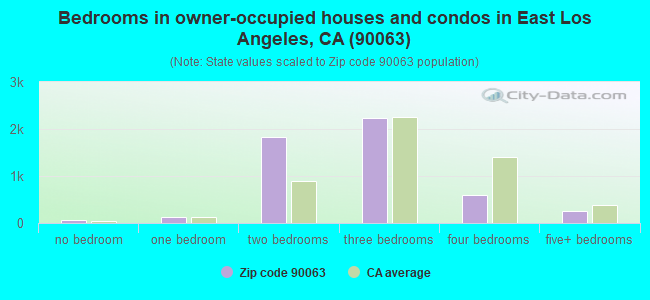
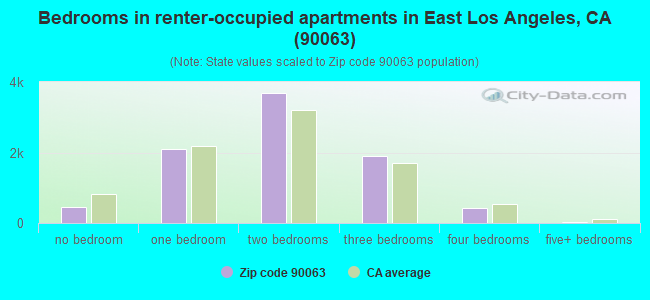
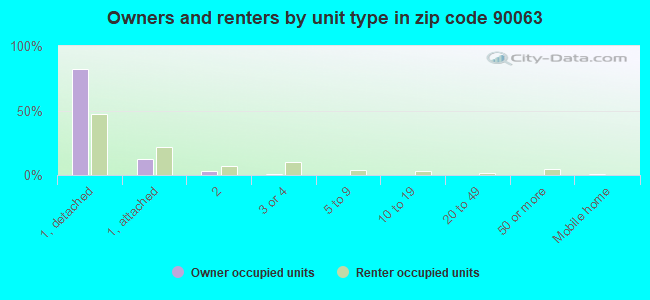
Houses and condos: 14,514 Renter-occupied apartments: 8,611
% of renters here:
63%
State:
44%
March 2022 cost of living index in zip code 90063: 134.3 (high, U.S. average is 100)
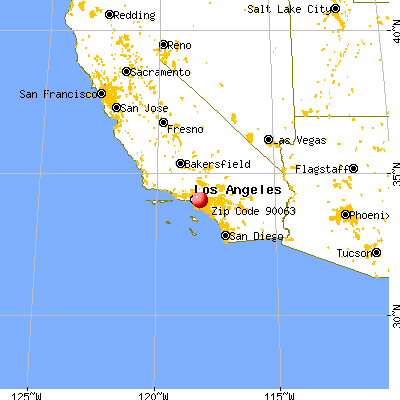
Land area: 3.3 sq. mi. Water area: 0.0 sq. mi.
Population density: 15,760 people per square mile
(very high).
OSM Map
General Map
Google Map
MSN Map
OSM Map
General Map
Google Map
MSN Map
OSM Map
General Map
Google Map
MSN Map
OSM Map
General Map
Google Map
MSN Map
Please wait while loading the map...
Real estate property taxes paid for housing units in 2022:
This zip code:
0.6% ($3,670)
California:
0.7% ($4,831)
Median real estate property taxes paid for housing units with mortgages in 2022: $4,004 (0.6%) Median real estate property taxes paid for housing units with no mortgage in 2022: $3,007 (0.5%)
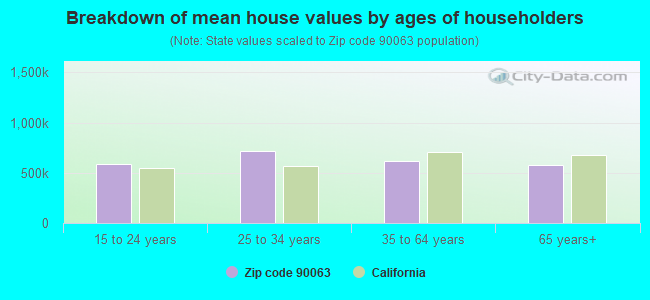
Estimated median house/condo value in 2022: $637,393
90063:
$637,393
California:
$715,900
According to our research of California and other state lists, there were 61 registered sex offenders living in 90063 zip code as of April 27, 2024. The ratio of all residents to sex offenders in zip code 90063 is 900 to 1. The ratio of registered sex offenders to all residents in this zip code is near the state average.
Median resident age:
This zip code:
33.9 years
California median age:
37.9 years
Average household size:
This zip code:
3.7 people
California:
2.8 people
Averages for the 2020 tax year for zip code 90063, filed in 2021:
Average Adjusted Gross Income (AGI) in 2020: $38,730 (Individual Income Tax Returns)
Here:
$38,730
State:
$95,910
Salary/wage: $37,533 (reported on 84.6% of returns)
Here:
$37,533
State:
$77,331
(% of AGI for various income ranges: 1280.0% for AGIs below $25k, 4131.4% for AGIs $25k-50k, 7559.1% for AGIs $50k-75k, 11245.2% for AGIs $75k-100k, 18429.8% for AGIs $100k-200k, 63746.7% for AGIs over 200k)
Taxable interest for individuals: $348 (reported on 15.6% of returns)
This zip code:
$348
California:
$2,294
(% of AGI for various income ranges: 3.2% for AGIs below $25k, 4.0% for AGIs $25k-50k, 9.5% for AGIs $50k-75k, 17.6% for AGIs $75k-100k, 42.3% for AGIs $100k-200k, 620.0% for AGIs over 200k)
Ordinary dividends: $8,495 (reported on 3.4% of returns)
Here:
$8,495
State:
$10,949
(% of AGI for various income ranges: 2.4% for AGIs below $25k, 2.8% for AGIs $25k-50k, 8.0% for AGIs $50k-75k, 9.2% for AGIs $75k-100k, 46.0% for AGIs $100k-200k, 19503.3% for AGIs over 200k)
Net capital gain/loss in AGI: +$3,332 (reported on 4.6% of returns)
Here:
+$3,332
State:
+$49,306
(% of AGI for various income ranges: 14.1% for AGIs $50k-75k, 18.1% for AGIs $75k-100k, 205.8% for AGIs $100k-200k, 6280.0% for AGIs over 200k)
Profit/loss from business: +$7,820 (reported on 18.7% of returns)
Here:
+$7,820
State:
+$15,671
(% of AGI for various income ranges: 276.5% for AGIs below $25k, 137.5% for AGIs $25k-50k, 159.6% for AGIs $50k-75k, 183.5% for AGIs $75k-100k, 463.3% for AGIs $100k-200k, 386.7% for AGIs over 200k)
Taxable individual retirement arrangement distribution: $10,604 (reported on 1.0% of returns)
90063:
$10,604
California:
$23,505
(% of AGI for various income ranges: 9.6% for AGIs below $25k, 6.5% for AGIs $25k-50k, 12.1% for AGIs $50k-75k, 25.6% for AGIs $75k-100k, 155.3% for AGIs $100k-200k)
Total itemized deductions: $25,245 (reported on 5.5% of returns)
Here:
$25,245
State:
$39,517
(% of AGI for various income ranges: 26.3% for AGIs below $25k, 95.7% for AGIs $25k-50k, 325.2% for AGIs $50k-75k, 816.0% for AGIs $75k-100k, 1366.3% for AGIs $100k-200k, 6083.3% for AGIs over 200k)
Charity contributions: $3,995 (reported on 4.3% of returns)
Here:
$3,995
State:
$12,598
(% of AGI for various income ranges: 1.8% for AGIs below $25k, 13.2% for AGIs $25k-50k, 37.2% for AGIs $50k-75k, 99.3% for AGIs $75k-100k, 164.0% for AGIs $100k-200k, 1146.7% for AGIs over 200k)
Taxes paid: $7,887 (reported on 5.4% of returns)
90063:
$7,887
State:
$8,807
(% of AGI for various income ranges: 6.7% for AGIs below $25k, 25.9% for AGIs $25k-50k, 99.7% for AGIs $50k-75k, 260.2% for AGIs $75k-100k, 470.5% for AGIs $100k-200k, 1606.7% for AGIs over 200k)
Earned income credit: $2,287 (reported on 23.6% of returns)
Here:
$2,287
State:
$2,074
(% of AGI for various income ranges: 122.7% for AGIs below $25k, 79.0% for AGIs $25k-50k, 1.1% for AGIs $50k-75k)
Percentage of individuals using paid preparers for their 2020 taxes: 91.0%
Here:
91%
State:
92%
(% for various income ranges: 88.7% for AGIs below $25k, 92.1% for AGIs $25k-50k, 92.7% for AGIs $50k-75k, 92.5% for AGIs $75k-100k, 95.0% for AGIs $100k-200k, 100.0% for AGIs over 200k)
Averages for the 2012 tax year for zip code 90063, filed in 2013:
Average Adjusted Gross Income (AGI) in 2012: $27,651 (Individual Income Tax Returns)
Here:
$27,651
State:
$72,726
Salary/wage: $27,839 (reported on 86.8% of returns)
Here:
$27,839
State:
$59,079
(% of AGI for various income ranges: 79.7% for AGIs below $25k, 91.7% for AGIs $25k-50k, 91.3% for AGIs $50k-75k, 90.7% for AGIs $75k-100k, 79.8% for AGIs $100k-200k)
Taxable interest for individuals: $261 (reported on 13.4% of returns)
This zip code:
$261
California:
$2,146
(% of AGI for various income ranges: 0.2% for AGIs below $25k, 0.1% for AGIs $50k-75k, 0.1% for AGIs $75k-100k, 0.3% for AGIs $100k-200k)
Ordinary dividends: $5,766 (reported on 1.7% of returns)
Here:
$5,766
State:
$9,308
(% of AGI for various income ranges: 5.1% for AGIs $100k-200k)
Net capital gain/loss in AGI: +$3 (reported on 1.5% of returns)
Here:
+$3
State:
+$30,460
(% of AGI for various income ranges: 0.2% for AGIs $100k-200k)
Profit/loss from business: +$9,368 (reported on 15.9% of returns)
Here:
+$9,368
State:
+$17,064
(% of AGI for various income ranges: 13.0% for AGIs below $25k, 3.0% for AGIs $25k-50k, 1.8% for AGIs $50k-75k, 1.2% for AGIs $75k-100k, 1.6% for AGIs $100k-200k)
Taxable individual retirement arrangement distribution: $10,369 (reported on 1.4% of returns)
90063:
$10,369
California:
$19,557
(% of AGI for various income ranges: 0.5% for AGIs below $25k, 0.3% for AGIs $25k-50k, 0.6% for AGIs $50k-75k, 1.9% for AGIs $75k-100k)
Total itemized deductions: $18,233 (35% of AGI, reported on 15.4% of returns)
Here:
$18,233
State:
$34,004
Here:
35.0% of AGI
State:
22.7% of AGI
(% of AGI for various income ranges: 4.1% for AGIs below $25k, 9.4% for AGIs $25k-50k, 14.7% for AGIs $50k-75k, 16.7% for AGIs $75k-100k, 20.0% for AGIs $100k-200k)
Charity contributions: $1,926 (reported on 11.3% of returns)
Here:
$1,926
State:
$4,659
(% of AGI for various income ranges: 0.2% for AGIs below $25k, 0.7% for AGIs $25k-50k, 1.1% for AGIs $50k-75k, 1.3% for AGIs $75k-100k, 2.7% for AGIs $100k-200k)
Taxes paid: $4,815 (reported on 15.2% of returns)
90063:
$4,815
State:
$14,448
(% of AGI for various income ranges: 0.9% for AGIs below $25k, 2.2% for AGIs $25k-50k, 3.9% for AGIs $50k-75k, 5.3% for AGIs $75k-100k, 6.4% for AGIs $100k-200k)
Earned income credit: $2,623 (reported on 33.7% of returns)
Here:
$2,623
State:
$2,286
(% of AGI for various income ranges: 8.8% for AGIs below $25k, 1.8% for AGIs $25k-50k)
Percentage of individuals using paid preparers for their 2012 taxes: 80.2%
Here:
80%
State:
64%
(% for various income ranges: 79.3% for AGIs below $25k, 81.8% for AGIs $25k-50k, 81.4% for AGIs $50k-75k, 78.9% for AGIs $75k-100k, 75.0% for AGIs $100k-200k)
Averages for the 2004 tax year for zip code 90063, filed in 2005:
Average Adjusted Gross Income (AGI) in 2004: $25,236 (Individual Income Tax Returns)
Here:
$25,236
State:
$58,600
Salary/wage: $24,974 (reported on 89.3% of returns)
Here:
$24,974
State:
$49,455
(% of AGI for various income ranges: 78.7% for AGIs below $10k, 87.5% for AGIs $10k-25k, 94.3% for AGIs $25k-50k, 93.9% for AGIs $50k-75k, 91.9% for AGIs $75k-100k, 32.5% for AGIs over 100k)
Taxable interest for individuals: $455 (reported on 18.6% of returns)
This zip code:
$455
California:
$2,365
(% of AGI for various income ranges: 0.7% for AGIs below $10k, 0.3% for AGIs $10k-25k, 0.3% for AGIs $25k-50k, 0.3% for AGIs $50k-75k, 0.3% for AGIs $75k-100k, 1.1% for AGIs over 100k)
Taxable dividends: $2,043 (reported on 2.6% of returns)
Here:
$2,043
State:
$4,746
(% of AGI for various income ranges: 0.3% for AGIs below $10k, 0.1% for AGIs $10k-25k, 0.1% for AGIs $25k-50k, 0.0% for AGIs $50k-75k, 0.1% for AGIs $75k-100k, 2.9% for AGIs over 100k)
Net capital gain/loss: +$14,097 (reported on 2.0% of returns)
Here:
+$14,097
State:
+$23,418
(% of AGI for various income ranges: -0.1% for AGIs below $10k, 0.0% for AGIs $10k-25k, 0.1% for AGIs $25k-50k, 0.3% for AGIs $50k-75k, 2.0% for AGIs $75k-100k, 18.0% for AGIs over 100k)
Profit/loss from business: +$8,212 (reported on 12.7% of returns)
Here:
+$8,212
State:
+$16,826
(% of AGI for various income ranges: 17.2% for AGIs below $10k, 7.2% for AGIs $10k-25k, 2.6% for AGIs $25k-50k, 1.0% for AGIs $50k-75k, 2.3% for AGIs $75k-100k, 0.5% for AGIs over 100k)
IRA payment deduction: $2,009 (reported on 0.6% of returns)
90063:
$2,009
California:
$3,192
Total itemized deductions: $16,105 (35% of AGI, reported on 18.1% of returns)
Here:
$16,105
State:
$28,113
Here:
35.3% of AGI
State:
25.3% of AGI
(% of AGI for various income ranges: 5.6% for AGIs below $10k, 6.3% for AGIs $10k-25k, 12.3% for AGIs $25k-50k, 16.8% for AGIs $50k-75k, 17.6% for AGIs $75k-100k, 16.5% for AGIs over 100k)
Charity contributions deductions: $1,859 (4% of AGI, reported on 14.8% of returns)
Here:
$1,859
State:
$3,923
Here:
4.0% of AGI
State:
3.3% of AGI
(% of AGI for various income ranges: 0.2% for AGIs below $10k, 0.4% for AGIs $10k-25k, 1.1% for AGIs $25k-50k, 1.8% for AGIs $50k-75k, 1.8% for AGIs $75k-100k, 2.0% for AGIs over 100k)
Total tax: $2,354 (reported on 54.5% of returns)
90063:
$2,354
State:
$10,761
(% of AGI for various income ranges: 3.2% for AGIs below $10k, 2.7% for AGIs $10k-25k, 4.3% for AGIs $25k-50k, 6.6% for AGIs $50k-75k, 9.2% for AGIs $75k-100k, 17.1% for AGIs over 100k)
Earned income credit: $2,050 (reported on 35.5% of returns)
Here:
$2,050
State:
$1,763
Percentage of individuals using paid preparers for their 2004 taxes: 81.8%
Here:
82%
State:
66%
(% for various income ranges: 78.5% for AGIs below $10k, 83.4% for AGIs $10k-25k, 81.9% for AGIs $25k-50k, 82.5% for AGIs $50k-75k, 79.4% for AGIs $75k-100k, 77.4% for AGIs over 100k)
Likely homosexual households (counted as self-reported same-sex unmarried-partner households)
Lesbian couples: 0.0% of all households
Gay men: 0.0% of all households
Household received Food Stamps/SNAP in the past 12 months: 2,595 Household did not receive Food Stamps/SNAP in the past 12 months: 11,351
Women who had a birth in the past 12 months: 447 (173 now married, 277 unmarried) Women who did not have a birth in the past 12 months: 13,226 (4,156 now married, 9,116 unmarried)
Housing units in zip code 90063 with a mortgage: 3,109 (222 second mortgage, 38 home equity loan, 90 both second mortgage and home equity loan) Houses without a mortgage: 81
Median monthly owner costs for units with a mortgage: $2,145 Median monthly owner costs for units without a mortgage: $527
Residents with income below the poverty level in 2022:
This zip code:
16.4%
Whole state:
12.2%
Residents with income below 50% of the poverty level in 2022:
This zip code:
8.5%
Whole state:
6.2%
Median number of rooms in houses and condos:
Here:
5.3
State:
6.0
Median number of rooms in apartments:
Here:
4.2
State:
3.9
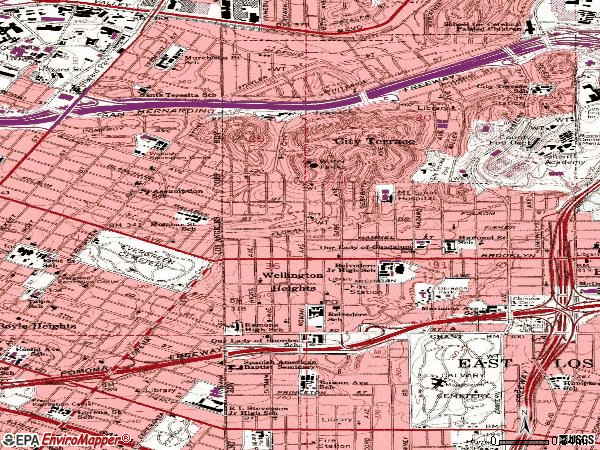
Notable locations in this zip code not listed on our city pages
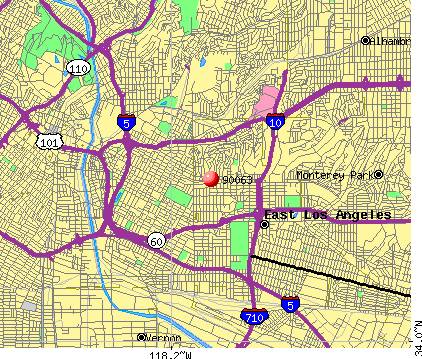
Notable locations in zip code 90063: Biscailuz Center (A), Anthony Quinn Branch County of Los Angeles Public Library (B), City Terrace Branch County of Los Angeles Public Library (C), Leonard Stovall Home for the Aged (D), Casa del Mexicano (E), Santa Maria Neighborhood Center (F), Los Angeles County Fire Department Headquarters Station and Training Facility (G). Display/hide their locations on the map
Churches in zip code 90063 include: First Hebrew Christian Church (A), Iglesia Bautista Unida (B), Ivy Chapel (C), Our Lady of Lourdes Roman Catholic Church (D), Belvedere Park Baptist Church (E), Our Lady of Guadalupe Roman Catholic Church (F), Temple of Bethel (G), Central Japanese-American Seventh Day Adventist Church (H), Chapel of San Felipe de Jesus (I). Display/hide their locations on the map
4,737 married couples with children.
3,631 single-parent households (1,186 men, 2,445 women).
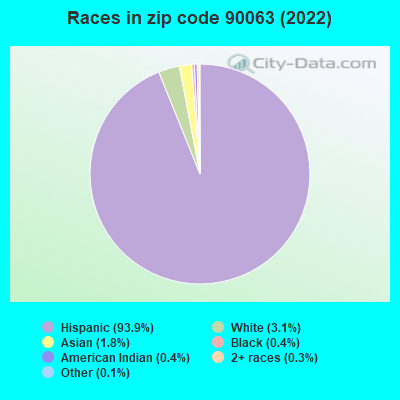
16.0% of residents of 90063 zip code speak English at home.
82.8% of residents speak Spanish at home (58% very well, 15% well, 17% not well, 10% not at all).
0.2% of residents speak other Indo-European language at home (75% very well, 18% well, 7% not well).
1.0% of residents speak Asian or Pacific Island language at home (47% very well, 17% well, 10% not well, 26% not at all).
0.1% of residents speak other language at home (44% very well, 28% well, 28% not at all).
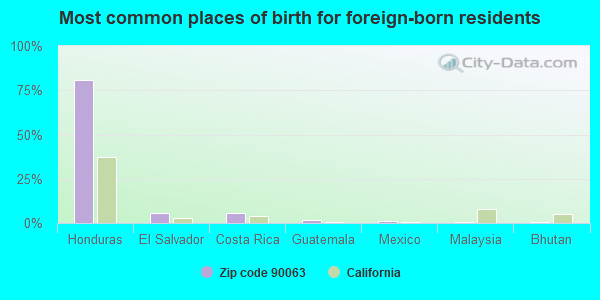
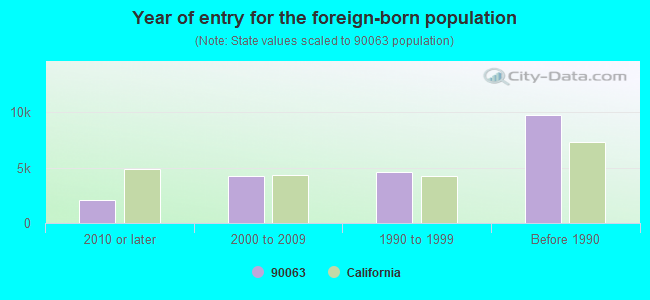
Foreign born population: 20,726 (40.2%) (41.0% of them are naturalized citizens)
Major facilities with environmental interests located in this zip code:
GEORGE INDUSTRIES (4116 WHITESIDE ST. in LOS ANGELES, CA)
STATE MASTER (California - Hazardous Waste Tracking) - HAZARDOU WASTE PROGRAM (Integrated Compliance Information System) - ICIS-09-2000-0238, FORMAL ENFORCEMENT ACTION COMPLIANCE ACTIVITY (Tracking inspections of insecticide, fungicide, and rodenticide, and toxic substances) CRITERIA AND HAZARDOUS AIR POLLUTANT INVENTORY (Inventory of air pollution sources) HAZARDOUS WASTE BIENNIAL REPORTER (Resource Conservation and Recovery Act (tracking hazardous waste)) Large Quantity Generators, more that 1000 kg of hazardous waste/month (Resource Conservation and Recovery Act (tracking hazardous waste)) - notification TRI REPORTER (Tracking of toxic chemicals releasing facilities) Business SIC classification: ELECTROPLATING, PLATING, POLISHING, ANODIZING, AND COLORING; COATING, ENGRAVING, AND ALLIED SERVICES Business NAICS classification: ELECTROPLATING, PLATING, POLISHING, ANODIZING, AND COLORING.
CHEVRON CHEMICAL (3344 E MEDFORD ST in LOS ANGELES, CA)
STATE MASTER (California - Hazardous Waste Tracking) - HAZARDOU WASTE PROGRAM CRITERIA AND HAZARDOUS AIR POLLUTANT INVENTORY (Inventory of air pollution sources) National Pollutant Discharge Elimination System NON-MAJOR (Tracking pollutant discharge elimination systems) - permit Large Quantity Generators, more that 1000 kg of hazardous waste/month (Resource Conservation and Recovery Act (tracking hazardous waste)) TRI REPORTER (Tracking of toxic chemicals releasing facilities) Business SIC classification: SURFACE ACTIVE AGENTS, FINISHING AGENTS, SULFONATED OILS, AND ASSISTANTS Business NAICS classification: PETROLEUM LUBRICATING OIL AND GREASE MANUFACTURING.; PLASTICS MATERIAL AND RESIN MANUFACTURING.; SURFACE ACTIVE AGENT MANUFACTURING. Organizations: CHEVRON CHEMICAL COMPANY (CONTACT/OPERATOR)
Alternative names: CHEVRON ENVIRONMENTAL MANAGEMENT COMPANY
LAUSD MALABAR ELEM SCHOOL (3200 E MALABAR ST in LOS ANGELES, CA)
STATE MASTER (California - Hazardous Waste Tracking) - HAZARDOU WASTE PROGRAM COMPLIANCE ACTIVITY (Tracking inspections of insecticide, fungicide, and rodenticide, and toxic substances) Large Quantity Generators, more that 1000 kg of hazardous waste/month (Resource Conservation and Recovery Act (tracking hazardous waste)) Alternative names: LAUSD/ MALABAR ST ELEM, MALABAR ST ELEMENTARY SCHOOL, MALABAR STREET ELEMENTARY, MALABAR STREET ELEMENTRY SCHOOL
LA COUNTY/ISD (1100 N EASTERN AVE in LOS ANGELES, CA) . Federal Facility
STATE MASTER (California - Hazardous Waste Tracking) - HAZARDOU WASTE PROGRAM Small Quantity Generators, between 100 kg and 1000 kg of hazardous waste/month (Resource Conservation and Recovery Act (tracking hazardous waste)) Small Quantity Generators, between 100 kg and 1000 kg of hazardous waste/month (Resource Conservation and Recovery Act (tracking hazardous waste)) Business NAICS classification: GENERAL AUTOMOTIVE REPAIR. Organizations: LA COUNTY FIRE DEPT (CONTACT/OPERATOR)
, LOS ANGELES COUNTY (CONTACT/OWNER)
Alternative names: LOS ANGELES CO OF MECHANICAL DEPT, LOS ANGELES CO OF MECHANICAL DEPT, LOS ANGELES MECHANICAL DEPT
JOHNSON CONTROLS WORLD SERVICES INCORPORATED (1104 NORTH EASTERN AVENUE in LOS ANGELES, CA)
STATE MASTER (California - Hazardous Waste Tracking) - HAZARDOU WASTE PROGRAM CRITERIA AND HAZARDOUS AIR POLLUTANT INVENTORY (Inventory of air pollution sources) Small Quantity Generators, between 100 kg and 1000 kg of hazardous waste/month (Resource Conservation and Recovery Act (tracking hazardous waste)) - notification Small Quantity Generators, between 100 kg and 1000 kg of hazardous waste/month (Resource Conservation and Recovery Act (tracking hazardous waste)) - notification Business SIC classification: GENERAL AUTOMOTIVE REPAIR SHOPS Organizations: JOHNSON CONTROL WORLD SVCS (CONTACT/OWNER)
, MPR FLEET SERVICES INC (CONTACT/OWNER)
Alternative names: JOHNSON CONTROLS EASTERN AVE, MPR FLEET SERVICES INC
C & R AUTO ELECTRIC SHOP (506 N BRANNIK AVE in LOS ANGELES, CA)
STATE MASTER (California - Hazardous Waste Tracking) - HAZARDOU WASTE PROGRAM Small Quantity Generators, between 100 kg and 1000 kg of hazardous waste/month (Resource Conservation and Recovery Act (tracking hazardous waste)) - notification Business NAICS classification: OTHER AUTOMOTIVE MECHANICAL AND ELECTRICAL REPAIR AND MAINTENANCE.
LAUSD KENNEDY ELEM SCHOOL (4010 E RAMBOZ DRIVE in LOS ANGELES, CA)
STATE MASTER (California - Hazardous Waste Tracking) - HAZARDOU WASTE PROGRAM Small Quantity Generators, between 100 kg and 1000 kg of hazardous waste/month (Resource Conservation and Recovery Act (tracking hazardous waste)) - notification Alternative names: KENNEDY (ROBERT F.) ELEMENTARY
LOS ANGELES USD HAMMEL ELEM SCHOOL (438 N BRANNICK AVE in LOS ANGELES, CA)
STATE MASTER (California - Hazardous Waste Tracking) - HAZARDOU WASTE PROGRAM Small Quantity Generators, between 100 kg and 1000 kg of hazardous waste/month (Resource Conservation and Recovery Act (tracking hazardous waste)) - notification Organizations: LOS ANGELES UNIFIED SCHOOL DISTRICT (CONTACT/OWNER)
Alternative names: HAMMEL STREET ELEMENTARY, LAUSD HAMMEL ST ELEM
LOS ANGELES USD BELVEDERE JUNIOR HG SCH (312 N RECORD AVE in LOS ANGELES, CA)
STATE MASTER (California - Hazardous Waste Tracking) - HAZARDOU WASTE PROGRAM Small Quantity Generators, between 100 kg and 1000 kg of hazardous waste/month (Resource Conservation and Recovery Act (tracking hazardous waste)) - notification Alternative names: BELVEDERE MIDDLE, LAUSD/ BELVEDERE JH
MARIANNA AVENUE ELEMENTARY (4215 E. GLEASON ST. in LOS ANGELES, CA)
(National Center for Education Statistics) - STATE ID-6018055 Organizations: LOS ANGELES UNIFIED (SCHOOL DISTRICT)
HARRISON STREET ELEMENTARY (3529 CITY TERRACE DR. in LOS ANGELES, CA)
(National Center for Education Statistics) - STATE ID-6017487 Organizations: LOS ANGELES UNIFIED (SCHOOL DISTRICT)
FRONTINOS AUTO SVC (3085 E 4TH ST in LOS ANGELES, CA)
Small Quantity Generators, between 100 kg and 1000 kg of hazardous waste/month (Resource Conservation and Recovery Act (tracking hazardous waste)) - notification (Resource Conservation and Recovery Act (tracking hazardous waste)) Business NAICS classification: GENERAL AUTOMOTIVE REPAIR. Organizations: GUESS INC (CONTACT/OWNER)
, RIGOBEITO ARELLANO (CONTACT/OWNER)
EAST LOS ANGELES HIGH SCHOOL NO 2 (4240 HAMMEL ST in LOS ANGELES, CA)
Large Quantity Generators, more that 1000 kg of hazardous waste/month (Resource Conservation and Recovery Act (tracking hazardous waste)) Organizations: EAST LA HIGH SCHOOL NO 2 (CONTACT/OPERATOR)
, LA USD (CONTACT/OWNER)
Alternative names: EAS LOS ANGELES HIGH SCHOOL
Housing units lacking complete plumbing facilities: 1.3% Housing units lacking complete kitchen facilities: 3.8%
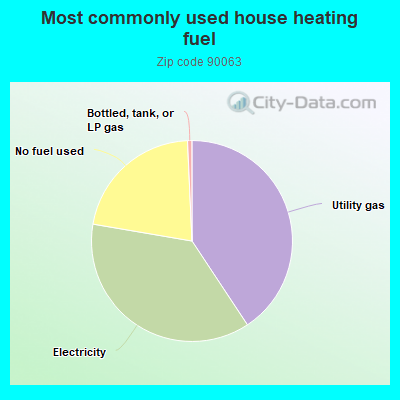
40.5%Utility gas
36.8%Electricity
21.5%No fuel used
0.7%Bottled, tank, or LP gas
Population in 1990: 61,123.
Place of birth for U.S.-born residents:
This state: 29,149
Northeast: 408
Midwest: 370
South: 450
West: 218
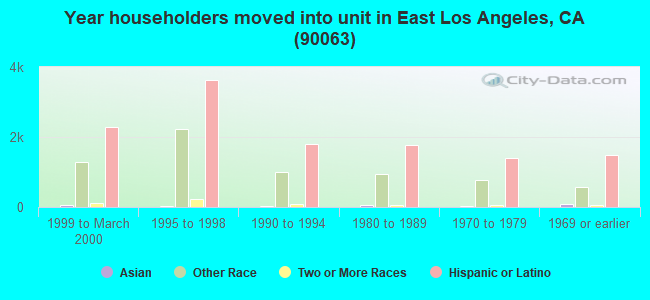
63% of the 90063 zip code residents lived in the same house 5 years ago. Out of people who lived in different houses, 94% lived in this county. Out of people who lived in different counties, 50% lived in California.
96% of the 90063 zip code residents lived in the same house 1 year ago. Out of people who lived in different houses, 86% moved from this county. Out of people who lived in different houses, 5% moved from different county within same state. Out of people who lived in different houses, 5% moved from different state. Out of people who lived in different houses, 10% moved from abroad.
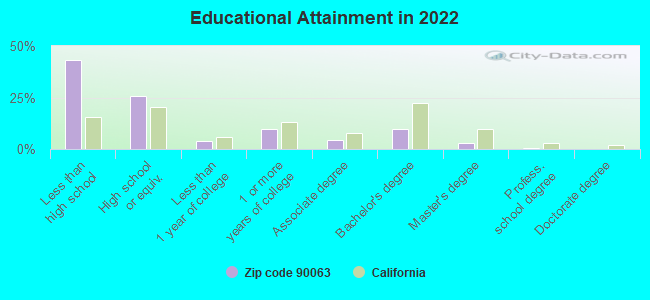
Private vs. public school enrollment:
Students in private schools in grades 1 to 8 (elementary and middle school): 479
Here:
9.2%
California:
10.5%
Students in private schools in grades 9 to 12 (high school): 198
Here:
5.5%
California:
8.5%
Students in private undergraduate colleges: 179
Here:
6.1%
California:
15.9%
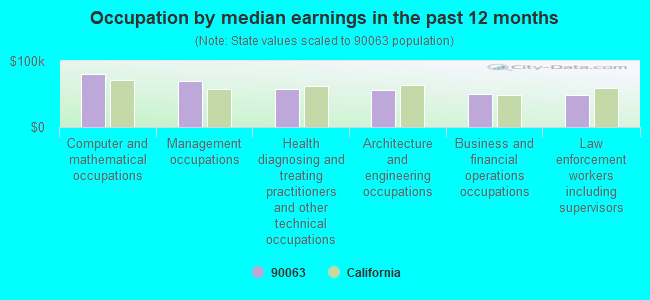
Occupation by median earnings in the past 12 months ($)
80,067Computer and mathematical occupations
69,956Management occupations
56,838Health diagnosing and treating practitioners and other technical occupations
56,666Architecture and engineering occupations
49,311Business and financial operations occupations
49,061Law enforcement workers including supervisors
Companies with federal contracts located in this zip code (LOS ANGELES, CA):
TAD RESOURCES INTERNATIONAL (1801 MISSISSIPPI) : $64,519,635 in 28 contractsfrom 1999 to 2003
Contracts for Other Administrative Support Services by Bureau of the Public Debt Signed by year:2000: $15,899,000; 2001: $18,070,000; 2002: $28,600,000; 2003: -$5,901,365; 2004: $0; 2005: $0; 2006: $0.
Biggest contracts:
$7,000,000 with Bureau of the Public Debt for Other Administrative Support Services. Signed on 2002-10-15. Completion date: 2003-03-15.
$6,500,000, same as above.Signed on 2002-08-15. Completion date: 2002-09-15.
$6,100,000, same as above.Signed on 2002-05-15. Completion date: 2002-09-15.
$6,000,000, same as above.Signed on 2001-07-15. Completion date: 2001-09-15.
SIERRA FAMILY TRUST (18771 LOS ALIMOS ST; small business) : $1,327,289 in 56 contractsfrom 1999 to 2006
Contracts for Lease or Rental of Facilities -- Office Buildings by Public Buildings Service Signed by year:2000: $168,000; 2001: $168,000; 2002: $210,598; 2003: $396,331; 2004: $42,795; 2005: $185,445; 2006: $114,120.
Biggest contracts:
$42,557 with Public Buildings Service for Lease or Rental of Facilities -- Office Buildings. Signed on 2003-09-15. Completion date: 2003-09-15.
$42,557, same as above.Signed on 2003-06-15. Completion date: 2003-06-15.
$42,299, same as above.Signed on 2003-03-15. Completion date: 2003-03-15.
$42,299, same as above.Signed on 2002-12-15. Completion date: 2002-12-15.
HIGHLAND AUTO & TRUCK SUPPLY (1536 N INDIANA STREET; small business) : $237,602 in 7 contractsfrom 2000 to 2003
Contracts for Vehicular Cab, Body, and Frame Structural Components, Vehicular Furniture and Accessories, Pipe, Tube and Rigid Tubing by Defense Logistics Agency, Navy Signed by year:2000: $67,113; 2001: $132,809; 2002: $30,450; 2003: $7,230; 2004: $0; 2005: $0; 2006: $0.
Biggest contracts:
$56,680 with Defense Logistics Agency for Vehicular Cab, Body, and Frame Structural Components. Signed on 2001-09-19. Completion date: 2002-02-16.
$41,129 with Defense Logistics Agency for Vehicular Furniture and Accessories. Signed on 2001-07-26. Completion date: 2001-12-31.
$37,964, same as above.Signed on 2000-07-31. Completion date: 2000-12-28.
$35,000 with Defense Logistics Agency for Vehicular Cab, Body, and Frame Structural Components. Signed on 2001-02-28. Completion date: 2001-08-27.
EAGLE MATERIAL HANDLING CO INC (4436 WORTH STREET; small business) : $184,625 in 8 contractsfrom 2001 to 2005
Contracts for Winches, Hoists, Cranes, and Derricks, Miscellaneous Materials Handling Equipment, Plastics Fabricated Materials, Miscellaneous Special Industry Machinery by Navy, Army Signed by year:2000: $0; 2001: $42,178; 2002: $0; 2003: $119,275; 2004: $4,580; 2005: $18,592; 2006: $0.
Biggest contracts:
$85,300 with Navy for Winches, Hoists, Cranes, and Derricks. Signed on 2003-01-21. Completion date: 2003-02-13.
$42,178 with Army for Miscellaneous Materials Handling Equipment. Signed on 2001-12-07. Completion date: 2002-01-11.
$33,975 with Army for Plastics Fabricated Materials. Signed on 2003-03-20. Completion date: 2003-05-05.
$14,664 with Army for Miscellaneous Materials Handling Equipment. Signed on 2005-09-28. Completion date: 2005-10-21.
BARBER-WEBB COMPANY INC (3833 MEDFORD ST; small business) : $124,832 in 2 contractsfrom 2000 to 2002
$78,417 with Army for Maintenance, Repair or Alteration of Real Property -- Sewage and Waste Facilities. Signed on 2002-09-20. Completion date: 2002-10-18.
$46,415, same as above.Signed on 2000-09-28. Completion date: 2000-10-28.
ROSCOE MOSS COMPANY (4360 WORTH ST; small business) : $63,051 in 7 contractsfrom 2001 to 2006
Contracts for Pipe, Tube and Rigid Tubing, Miscellaneous Chemical Specialties, Miscellaneous Construction Materials by U.S. Army Corps of Engineers - civil program financing only, Army Signed by year:2000: $0; 2001: $30,313; 2002: $8,734; 2003: $0; 2004: $16,322; 2005: $0; 2006: $7,682.
Biggest contracts:
$30,313 with U.S. Army Corps of Engineers - civil program financing only for Pipe, Tube and Rigid Tubing. Signed on 2001-05-17. Completion date: 2001-07-10.
$8,734 with U.S. Army Corps of Engineers - civil program financing only for Miscellaneous Chemical Specialties. Taking place in MS. Signed on 2002-08-07. Completion date: 2002-08-21.
$7,682 with Army for Miscellaneous Construction Materials. Taking place in MS. Signed on 2006-03-29. Completion date: 2006-04-16.
$4,086 with U.S. Army Corps of Engineers - civil program financing only for Miscellaneous Construction Materials. Taking place in MS. Signed on 2004-05-17. Completion date: 2004-05-10.
MELLCOM, INC (3900 WHITESIDE STREET; small business) : $24,675 in 5 contractsfrom 2003 to 2005
Contracts for Advertising Services by Army, U.S. Army Corps of Engineers - civil program financing only Signed by year:2000: $0; 2001: $0; 2002: $0; 2003: $4,935; 2004: $9,870; 2005: $9,870; 2006: $0.
Biggest contracts:
$4,935 with Army for Advertising Services. Signed on 2005-08-18. Completion date: 2007-09-06.
$4,935 with U.S. Army Corps of Engineers - civil program financing only for Advertising Services. Signed on 2005-08-18. Completion date: 2007-09-06.
$4,935, same as above.Signed on 2004-08-25. Completion date: 2004-10-01.
$4,935 with Army for Advertising Services. Signed on 2004-08-25. Completion date: 2004-10-01.
Top industries in this zip code by the number of employees in 2005:
Health Care and Social Assistance: Services for the Elderly and Persons with Disabilities (250-499 employees: 1 establishment, 20-49 employees: 1 establishment, 5-9 employees: 1 establishment)
2005 - 2018 National Fire Incident Reporting System (NFIRS) incidents
Based on the data from the years 2005 - 2018 the average number of fire incidents per year is 15. The highest number of fire incidents - 24 took place in 2007, and the least - 8 in 2010. The data has a constant trend.
When looking into fire subcategories, the most reports belonged to: Structure Fires (41.0%), and Outside Fires (35.4%).
Fire incident types reported to NFIRS in Zip Code 90063


 Nearest zip codes: 90023, 90033, 90032, 90022, 91754, 90031.


 Based on the data from the years 2005 - 2018 the average number of fire incidents per year is 15. The highest number of fire incidents - 24 took place in 2007, and the least - 8 in 2010. The data has a constant trend.
 When looking into fire subcategories, the most reports belonged to: Structure Fires (41.0%), and Outside Fires (35.4%).