Estimated zip code population in 2022: 37,146 Zip code population in 2010: 39,316 Zip code population in 2000: 38,409
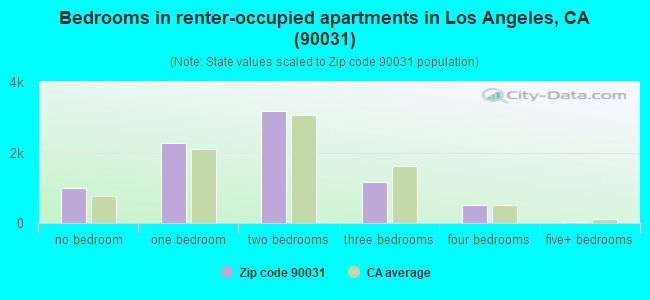
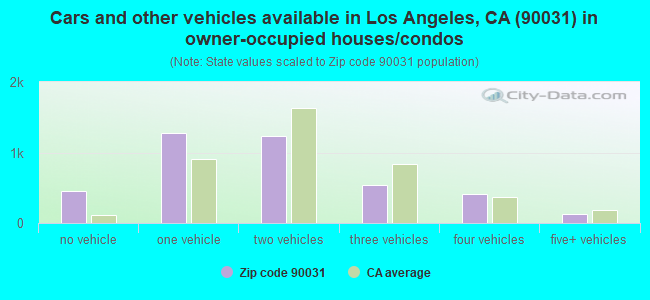
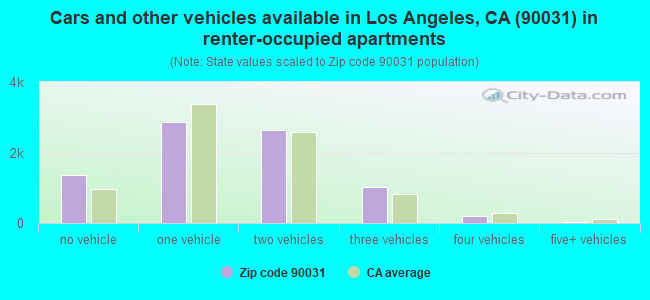
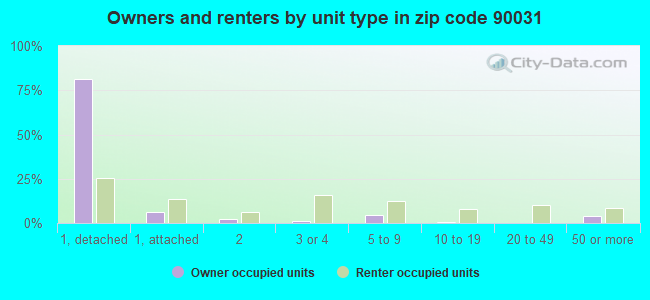
Houses and condos: 12,725 Renter-occupied apartments: 8,143
% of renters here:
67%
State:
44%
March 2022 cost of living index in zip code 90031: 139.5 (high, U.S. average is 100)
Land area: 3.5 sq. mi. Water area: 0.1 sq. mi.
Population density: 10,757 people per square mile
(high).
OSM Map
General Map
Google Map
MSN Map
OSM Map
General Map
Google Map
MSN Map
OSM Map
General Map
Google Map
MSN Map
OSM Map
General Map
Google Map
MSN Map
Please wait while loading the map...
Real estate property taxes paid for housing units in 2022:
This zip code:
0.5% ($3,594)
California:
0.7% ($4,831)
Median real estate property taxes paid for housing units with mortgages in 2022: $4,964 (0.6%) Median real estate property taxes paid for housing units with no mortgage in 2022: $2,764 (0.4%)
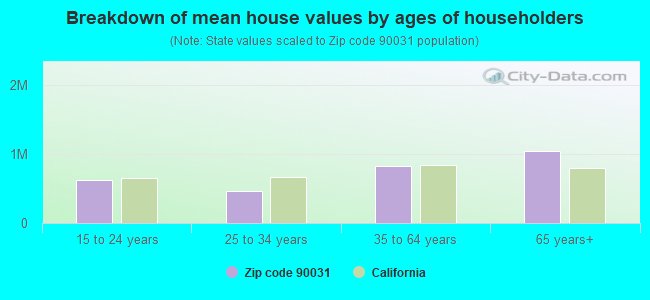
Estimated median house/condo value in 2022: $748,150
90031:
$748,150
California:
$715,900
According to our research of California and other state lists, there were 51 registered sex offenders living in 90031 zip code as of April 27, 2024. The ratio of all residents to sex offenders in zip code 90031 is 774 to 1. The ratio of registered sex offenders to all residents in this zip code is near the state average.
Median resident age:
This zip code:
38.8 years
California median age:
37.9 years
Average household size:
This zip code:
3.0 people
California:
2.8 people
Averages for the 2020 tax year for zip code 90031, filed in 2021:
Average Adjusted Gross Income (AGI) in 2020: $45,950 (Individual Income Tax Returns)
Here:
$45,950
State:
$95,910
Salary/wage: $42,279 (reported on 83.0% of returns)
Here:
$42,279
State:
$77,331
(% of AGI for various income ranges: 1216.2% for AGIs below $25k, 3994.0% for AGIs $25k-50k, 7616.4% for AGIs $50k-75k, 11370.6% for AGIs $75k-100k, 19447.7% for AGIs $100k-200k, 85872.9% for AGIs over 200k)
Taxable interest for individuals: $539 (reported on 19.4% of returns)
This zip code:
$539
California:
$2,294
(% of AGI for various income ranges: 6.1% for AGIs below $25k, 8.5% for AGIs $25k-50k, 15.0% for AGIs $50k-75k, 20.4% for AGIs $75k-100k, 64.8% for AGIs $100k-200k, 545.7% for AGIs over 200k)
Ordinary dividends: $2,438 (reported on 8.6% of returns)
Here:
$2,438
State:
$10,949
(% of AGI for various income ranges: 6.8% for AGIs below $25k, 10.8% for AGIs $25k-50k, 18.7% for AGIs $50k-75k, 42.7% for AGIs $75k-100k, 157.7% for AGIs $100k-200k, 1768.6% for AGIs over 200k)
Net capital gain/loss in AGI: +$7,729 (reported on 10.0% of returns)
Here:
+$7,729
State:
+$49,306
(% of AGI for various income ranges: 4.0% for AGIs below $25k, 13.2% for AGIs $25k-50k, 36.0% for AGIs $50k-75k, 89.7% for AGIs $75k-100k, 416.6% for AGIs $100k-200k, 12367.1% for AGIs over 200k)
Profit/loss from business: +$8,552 (reported on 20.6% of returns)
Here:
+$8,552
State:
+$15,671
(% of AGI for various income ranges: 237.9% for AGIs below $25k, 164.4% for AGIs $25k-50k, 186.3% for AGIs $50k-75k, 305.9% for AGIs $75k-100k, 631.1% for AGIs $100k-200k, 5400.0% for AGIs over 200k)
Taxable individual retirement arrangement distribution: $11,394 (reported on 1.9% of returns)
90031:
$11,394
California:
$23,505
(% of AGI for various income ranges: 13.6% for AGIs below $25k, 19.8% for AGIs $25k-50k, 42.9% for AGIs $50k-75k, 54.8% for AGIs $75k-100k, 195.2% for AGIs $100k-200k)
Self-employed (Keogh) retirement plans: $12,140 (reported on 0.3% of returns)
90031:
$12,140
California:
$30,163
(% of AGI for various income ranges: 3.4% for AGIs below $25k, 69.7% for AGIs $100k-200k)
Total itemized deductions: $32,929 (reported on 6.7% of returns)
Here:
$32,929
State:
$39,517
(% of AGI for various income ranges: 33.5% for AGIs below $25k, 81.7% for AGIs $25k-50k, 289.3% for AGIs $50k-75k, 737.9% for AGIs $75k-100k, 1818.2% for AGIs $100k-200k, 16154.3% for AGIs over 200k)
Charity contributions: $5,051 (reported on 5.3% of returns)
Here:
$5,051
State:
$12,598
(% of AGI for various income ranges: 2.3% for AGIs below $25k, 10.9% for AGIs $25k-50k, 36.8% for AGIs $50k-75k, 91.4% for AGIs $75k-100k, 270.0% for AGIs $100k-200k, 1572.9% for AGIs over 200k)
Taxes paid: $8,233 (reported on 6.7% of returns)
90031:
$8,233
State:
$8,807
(% of AGI for various income ranges: 7.2% for AGIs below $25k, 21.3% for AGIs $25k-50k, 89.1% for AGIs $50k-75k, 237.3% for AGIs $75k-100k, 573.8% for AGIs $100k-200k, 2032.9% for AGIs over 200k)
Earned income credit: $2,017 (reported on 22.9% of returns)
Here:
$2,017
State:
$2,074
(% of AGI for various income ranges: 110.0% for AGIs below $25k, 76.0% for AGIs $25k-50k, 0.8% for AGIs $50k-75k)
Percentage of individuals using paid preparers for their 2020 taxes: 92.6%
Here:
93%
State:
92%
(% for various income ranges: 90.9% for AGIs below $25k, 93.5% for AGIs $25k-50k, 93.6% for AGIs $50k-75k, 93.6% for AGIs $75k-100k, 94.7% for AGIs $100k-200k, 96.4% for AGIs over 200k)
Averages for the 2012 tax year for zip code 90031, filed in 2013:
Average Adjusted Gross Income (AGI) in 2012: $31,902 (Individual Income Tax Returns)
Here:
$31,902
State:
$72,726
Salary/wage: $30,827 (reported on 85.8% of returns)
Here:
$30,827
State:
$59,079
(% of AGI for various income ranges: 78.3% for AGIs below $25k, 90.0% for AGIs $25k-50k, 88.9% for AGIs $50k-75k, 87.0% for AGIs $75k-100k, 83.4% for AGIs $100k-200k, 37.0% for AGIs over 200k)
Taxable interest for individuals: $509 (reported on 18.3% of returns)
This zip code:
$509
California:
$2,146
(% of AGI for various income ranges: 0.3% for AGIs below $25k, 0.2% for AGIs $25k-50k, 0.2% for AGIs $50k-75k, 0.3% for AGIs $75k-100k, 0.3% for AGIs $100k-200k, 1.3% for AGIs over 200k)
Ordinary dividends: $2,522 (reported on 5.1% of returns)
Here:
$2,522
State:
$9,308
(% of AGI for various income ranges: 0.2% for AGIs below $25k, 0.2% for AGIs $25k-50k, 0.3% for AGIs $50k-75k, 0.5% for AGIs $75k-100k, 1.1% for AGIs $100k-200k, 1.2% for AGIs over 200k)
Net capital gain/loss in AGI: +$5,172 (reported on 4.8% of returns)
Here:
+$5,172
State:
+$30,460
(% of AGI for various income ranges: 0.1% for AGIs $50k-75k, 0.4% for AGIs $75k-100k, 0.9% for AGIs $100k-200k, 11.0% for AGIs over 200k)
Profit/loss from business: +$10,062 (reported on 18.9% of returns)
Here:
+$10,062
State:
+$17,064
(% of AGI for various income ranges: 14.2% for AGIs below $25k, 3.8% for AGIs $25k-50k, 2.7% for AGIs $50k-75k, 2.0% for AGIs $75k-100k, 3.3% for AGIs $100k-200k, 7.4% for AGIs over 200k)
Taxable individual retirement arrangement distribution: $9,897 (reported on 2.0% of returns)
90031:
$9,897
California:
$19,557
(% of AGI for various income ranges: 0.5% for AGIs below $25k, 0.4% for AGIs $25k-50k, 0.7% for AGIs $50k-75k, 0.6% for AGIs $75k-100k, 1.4% for AGIs $100k-200k)
Self-employment retirement plans: $17,400 (reported on 0.2% of returns)
90031:
$17,400
California:
$24,530
Total itemized deductions: $21,556 (29% of AGI, reported on 16.5% of returns)
Here:
$21,556
State:
$34,004
Here:
29.3% of AGI
State:
22.7% of AGI
(% of AGI for various income ranges: 4.4% for AGIs below $25k, 8.1% for AGIs $25k-50k, 13.3% for AGIs $50k-75k, 16.3% for AGIs $75k-100k, 19.0% for AGIs $100k-200k, 20.8% for AGIs over 200k)
Charity contributions: $2,088 (reported on 12.5% of returns)
Here:
$2,088
State:
$4,659
(% of AGI for various income ranges: 0.2% for AGIs below $25k, 0.6% for AGIs $25k-50k, 1.1% for AGIs $50k-75k, 1.4% for AGIs $75k-100k, 1.5% for AGIs $100k-200k, 0.9% for AGIs over 200k)
Taxes paid: $6,760 (reported on 16.5% of returns)
90031:
$6,760
State:
$14,448
(% of AGI for various income ranges: 0.8% for AGIs below $25k, 1.7% for AGIs $25k-50k, 3.8% for AGIs $50k-75k, 5.6% for AGIs $75k-100k, 7.2% for AGIs $100k-200k, 10.4% for AGIs over 200k)
Earned income credit: $2,409 (reported on 34.1% of returns)
Here:
$2,409
State:
$2,286
(% of AGI for various income ranges: 9.0% for AGIs below $25k, 1.6% for AGIs $25k-50k)
Percentage of individuals using paid preparers for their 2012 taxes: 77.3%
Here:
77%
State:
64%
(% for various income ranges: 78.0% for AGIs below $25k, 78.2% for AGIs $25k-50k, 74.7% for AGIs $50k-75k, 70.5% for AGIs $75k-100k, 73.6% for AGIs $100k-200k, 83.3% for AGIs over 200k)
Averages for the 2004 tax year for zip code 90031, filed in 2005:
Average Adjusted Gross Income (AGI) in 2004: $25,637 (Individual Income Tax Returns)
Here:
$25,637
State:
$58,600
Salary/wage: $25,159 (reported on 88.3% of returns)
Here:
$25,159
State:
$49,455
(% of AGI for various income ranges: 84.2% for AGIs below $10k, 86.8% for AGIs $10k-25k, 92.6% for AGIs $25k-50k, 91.7% for AGIs $50k-75k, 90.2% for AGIs $75k-100k, 57.8% for AGIs over 100k)
Taxable interest for individuals: $672 (reported on 24.6% of returns)
This zip code:
$672
California:
$2,365
(% of AGI for various income ranges: 1.2% for AGIs below $10k, 0.5% for AGIs $10k-25k, 0.5% for AGIs $25k-50k, 0.6% for AGIs $50k-75k, 0.5% for AGIs $75k-100k, 1.4% for AGIs over 100k)
Taxable dividends: $1,177 (reported on 5.7% of returns)
Here:
$1,177
State:
$4,746
(% of AGI for various income ranges: 0.3% for AGIs below $10k, 0.1% for AGIs $10k-25k, 0.1% for AGIs $25k-50k, 0.4% for AGIs $50k-75k, 0.1% for AGIs $75k-100k, 0.8% for AGIs over 100k)
Net capital gain/loss: +$11,627 (reported on 5.3% of returns)
Here:
+$11,627
State:
+$23,418
(% of AGI for various income ranges: -0.6% for AGIs below $10k, -0.1% for AGIs $10k-25k, 0.0% for AGIs $25k-50k, 0.4% for AGIs $50k-75k, 1.9% for AGIs $75k-100k, 20.9% for AGIs over 100k)
Profit/loss from business: +$7,616 (reported on 14.7% of returns)
Here:
+$7,616
State:
+$16,826
(% of AGI for various income ranges: 17.0% for AGIs below $10k, 7.6% for AGIs $10k-25k, 2.8% for AGIs $25k-50k, 2.1% for AGIs $50k-75k, 1.4% for AGIs $75k-100k, 1.8% for AGIs over 100k)
IRA payment deduction: $2,677 (reported on 2.0% of returns)
90031:
$2,677
California:
$3,192
(% of AGI for various income ranges: 0.2% for AGIs $10k-25k, 0.3% for AGIs $25k-50k, 0.3% for AGIs $50k-75k, 0.2% for AGIs over 100k)
Total itemized deductions: $16,921 (31% of AGI, reported on 16.3% of returns)
Here:
$16,921
State:
$28,113
Here:
30.9% of AGI
State:
25.3% of AGI
(% of AGI for various income ranges: 4.6% for AGIs below $10k, 5.1% for AGIs $10k-25k, 10.6% for AGIs $25k-50k, 15.6% for AGIs $50k-75k, 19.3% for AGIs $75k-100k, 14.8% for AGIs over 100k)
Charity contributions deductions: $2,008 (3% of AGI, reported on 13.2% of returns)
Here:
$2,008
State:
$3,923
Here:
3.4% of AGI
State:
3.3% of AGI
(% of AGI for various income ranges: 0.2% for AGIs below $10k, 0.3% for AGIs $10k-25k, 1.0% for AGIs $25k-50k, 1.6% for AGIs $50k-75k, 2.3% for AGIs $75k-100k, 1.6% for AGIs over 100k)
Total tax: $3,026 (reported on 57.8% of returns)
90031:
$3,026
State:
$10,761
(% of AGI for various income ranges: 3.7% for AGIs below $10k, 3.1% for AGIs $10k-25k, 5.2% for AGIs $25k-50k, 8.8% for AGIs $50k-75k, 10.7% for AGIs $75k-100k, 16.5% for AGIs over 100k)
Earned income credit: $1,995 (reported on 35.6% of returns)
Here:
$1,995
State:
$1,763
Percentage of individuals using paid preparers for their 2004 taxes: 78.8%
Here:
79%
State:
66%
(% for various income ranges: 76.6% for AGIs below $10k, 81.2% for AGIs $10k-25k, 78.9% for AGIs $25k-50k, 75.9% for AGIs $50k-75k, 72.8% for AGIs $75k-100k, 76.1% for AGIs over 100k)
Likely homosexual households (counted as self-reported same-sex unmarried-partner households)
Lesbian couples: 0.1% of all households
Gay men: 0.5% of all households
Household received Food Stamps/SNAP in the past 12 months: 2,568 Household did not receive Food Stamps/SNAP in the past 12 months: 9,818
Women who had a birth in the past 12 months: 422 (235 now married, 188 unmarried) Women who did not have a birth in the past 12 months: 8,694 (3,192 now married, 5,512 unmarried)
Housing units in zip code 90031 with a mortgage: 2,027 (229 second mortgage, 13 home equity loan, 185 both second mortgage and home equity loan) Houses without a mortgage: 10
Median monthly owner costs for units with a mortgage: $2,898 Median monthly owner costs for units without a mortgage: $580
Residents with income below the poverty level in 2022:
This zip code:
18.1%
Whole state:
12.2%
Residents with income below 50% of the poverty level in 2022:
This zip code:
10.0%
Whole state:
6.2%
Median number of rooms in houses and condos:
Here:
4.9
State:
6.0
Median number of rooms in apartments:
Here:
3.7
State:
3.9
Notable locations in this zip code not listed on our city pages
Notable locations in zip code 90031: San Antonio Winery (A), Lincoln Heights Branch Los Angeles Public Library (B), City of Los Angeles Fire Department Station 1 (C), Lummis Home (D), Sacred Heart Auditorium (E). Display/hide their locations on the map
Churches in zip code 90031 include: Epiphany Chapel (A), Sacred Heart Roman Catholic Church (B), Sycamore Park Foursquare Church (C), Advent Christian Church (D), Asbury United Methodist Church (E), Church of Christ (F), First American Indian Church (G), Italian Christian Assembly Church (H), Latvian Lutheran Church (I). Display/hide their locations on the map
Parks in zip code 90031 include: Ela Park (1), Lincoln Park Recreation Center (2), Montecito Heights Recreation Center (3), Downey Recreation Center (4), Lincoln Park (5), Rose Hill Park (6), Montecito Park (7), Ernest E. Debs Regional Park (8), Downey Playground (9). Display/hide their locations on the map
3,064 married couples with children.
1,950 single-parent households (333 men, 1,617 women).
23.8% of residents of 90031 zip code speak English at home.
50.9% of residents speak Spanish at home (55% very well, 17% well, 19% not well, 8% not at all).
1.1% of residents speak other Indo-European language at home (78% very well, 20% well, 2% not well).
24.0% of residents speak Asian or Pacific Island language at home (33% very well, 18% well, 36% not well, 12% not at all).
0.1% of residents speak other language at home (44% very well, 18% not well, 38% not at all).
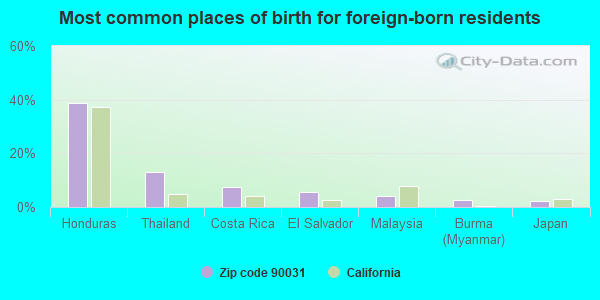
Foreign born population: 17,299 (46.6%) (56.4% of them are naturalized citizens)
Major facilities with environmental interests located in this zip code:
MORWEAR MANUFACTURING / SMILAND PAINT (620 LAMAR STREET in LOS ANGELES, CA)
AIR MAJOR (AIRS/AFS) AIR MINOR (AIRS/AFS) FORMAL ENFORCEMENT ACTION (Integrated Compliance Information System) - ICIS-09-2005-0205, ENFORCEMENT/COMPLIANCE ACTIVITY CRITERIA AND HAZARDOUS AIR POLLUTANT INVENTORY (Inventory of air pollution sources) HAZARDOUS WASTE BIENNIAL REPORTER (Resource Conservation and Recovery Act (tracking hazardous waste)) Large Quantity Generators, more that 1000 kg of hazardous waste/month (Resource Conservation and Recovery Act (tracking hazardous waste)) TRI REPORTER (Tracking of toxic chemicals releasing facilities) Business SIC classification: PAINTS, VARNISHES, LACQUERS, ENAMELS, AND ALLIED PRODUCTS; NONCLASSIFIABLE ESTABLISHMENTS Organizations: SMILAND PAINT COMPANY (CONTACT/OPERATOR)
Alternative names: SMILAND PAINT CO.
MISSION KLEENSWEEP PRODUCTS INCORPORATED (2434 BIRKDALE ST. in LOS ANGELES, CA)
(Integrated Compliance Information System) - ICIS-09-1998-0178, FORMAL ENFORCEMENT ACTION COMPLIANCE ACTIVITY (Tracking inspections of insecticide, fungicide, and rodenticide, and toxic substances) CRITERIA AND HAZARDOUS AIR POLLUTANT INVENTORY (Inventory of air pollution sources) TRI REPORTER (Tracking of toxic chemicals releasing facilities) Business SIC classification: SOAP AND OTHER DETERGENTS, EXCEPT SPECIALTY CLEANERS; SPECIALTY CLEANING, POLISHING, AND SANITATION PREPARATIONS Business NAICS classification: SOAP AND OTHER DETERGENT MANUFACTURING.
LA USD LINCOLN HS (3501 N BROADWAY in LOS ANGELES, CA)
STATE MASTER (California - Hazardous Waste Tracking) - HAZARDOU WASTE PROGRAM Large Quantity Generators, more that 1000 kg of hazardous waste/month (Resource Conservation and Recovery Act (tracking hazardous waste)) Organizations: LAUSD (CONTACT/OPERATOR)
Alternative names: LINCOLN (ABRAHAM) SENIOR HIGH
CHROMAL PLATING CO (1748 WORKMAN ST in LOS ANGELES, CA)
STATE MASTER (California - Hazardous Waste Tracking) - HAZARDOU WASTE PROGRAM CRITERIA AND HAZARDOUS AIR POLLUTANT INVENTORY (Inventory of air pollution sources) Small Quantity Generators, between 100 kg and 1000 kg of hazardous waste/month (Resource Conservation and Recovery Act (tracking hazardous waste)) TRI REPORTER (Tracking of toxic chemicals releasing facilities) Business SIC and NAICS classification: ELECTROPLATING, PLATING, POLISHING, ANODIZING, AND COLORING Alternative names: CHROMAN PLATING CO
LA E/N EAST CHILD CARE CENTER (2422 MANITOU in LOS ANGELES, CA)
STATE MASTER (California - Hazardous Waste Tracking) - HAZARDOU WASTE PROGRAM Small Quantity Generators, between 100 kg and 1000 kg of hazardous waste/month (Resource Conservation and Recovery Act (tracking hazardous waste)) - notification Organizations: CITY OF LOS ANGELES (CONTACT/OWNER)
Alternative names: CITY OF LA GENERAL SERVICES
MISSION LABORATORIES (2433 BIRKDALE STREET in LOS ANGELES, CA)
(Integrated Compliance Information System) - ICIS-09-1999-0096, FORMAL ENFORCEMENT ACTION, ICIS-09-2003-0174, COMPLIANCE ACTIVITY (Tracking inspections of insecticide, fungicide, and rodenticide, and toxic substances) Business SIC classification: SOAP AND OTHER DETERGENTS, EXCEPT SPECIALTY CLEANERS Alternative names: MISSION LABORATORIES DBA MISSION KLEENSP
LOS ANGELES USD GRIFFIN ELEM SCHOOL (2025 GRIFFIN AVE in LOS ANGELES, CA)
STATE MASTER (California - Hazardous Waste Tracking) - HAZARDOU WASTE PROGRAM Small Quantity Generators, between 100 kg and 1000 kg of hazardous waste/month (Resource Conservation and Recovery Act (tracking hazardous waste)) - notification Organizations: LOS ANGELES UNIFIED SCHOOL DISTRICT (CONTACT/OWNER)
Alternative names: GRIFFIN AVENUE ELEMENTARY, LAUSD/ GRIFFIN AVE ELEM
LOS ANGELES USD ALBION ELEM SCHOOL (322 S AVE 18 in LOS ANGELES, CA)
STATE MASTER (California - Hazardous Waste Tracking) - HAZARDOU WASTE PROGRAM Small Quantity Generators, between 100 kg and 1000 kg of hazardous waste/month (Resource Conservation and Recovery Act (tracking hazardous waste)) - notification Organizations: LOS ANGELES UNIFIED SCHOOL DISTRICT (CONTACT/OWNER)
Alternative names: ALBION STREET ELEMENTARY, LAUSD/ ALBION ST ELEM
LA USD LATONA EL (4312 BERENICE AVE in LOS ANGELES, CA)
STATE MASTER (California - Hazardous Waste Tracking) - HAZARDOU WASTE PROGRAM Small Quantity Generators, between 100 kg and 1000 kg of hazardous waste/month (Resource Conservation and Recovery Act (tracking hazardous waste)) - notification Alternative names: LATONA AVENUE ELEMENTARY, LAUSD/ LATONA AVE ELEM
LA USD HILLSIDE EL (120 E AVE 35 in LOS ANGELES, CA)
STATE MASTER (California - Hazardous Waste Tracking) - HAZARDOU WASTE PROGRAM Small Quantity Generators, between 100 kg and 1000 kg of hazardous waste/month (Resource Conservation and Recovery Act (tracking hazardous waste)) - notification Alternative names: HILLSIDE ELEMENTARY, LAUSD/HILLSIDE ELEM
F AND L ENT INC (1739 N ALBION ST in LOS ANGELES, CA)
STATE MASTER (California - Hazardous Waste Tracking) - HAZARDOU WASTE PROGRAM Small Quantity Generators, between 100 kg and 1000 kg of hazardous waste/month (Resource Conservation and Recovery Act (tracking hazardous waste)) - notification
MODERN SCREEN PRINTING (2919 1/2 N MAIN ST in LOS ANGELES, CA)
STATE MASTER (California - Hazardous Waste Tracking) - HAZARDOU WASTE PROGRAM Small Quantity Generators, between 100 kg and 1000 kg of hazardous waste/month (Resource Conservation and Recovery Act (tracking hazardous waste)) - notification
HOLLINS ELECTRIC AND ENGINEERING COMPANY (2037 LINCOLN PARK AVE in LOS ANGELES, CA)
(Integrated Compliance Information System) - ICIS-09-1992-0051, FORMAL ENFORCEMENT ACTION COMPLIANCE ACTIVITY (Tracking inspections of insecticide, fungicide, and rodenticide, and toxic substances) Business SIC classification: ELECTRICAL MACHINERY, EQUIPMENT, AND SUPPLIES Alternative names: HOLLIS ELECTRIC AND ENGINEERING, INC, W C HOLLINS ELECTRIC & ENGINEERING CO
Housing units lacking complete plumbing facilities: 0.6% Housing units lacking complete kitchen facilities: 3.9%
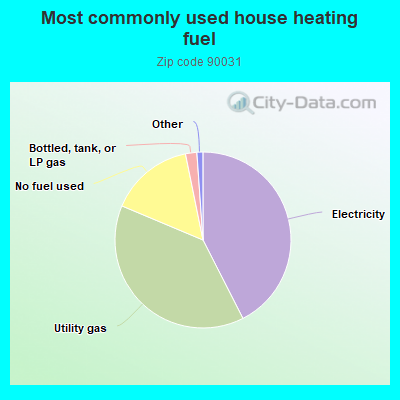
42.6%Electricity
38.9%Utility gas
15.5%No fuel used
2.1%Bottled, tank, or LP gas
Population in 1990: 39,706.
Place of birth for U.S.-born residents:
This state: 16,503
Northeast: 774
Midwest: 564
South: 1,013
West: 627
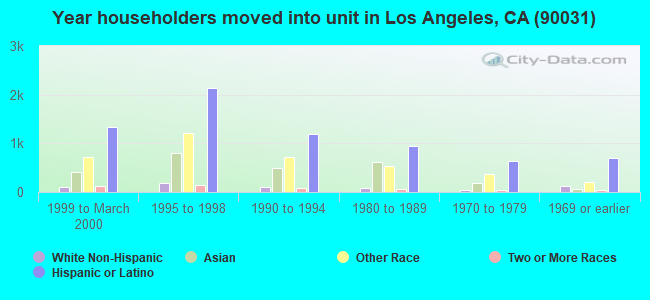
63% of the 90031 zip code residents lived in the same house 5 years ago. Out of people who lived in different houses, 94% lived in this county. Out of people who lived in different counties, 50% lived in California.
93% of the 90031 zip code residents lived in the same house 1 year ago. Out of people who lived in different houses, 78% moved from this county. Out of people who lived in different houses, 4% moved from different county within same state. Out of people who lived in different houses, 11% moved from different state. Out of people who lived in different houses, 9% moved from abroad.
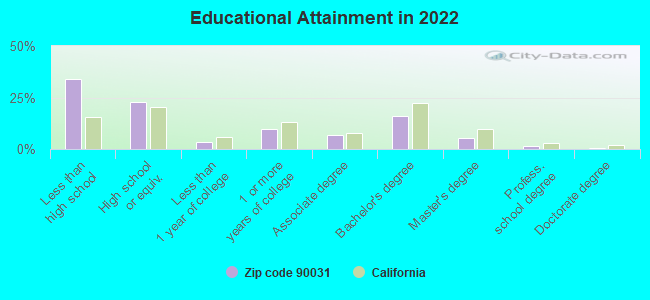
Private vs. public school enrollment:
Students in private schools in grades 1 to 8 (elementary and middle school): 152
Here:
5.5%
California:
10.5%
Students in private schools in grades 9 to 12 (high school): 214
Here:
10.5%
California:
8.5%
Students in private undergraduate colleges: 165
Here:
9.3%
California:
15.9%
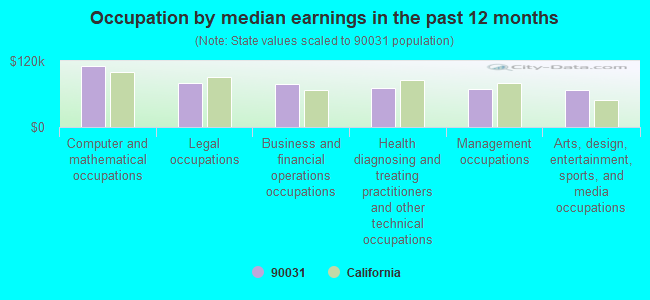
Occupation by median earnings in the past 12 months ($)
110,599Computer and mathematical occupations
79,611Legal occupations
77,967Business and financial operations occupations
70,360Health diagnosing and treating practitioners and other technical occupations
68,352Management occupations
66,921Arts, design, entertainment, sports, and media occupations
Companies with federal contracts located in this zip code (LOS ANGELES, CA):
CHROMAL PATING CO INC (1748 WORKMAN STREET; small business) : $2,735,343 in 14 contractsfrom 2001 to 2006
Contracts for Maintenance, Repair and Rebuilding of Equipment -- Special Industry Machinery, Guided Missile Remote Control Systems by Air Force Signed by year:2000: $0; 2001: $353,372; 2002: $302,900; 2003: $528,024; 2004: $443,819; 2005: $460,000; 2006: $647,228.
Biggest contracts:
$498,024 with Air Force for Maintenance, Repair and Rebuilding of Equipment -- Special Industry Machinery. Signed on 2003-01-22. Completion date: 2003-09-30.
$498,000, same as above.Signed on 2002-11-01. Completion date: 2003-09-30.
$443,819, same as above.Signed on 2004-02-05. Completion date: 2004-09-30.
$368,144, same as above.Signed on 2002-04-15. Completion date: 2002-09-30.
STADCO (1931 N BROADWAY; small business) : $239,670 in 7 contractsfrom 2002 to 2006
Contracts for Switches, Torque Converters and Speed Changers by Defense Logistics Agency, Navy Signed by year:2000: $0; 2001: $0; 2002: $39,600; 2003: $27,720; 2004: $108,850; 2005: $0; 2006: $63,500.
Biggest contracts:
$51,800 with Defense Logistics Agency for Switches. Signed on 2006-03-23. Completion date: 2006-09-07.
$39,600 with Navy for Torque Converters and Speed Changers. Signed on 2002-12-04. Completion date: 2003-02-05.
$37,800 with Defense Logistics Agency for Switches. Signed on 2004-07-30. Completion date: 2004-12-30.
$37,800, same as above.Signed on 2004-05-20. Completion date: 2004-11-04.
NATIONAL WIRE & CABLE CORPORAT (136 N SAN FERNANDO RD; small business) : $126,643 in 3 contractsfrom 2003 to 2005
$94,678 with Navy for Cable, Cord, and Wire Assemblies: Communications Equipment. Signed on 2004-02-18. Completion date: 2004-04-08.
$28,980 with Navy for Wire and Cable, Electrical. Signed on 2003-09-30. Completion date: 2003-10-24.
$2,985 with Navy for Other Defense -- Applied Research and Exploratory Development (R&D). Signed on 2005-09-15. Completion date: 2005-10-14.
MASTER PROTECTION CORPORATION (2684 LACY STREET; small business) : $13,313 in 4 contractsfrom 2002 to 2005
$6,911 with Navy for Maintenance, Repair or Alteration of Real Property -- Miscellaneous Buildings. Signed on 2003-04-24. Completion date: 2003-06-30.
$2,174, same as above.Signed on 2005-06-30. Completion date: 2005-06-30.
$2,126, same as above.Signed on 2003-09-04. Completion date: 2003-06-30.
$2,102, same as above.Signed on 2002-06-27. Completion date: 2003-06-30.
F & L ENTERPRISES INC (1739 ALBION ST)
$3,646 with Defense Logistics Agency for Dairy Foods and Eggs. Signed on 2005-10-06. Completion date: 2005-10-07.
GIBBS BROTHERS ELECTRIC INC (1754 N MAIN ST; small business)
$3,000 with Navy for Maintenance, Repair or Alteration of Real Property -- Other Non-Building Facilities. Signed on 2003-02-27. Completion date: 2003-03-24.
Top industries in this zip code by the number of employees in 2005:
Health Care and Social Assistance: Vocational Rehabilitation Services (500-999 employees: 1 establishment)
Management of Companies and Enterprises: Corporate, Subsidiary, and Regional Managing Offices (250-499: 1, 100-249: 1, 50-99: 1, 20-49: 1, 5-9: 1)
Health Care and Social Assistance: Nursing Care Facilities (250-499: 1, 50-99: 1)
2005 - 2018 National Fire Incident Reporting System (NFIRS) incidents
According to the data from the years 2005 - 2018 the average number of fires per year is 87. The highest number of fire incidents - 136 took place in 2018, and the least - 56 in 2011. The data has an increasing trend.
When looking into fire subcategories, the most incidents belonged to: Structure Fires (42.8%), and Outside Fires (32.0%).
Fire incident types reported to NFIRS in Zip Code 90031


 Nearest zip codes: 90032, 90042, 90065, 90033, 90090, 90012.


 According to the data from the years 2005 - 2018 the average number of fires per year is 87. The highest number of fire incidents - 136 took place in 2018, and the least - 56 in 2011. The data has an increasing trend.
 When looking into fire subcategories, the most incidents belonged to: Structure Fires (42.8%), and Outside Fires (32.0%).