Estimated zip code population in 2022: 58,659 Zip code population in 2010: 62,430 Zip code population in 2000: 64,660
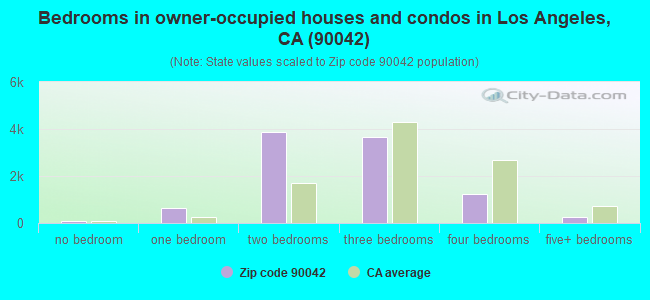
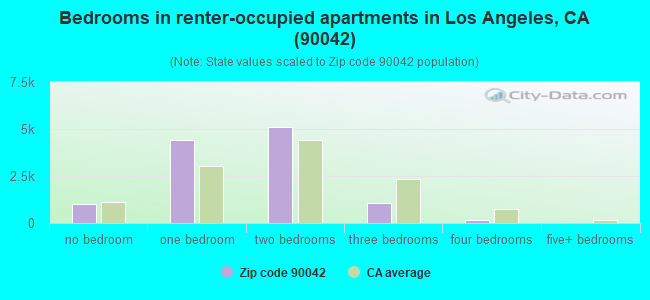
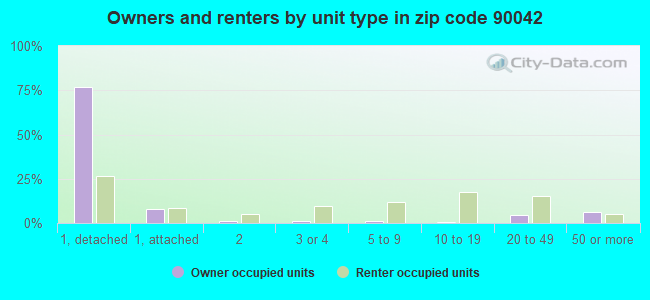
Houses and condos: 22,498 Renter-occupied apartments: 11,801
% of renters here:
55%
State:
44%
March 2022 cost of living index in zip code 90042: 137.2 (high, U.S. average is 100)
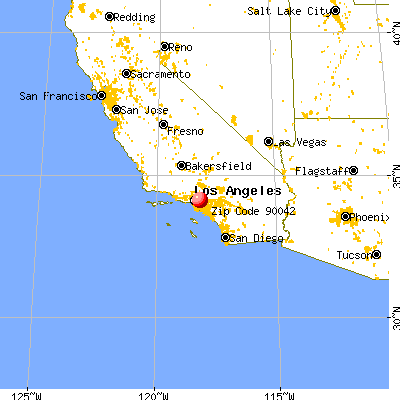
Land area: 4.6 sq. mi. Water area: 0.0 sq. mi.
Population density: 12,629 people per square mile
(very high).
OSM Map
General Map
Google Map
MSN Map
OSM Map
General Map
Google Map
MSN Map
OSM Map
General Map
Google Map
MSN Map
OSM Map
General Map
Google Map
MSN Map
Please wait while loading the map...
Real estate property taxes paid for housing units in 2022:
This zip code:
0.5% ($4,886)
California:
0.7% ($4,831)
Median real estate property taxes paid for housing units with mortgages in 2022: $5,833 (0.6%) Median real estate property taxes paid for housing units with no mortgage in 2022: $3,278 (0.4%)
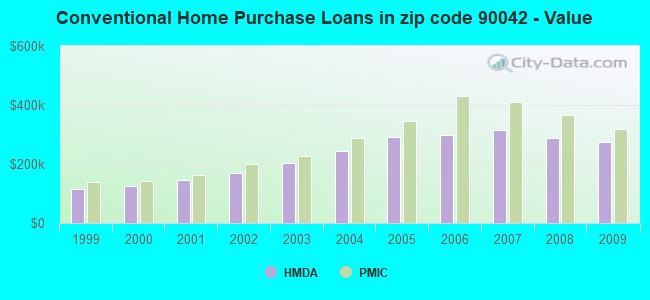
Estimated median house/condo value in 2022: $923,731
90042:
$923,731
California:
$715,900
According to our research of California and other state lists, there were 62 registered sex offenders living in 90042 zip code as of April 27, 2024. The ratio of all residents to sex offenders in zip code 90042 is 1,032 to 1. The ratio of registered sex offenders to all residents in this zip code is lower than the state average.
Median resident age:
This zip code:
38.3 years
California median age:
37.9 years
Average household size:
This zip code:
2.7 people
California:
2.8 people
Averages for the 2020 tax year for zip code 90042, filed in 2021:
Average Adjusted Gross Income (AGI) in 2020: $63,122 (Individual Income Tax Returns)
Here:
$63,122
State:
$95,910
Salary/wage: $58,429 (reported on 82.3% of returns)
Here:
$58,429
State:
$77,331
(% of AGI for various income ranges: 1158.8% for AGIs below $25k, 3971.2% for AGIs $25k-50k, 7521.5% for AGIs $50k-75k, 11434.1% for AGIs $75k-100k, 20753.1% for AGIs $100k-200k, 74660.5% for AGIs over 200k)
Taxable interest for individuals: $722 (reported on 28.0% of returns)
This zip code:
$722
California:
$2,294
(% of AGI for various income ranges: 10.0% for AGIs below $25k, 11.7% for AGIs $25k-50k, 30.7% for AGIs $50k-75k, 46.7% for AGIs $75k-100k, 79.1% for AGIs $100k-200k, 357.1% for AGIs over 200k)
Ordinary dividends: $3,677 (reported on 14.9% of returns)
Here:
$3,677
State:
$10,949
(% of AGI for various income ranges: 14.2% for AGIs below $25k, 20.5% for AGIs $25k-50k, 46.7% for AGIs $50k-75k, 94.5% for AGIs $75k-100k, 200.4% for AGIs $100k-200k, 1730.7% for AGIs over 200k)
Net capital gain/loss in AGI: +$11,915 (reported on 14.8% of returns)
Here:
+$11,915
State:
+$49,306
(% of AGI for various income ranges: 12.6% for AGIs below $25k, 17.9% for AGIs $25k-50k, 64.6% for AGIs $50k-75k, 120.6% for AGIs $75k-100k, 567.2% for AGIs $100k-200k, 8286.0% for AGIs over 200k)
Profit/loss from business: +$9,955 (reported on 25.2% of returns)
Here:
+$9,955
State:
+$15,671
(% of AGI for various income ranges: 282.4% for AGIs below $25k, 246.2% for AGIs $25k-50k, 338.0% for AGIs $50k-75k, 387.2% for AGIs $75k-100k, 748.1% for AGIs $100k-200k, 2945.5% for AGIs over 200k)
Taxable individual retirement arrangement distribution: $18,067 (reported on 3.4% of returns)
90042:
$18,067
California:
$23,505
(% of AGI for various income ranges: 26.1% for AGIs below $25k, 37.5% for AGIs $25k-50k, 69.8% for AGIs $50k-75k, 141.6% for AGIs $75k-100k, 300.5% for AGIs $100k-200k, 1055.7% for AGIs over 200k)
Self-employed (Keogh) retirement plans: $20,067 (reported on 0.6% of returns)
90042:
$20,067
California:
$30,163
(% of AGI for various income ranges: 4.1% for AGIs below $25k, 12.0% for AGIs $50k-75k, 40.8% for AGIs $100k-200k, 540.5% for AGIs over 200k)
Total itemized deductions: $28,808 (reported on 12.4% of returns)
Here:
$28,808
State:
$39,517
(% of AGI for various income ranges: 74.2% for AGIs below $25k, 138.2% for AGIs $25k-50k, 400.0% for AGIs $50k-75k, 869.9% for AGIs $75k-100k, 1986.3% for AGIs $100k-200k, 6732.6% for AGIs over 200k)
Charity contributions: $4,661 (reported on 10.0% of returns)
Here:
$4,661
State:
$12,598
(% of AGI for various income ranges: 4.0% for AGIs below $25k, 15.9% for AGIs $25k-50k, 47.5% for AGIs $50k-75k, 99.8% for AGIs $75k-100k, 237.1% for AGIs $100k-200k, 1178.6% for AGIs over 200k)
Taxes paid: $8,672 (reported on 12.4% of returns)
90042:
$8,672
State:
$8,807
(% of AGI for various income ranges: 16.0% for AGIs below $25k, 35.0% for AGIs $25k-50k, 118.5% for AGIs $50k-75k, 290.9% for AGIs $75k-100k, 657.5% for AGIs $100k-200k, 1840.0% for AGIs over 200k)
Earned income credit: $1,732 (reported on 15.5% of returns)
Here:
$1,732
State:
$2,074
(% of AGI for various income ranges: 81.7% for AGIs below $25k, 52.9% for AGIs $25k-50k, 0.5% for AGIs $50k-75k)
Percentage of individuals using paid preparers for their 2020 taxes: 93.0%
Here:
93%
State:
92%
(% for various income ranges: 91.0% for AGIs below $25k, 93.8% for AGIs $25k-50k, 93.2% for AGIs $50k-75k, 92.9% for AGIs $75k-100k, 94.6% for AGIs $100k-200k, 96.9% for AGIs over 200k)
Averages for the 2012 tax year for zip code 90042, filed in 2013:
Average Adjusted Gross Income (AGI) in 2012: $41,718 (Individual Income Tax Returns)
Here:
$41,718
State:
$72,726
Salary/wage: $40,633 (reported on 84.0% of returns)
Here:
$40,633
State:
$59,079
(% of AGI for various income ranges: 73.9% for AGIs below $25k, 86.3% for AGIs $25k-50k, 85.3% for AGIs $50k-75k, 85.8% for AGIs $75k-100k, 84.5% for AGIs $100k-200k, 61.2% for AGIs over 200k)
Taxable interest for individuals: $567 (reported on 24.8% of returns)
This zip code:
$567
California:
$2,146
(% of AGI for various income ranges: 0.5% for AGIs below $25k, 0.2% for AGIs $25k-50k, 0.3% for AGIs $50k-75k, 0.3% for AGIs $75k-100k, 0.3% for AGIs $100k-200k, 0.4% for AGIs over 200k)
Ordinary dividends: $2,540 (reported on 9.1% of returns)
Here:
$2,540
State:
$9,308
(% of AGI for various income ranges: 0.5% for AGIs below $25k, 0.4% for AGIs $25k-50k, 0.5% for AGIs $50k-75k, 0.5% for AGIs $75k-100k, 0.6% for AGIs $100k-200k, 1.3% for AGIs over 200k)
Net capital gain/loss in AGI: +$5,068 (reported on 7.3% of returns)
Here:
+$5,068
State:
+$30,460
(% of AGI for various income ranges: 0.3% for AGIs $50k-75k, 0.5% for AGIs $75k-100k, 1.0% for AGIs $100k-200k, 6.7% for AGIs over 200k)
Profit/loss from business: +$10,450 (reported on 21.6% of returns)
Here:
+$10,450
State:
+$17,064
(% of AGI for various income ranges: 15.8% for AGIs below $25k, 4.6% for AGIs $25k-50k, 3.0% for AGIs $50k-75k, 3.0% for AGIs $75k-100k, 3.0% for AGIs $100k-200k, 5.7% for AGIs over 200k)
Taxable individual retirement arrangement distribution: $12,565 (reported on 3.7% of returns)
90042:
$12,565
California:
$19,557
(% of AGI for various income ranges: 1.1% for AGIs below $25k, 1.1% for AGIs $25k-50k, 1.4% for AGIs $50k-75k, 1.0% for AGIs $75k-100k, 1.1% for AGIs $100k-200k, 1.0% for AGIs over 200k)
Self-employment retirement plans: $19,060 (reported on 0.4% of returns)
90042:
$19,060
California:
$24,530
(% of AGI for various income ranges: 0.2% for AGIs $50k-75k, 0.3% for AGIs $100k-200k, 0.9% for AGIs over 200k)
Total itemized deductions: $23,040 (28% of AGI, reported on 28.0% of returns)
Here:
$23,040
State:
$34,004
Here:
28.1% of AGI
State:
22.7% of AGI
(% of AGI for various income ranges: 7.2% for AGIs below $25k, 10.6% for AGIs $25k-50k, 16.4% for AGIs $50k-75k, 20.1% for AGIs $75k-100k, 20.9% for AGIs $100k-200k, 18.1% for AGIs over 200k)
Charity contributions: $2,300 (reported on 22.4% of returns)
Here:
$2,300
State:
$4,659
(% of AGI for various income ranges: 0.4% for AGIs below $25k, 0.9% for AGIs $25k-50k, 1.4% for AGIs $50k-75k, 1.6% for AGIs $75k-100k, 1.7% for AGIs $100k-200k, 1.5% for AGIs over 200k)
Taxes paid: $7,454 (reported on 27.9% of returns)
90042:
$7,454
State:
$14,448
(% of AGI for various income ranges: 1.4% for AGIs below $25k, 2.4% for AGIs $25k-50k, 4.6% for AGIs $50k-75k, 6.4% for AGIs $75k-100k, 7.9% for AGIs $100k-200k, 8.6% for AGIs over 200k)
Earned income credit: $2,255 (reported on 25.3% of returns)
Here:
$2,255
State:
$2,286
(% of AGI for various income ranges: 7.6% for AGIs below $25k, 1.2% for AGIs $25k-50k)
Percentage of individuals using paid preparers for their 2012 taxes: 72.4%
Here:
72%
State:
64%
(% for various income ranges: 73.7% for AGIs below $25k, 71.6% for AGIs $25k-50k, 70.3% for AGIs $50k-75k, 69.1% for AGIs $75k-100k, 72.9% for AGIs $100k-200k, 80.0% for AGIs over 200k)
Averages for the 2004 tax year for zip code 90042, filed in 2005:
Average Adjusted Gross Income (AGI) in 2004: $33,379 (Individual Income Tax Returns)
Here:
$33,379
State:
$58,600
Salary/wage: $33,027 (reported on 87.0% of returns)
Here:
$33,027
State:
$49,455
(% of AGI for various income ranges: 94.1% for AGIs below $10k, 83.4% for AGIs $10k-25k, 90.5% for AGIs $25k-50k, 90.2% for AGIs $50k-75k, 87.6% for AGIs $75k-100k, 73.8% for AGIs over 100k)
Taxable interest for individuals: $762 (reported on 31.1% of returns)
This zip code:
$762
California:
$2,365
(% of AGI for various income ranges: 2.3% for AGIs below $10k, 0.7% for AGIs $10k-25k, 0.5% for AGIs $25k-50k, 0.6% for AGIs $50k-75k, 0.7% for AGIs $75k-100k, 0.9% for AGIs over 100k)
Taxable dividends: $1,570 (reported on 9.9% of returns)
Here:
$1,570
State:
$4,746
(% of AGI for various income ranges: 1.3% for AGIs below $10k, 0.3% for AGIs $10k-25k, 0.3% for AGIs $25k-50k, 0.3% for AGIs $50k-75k, 0.6% for AGIs $75k-100k, 0.8% for AGIs over 100k)
Net capital gain/loss: +$7,231 (reported on 8.0% of returns)
Here:
+$7,231
State:
+$23,418
(% of AGI for various income ranges: -0.3% for AGIs below $10k, -0.1% for AGIs $10k-25k, 0.2% for AGIs $25k-50k, 0.5% for AGIs $50k-75k, 1.1% for AGIs $75k-100k, 8.4% for AGIs over 100k)
Profit/loss from business: +$8,908 (reported on 18.8% of returns)
Here:
+$8,908
State:
+$16,826
(% of AGI for various income ranges: 25.2% for AGIs below $10k, 10.0% for AGIs $10k-25k, 3.5% for AGIs $25k-50k, 2.4% for AGIs $50k-75k, 2.9% for AGIs $75k-100k, 4.9% for AGIs over 100k)
IRA payment deduction: $2,597 (reported on 2.2% of returns)
90042:
$2,597
California:
$3,192
(% of AGI for various income ranges: 0.2% for AGIs below $10k, 0.2% for AGIs $10k-25k, 0.2% for AGIs $25k-50k, 0.1% for AGIs $50k-75k, 0.1% for AGIs $75k-100k, 0.1% for AGIs over 100k)
Self-employed pension: $9,898 (reported on 0.5% of returns)
Here:
$9,898
California:
$17,688
(% of AGI for various income ranges: 0.0% for AGIs $10k-25k, 0.1% for AGIs $25k-50k, 0.1% for AGIs $50k-75k, 0.2% for AGIs $75k-100k, 0.5% for AGIs over 100k)
Total itemized deductions: $18,992 (31% of AGI, reported on 30.4% of returns)
Here:
$18,992
State:
$28,113
Here:
31.4% of AGI
State:
25.3% of AGI
(% of AGI for various income ranges: 12.0% for AGIs below $10k, 8.6% for AGIs $10k-25k, 15.4% for AGIs $25k-50k, 21.7% for AGIs $50k-75k, 23.0% for AGIs $75k-100k, 20.2% for AGIs over 100k)
Charity contributions deductions: $2,275 (4% of AGI, reported on 26.1% of returns)
Here:
$2,275
State:
$3,923
Here:
3.6% of AGI
State:
3.3% of AGI
(% of AGI for various income ranges: 0.5% for AGIs below $10k, 0.6% for AGIs $10k-25k, 1.5% for AGIs $25k-50k, 2.2% for AGIs $50k-75k, 2.6% for AGIs $75k-100k, 2.4% for AGIs over 100k)
Total tax: $4,060 (reported on 67.8% of returns)
90042:
$4,060
State:
$10,761
(% of AGI for various income ranges: 5.2% for AGIs below $10k, 3.8% for AGIs $10k-25k, 5.7% for AGIs $25k-50k, 8.5% for AGIs $50k-75k, 10.4% for AGIs $75k-100k, 15.6% for AGIs over 100k)
Earned income credit: $1,894 (reported on 26.9% of returns)
Here:
$1,894
State:
$1,763
Percentage of individuals using paid preparers for their 2004 taxes: 75.5%
Here:
76%
State:
66%
(% for various income ranges: 71.9% for AGIs below $10k, 78.0% for AGIs $10k-25k, 75.8% for AGIs $25k-50k, 74.1% for AGIs $50k-75k, 75.5% for AGIs $75k-100k, 76.0% for AGIs over 100k)
Likely homosexual households (counted as self-reported same-sex unmarried-partner households)
Lesbian couples: 0.4% of all households
Gay men: 0.5% of all households
Household received Food Stamps/SNAP in the past 12 months: 2,908 Household did not receive Food Stamps/SNAP in the past 12 months: 18,698
Women who had a birth in the past 12 months: 756 (560 now married, 195 unmarried) Women who did not have a birth in the past 12 months: 14,738 (5,150 now married, 9,616 unmarried)
Housing units in zip code 90042 with a mortgage: 6,835 (614 second mortgage, 109 home equity loan, 486 both second mortgage and home equity loan) Houses without a mortgage: 57
Median monthly owner costs for units with a mortgage: $2,985 Median monthly owner costs for units without a mortgage: $733
Residents with income below the poverty level in 2022:
This zip code:
10.7%
Whole state:
12.2%
Residents with income below 50% of the poverty level in 2022:
This zip code:
5.7%
Whole state:
6.2%
Median number of rooms in houses and condos:
Here:
5.1
State:
6.0
Median number of rooms in apartments:
Here:
3.4
State:
3.9
Notable locations in this zip code not listed on our city pages
Notable locations in zip code 90042: Garvanza Pumping Station (A), Northeast Community Police Station (B), Hathaway Home for Children (C), Hall of Letters (D), Arroyo Seco Regional Branch Los Angeles Public Library (E), Optimists Home for Boys (F), City of Los Angeles Fire Department Station 12 (G), Intercultural Community Center (H), Hameetman Science Center (I), Meridian Combination Childrens Center (J), Pisgah Home (K), Highland Theatre (L), Westminister House (M), Highland Park Rest Home (N). Display/hide their locations on the map
Churches in zip code 90042 include: Highland Park Full Gospel Church (A), Highland Park Church of the Nazarene (B), Covenant Baptist Church (C), Highland Park Four Square Gospel Church (D), Grace Presbyterian Church (E), Garvanza Methodist Church (F), New Apostolic Church (G), Lutheran Church of the Good Shepherd (H), Highland Park Church of God (I). Display/hide their locations on the map
Parks in zip code 90042 include: Arroyo Seco Park (1), Garvanza Park (2), Highland Park (3), Highland Park Recreation Center (4). Display/hide their locations on the map
5,417 married couples with children.
2,450 single-parent households (731 men, 1,719 women).
39.4% of residents of 90042 zip code speak English at home.
47.8% of residents speak Spanish at home (62% very well, 15% well, 18% not well, 5% not at all).
2.8% of residents speak other Indo-European language at home (77% very well, 17% well, 6% not well).
9.4% of residents speak Asian or Pacific Island language at home (53% very well, 26% well, 16% not well, 5% not at all).
0.5% of residents speak other language at home (89% very well, 11% well).
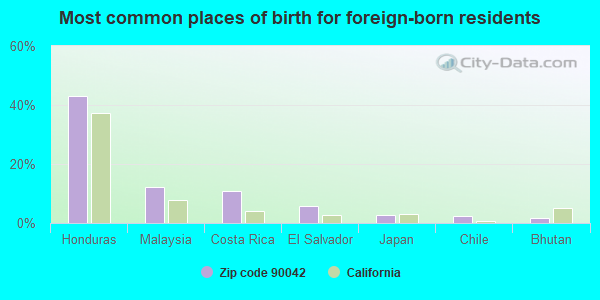
Foreign born population: 21,173 (36.1%) (55.7% of them are naturalized citizens)
Major facilities with environmental interests located in this zip code:
GARVANZA ELEM (317 N AVE 62 in LOS ANGELES, CA)
STATE MASTER (California - Hazardous Waste Tracking) - HAZARDOU WASTE PROGRAM (National Center for Education Statistics) - STATE ID-6017230 Large Quantity Generators, more that 1000 kg of hazardous waste/month (Resource Conservation and Recovery Act (tracking hazardous waste)) - notification Organizations: L A UNIFIED SCHOOL DISTRICT (CONTACT/OWNER)
, LOS ANGELES UNIFIED (SCHOOL DISTRICT)
Alternative names: LA USD GARVANZA EL
FRANKLIN NEW P C NO 1 (5531 MONTE VISTA ST in LOS ANGELES, CA)
STATE MASTER (California - Hazardous Waste Tracking) - HAZARDOU WASTE PROGRAM Large Quantity Generators, more that 1000 kg of hazardous waste/month (Resource Conservation and Recovery Act (tracking hazardous waste)) - notification Organizations: L A UNIFIED SCHOOL DISTRICT (CONTACT/OWNER)
HERBIE AUTO HAUS (5701 YORK BLVD in LOS ANGELES, CA)
STATE MASTER (California - Hazardous Waste Tracking) - HAZARDOU WASTE PROGRAM Small Quantity Generators, between 100 kg and 1000 kg of hazardous waste/month (Resource Conservation and Recovery Act (tracking hazardous waste)) - notification Business NAICS classification: GENERAL AUTOMOTIVE REPAIR. Organizations: HERBERT KNEBEL (CONTACT/OWNER)
Alternative names: HERBIE'S AUTOHAUS
LA USD BUSHNELL ELEM (5507 BUSHNELL WY in LOS ANGELES, CA)
STATE MASTER (California - Hazardous Waste Tracking) - HAZARDOU WASTE PROGRAM Small Quantity Generators, between 100 kg and 1000 kg of hazardous waste/month (Resource Conservation and Recovery Act (tracking hazardous waste)) - notification Alternative names: BUSHNELL WAY ELEMENTARY, LAUSD/ BUSHNELL WAY ELEM
LA USD FRANKLIN HS (820 N AVE in LOS ANGELES, CA)
STATE MASTER (California - Hazardous Waste Tracking) - HAZARDOU WASTE PROGRAM Small Quantity Generators, between 100 kg and 1000 kg of hazardous waste/month (Resource Conservation and Recovery Act (tracking hazardous waste)) - notification
LAUSD MONTE VISTA ELEM SCHOOL (5423 MONTE VISTA ST in LOS ANGELES, CA)
STATE MASTER (California - Hazardous Waste Tracking) - HAZARDOU WASTE PROGRAM Small Quantity Generators, between 100 kg and 1000 kg of hazardous waste/month (Resource Conservation and Recovery Act (tracking hazardous waste)) - notification Alternative names: MONTE VISTA STREET ELEMENTARY
LOS ANGELES USD BUCHANAN ELEM SCHOOL (5024 BUCHANAN ST in LOS ANGELES, CA)
STATE MASTER (California - Hazardous Waste Tracking) - HAZARDOU WASTE PROGRAM Small Quantity Generators, between 100 kg and 1000 kg of hazardous waste/month (Resource Conservation and Recovery Act (tracking hazardous waste)) - notification Organizations: LOS ANGELES UNIFIED SCHOOL DISTRICT (CONTACT/OWNER)
Alternative names: BUCHANAN STREET ELEMENTARY, LAUSD/ BUCHANAN ST ELEM
CAR TIQUE AUTOBODY (5025 N FIQUEROA in LOS ANGELES, CA)
STATE MASTER (California - Hazardous Waste Tracking) - HAZARDOU WASTE PROGRAM Small Quantity Generators, between 100 kg and 1000 kg of hazardous waste/month (Resource Conservation and Recovery Act (tracking hazardous waste)) - notification Business NAICS classification: AUTOMOTIVE BODY, PAINT, AND INTERIOR REPAIR AND MAINTENANCE. Organizations: GERALD GUBSER (CONTACT/OWNER)
EQUILON ENTERPRISES (6505 N FIGUEROA/MERIDIAN in LOS ANGELES, CA) . Federal Facility
STATE MASTER (California - Hazardous Waste Tracking) - HAZARDOU WASTE PROGRAM Small Quantity Generators, between 100 kg and 1000 kg of hazardous waste/month (Resource Conservation and Recovery Act (tracking hazardous waste)) - notification Organizations: EQUILON ENTERPRISES, LLC (CONTACT/OWNER)
Alternative names: SHELL OIL CO
MCGIBBONS AUTO BODY (5251 YORK BLVD in LOS ANGELES, CA)
STATE MASTER (California - Hazardous Waste Tracking) - HAZARDOU WASTE PROGRAM Small Quantity Generators, between 100 kg and 1000 kg of hazardous waste/month (Resource Conservation and Recovery Act (tracking hazardous waste)) Business NAICS classification: GENERAL AUTOMOTIVE REPAIR.
ANNANDALE ELEMENTARY (6125 POPPY PEAK DR. in LOS ANGELES, CA)
(National Center for Education Statistics) - STATE ID-6015838 Organizations: LOS ANGELES UNIFIED (SCHOOL DISTRICT)
FRANKLIN (BENJAMIN) SENIOR HIG (820 N. AVENUE 54 in LOS ANGELES, CA)
(National Center for Education Statistics) - STATE ID-1933043 Organizations: LOS ANGELES UNIFIED (SCHOOL DISTRICT)
HIGHLAND PARK CONTINUATION (928 N. AVENUE 53 in LOS ANGELES, CA)
(National Center for Education Statistics) - STATE ID-1931393 Organizations: LOS ANGELES UNIFIED (SCHOOL DISTRICT)
Housing units lacking complete plumbing facilities: 0.4% Housing units lacking complete kitchen facilities: 1.9%
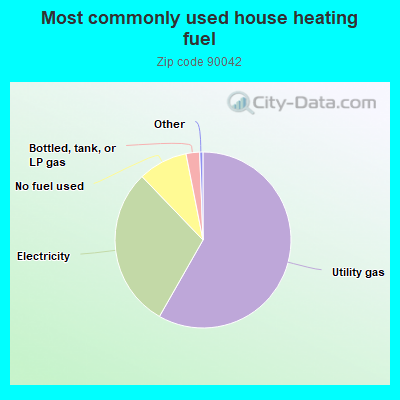
58.3%Utility gas
29.6%Electricity
9.1%No fuel used
2.5%Bottled, tank, or LP gas
Population in 1990: 60,003. Population change in the 1990s: +4,657 (+7.8%).
Place of birth for U.S.-born residents:
This state: 27,517
Northeast: 2,738
Midwest: 2,213
South: 2,374
West: 1,744
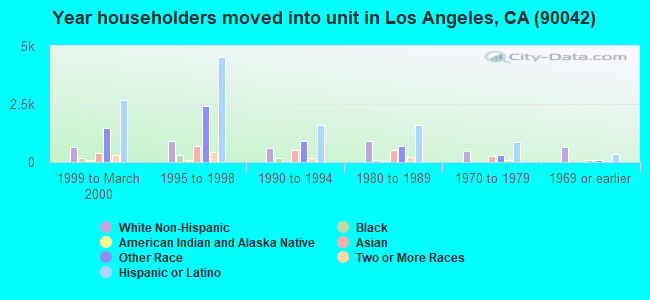
54% of the 90042 zip code residents lived in the same house 5 years ago. Out of people who lived in different houses, 90% lived in this county. Out of people who lived in different counties, 50% lived in California.
89% of the 90042 zip code residents lived in the same house 1 year ago. Out of people who lived in different houses, 70% moved from this county. Out of people who lived in different houses, 9% moved from different county within same state. Out of people who lived in different houses, 12% moved from different state. Out of people who lived in different houses, 9% moved from abroad.
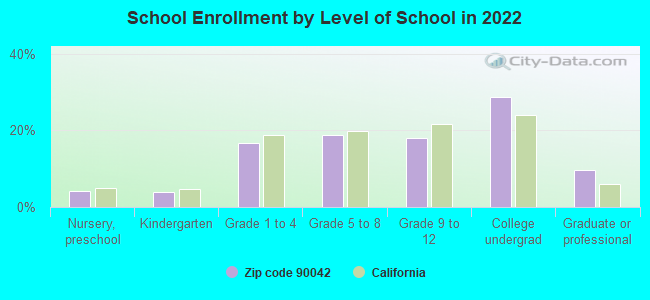
Private vs. public school enrollment:
Students in private schools in grades 1 to 8 (elementary and middle school): 399
Here:
9.3%
California:
10.5%
Students in private schools in grades 9 to 12 (high school): 281
Here:
12.9%
California:
8.5%
Students in private undergraduate colleges: 724
Here:
20.6%
California:
15.9%
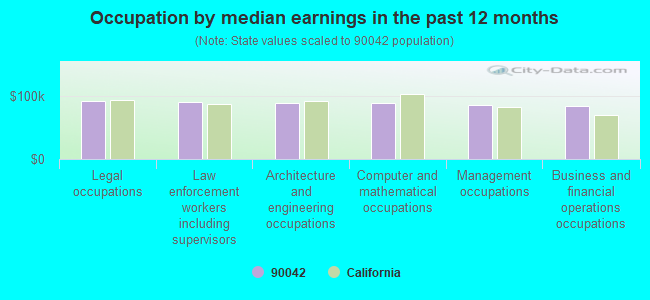
Occupation by median earnings in the past 12 months ($)
91,142Legal occupations
89,421Law enforcement workers including supervisors
88,248Architecture and engineering occupations
87,794Computer and mathematical occupations
84,840Management occupations
84,274Business and financial operations occupations
Companies with federal contracts located in this zip code:
WILDERNESS WORK SHOP (6916 N FIGUEROA ST in LOS ANGELES, CA; small business) : $4,590 in 10 contractsfrom 2004 to 2005
Contracts for Laundry and DryCleaning Services by Army Signed by year:2000: $0; 2001: $0; 2002: $0; 2003: $0; 2004: $3,504; 2005: $1,086; 2006: $0.
Biggest contracts:
$967 with Army for Laundry and DryCleaning Services. Signed on 2004-07-08. Completion date: 2004-01-31.
$904, same as above.Signed on 2004-07-08. Completion date: 2003-12-31.
$900, same as above.Signed on 2005-03-06. Completion date: 2005-02-28.
$409, same as above.Signed on 2004-07-08. Completion date: 2004-03-01.
THE CREATIVE SOLUTION (4041 VIA MARISOL SUITE 112 in LOS ANGELES, CA; small business)
$3,800 with Navy for Educational Services. Signed on 2005-01-14. Completion date: 2005-01-20.
Top industries in this zip code by the number of employees in 2005:
2005 - 2018 National Fire Incident Reporting System (NFIRS) incidents
Based on the data from the years 2005 - 2018 the average number of fire incidents per year is 108. The highest number of fire incidents - 150 took place in 2007, and the least - 54 in 2016. The data has a dropping trend.
When looking into fire subcategories, the most reports belonged to: Structure Fires (45.5%), and Outside Fires (29.8%).
Fire incident types reported to NFIRS in Zip Code 90042


 Nearest zip codes: 90041, 90031, 90065, 91105, 91030, 90032.


 Based on the data from the years 2005 - 2018 the average number of fire incidents per year is 108. The highest number of fire incidents - 150 took place in 2007, and the least - 54 in 2016. The data has a dropping trend.
 When looking into fire subcategories, the most reports belonged to: Structure Fires (45.5%), and Outside Fires (29.8%).