Estimated zip code population in 2022: 44,524 Zip code population in 2010: 45,527 Zip code population in 2000: 47,524
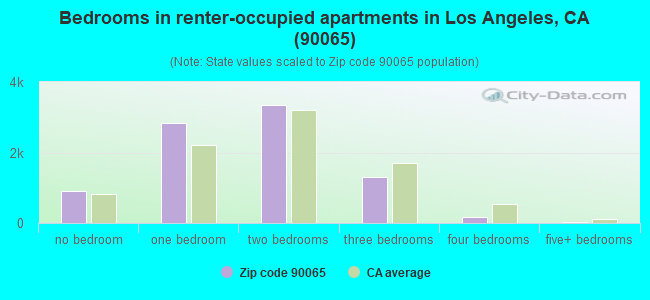
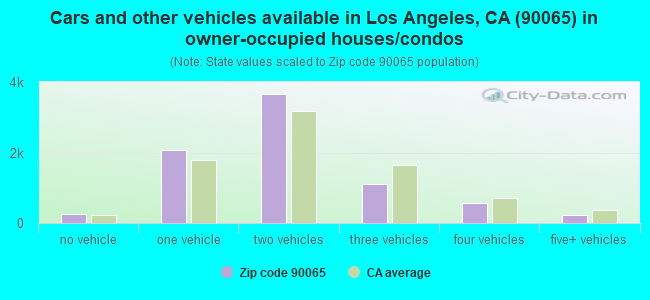
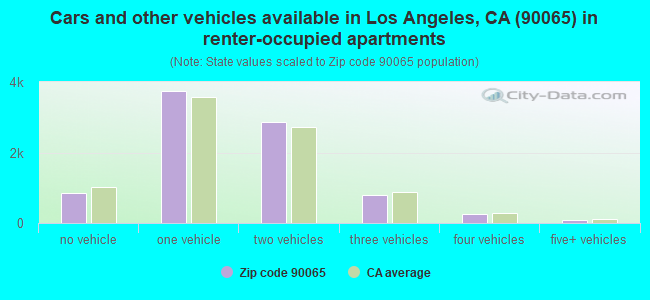
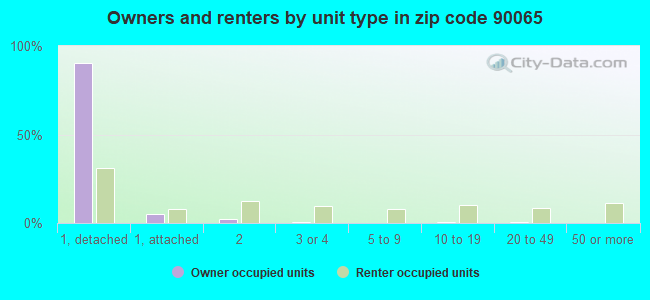
Houses and condos: 17,335 Renter-occupied apartments: 8,606
% of renters here:
52%
State:
44%
March 2022 cost of living index in zip code 90065: 139.3 (high, U.S. average is 100)
Land area: 5.3 sq. mi. Water area: 0.0 sq. mi.
Population density: 8,435 people per square mile
(high).
OSM Map
General Map
Google Map
MSN Map
OSM Map
General Map
Google Map
MSN Map
OSM Map
General Map
Google Map
MSN Map
OSM Map
General Map
Google Map
MSN Map
Please wait while loading the map...
Real estate property taxes paid for housing units in 2022:
This zip code:
0.5% ($5,713)
California:
0.7% ($4,831)
Median real estate property taxes paid for housing units with mortgages in 2022: $7,178 (0.7%) Median real estate property taxes paid for housing units with no mortgage in 2022: $3,180 (0.3%)
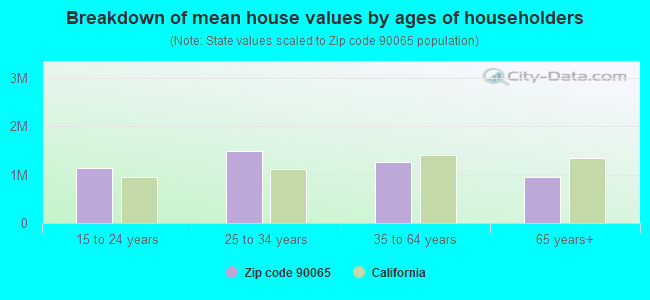
Estimated median house/condo value in 2022: $1,041,872
90065:
$1,041,872
California:
$715,900
According to our research of California and other state lists, there were 53 registered sex offenders living in 90065 zip code as of April 27, 2024. The ratio of all residents to sex offenders in zip code 90065 is 899 to 1. The ratio of registered sex offenders to all residents in this zip code is near the state average.
Median resident age:
This zip code:
39.3 years
California median age:
37.9 years
Average household size:
This zip code:
2.7 people
California:
2.8 people
Averages for the 2020 tax year for zip code 90065, filed in 2021:
Average Adjusted Gross Income (AGI) in 2020: $71,042 (Individual Income Tax Returns)
Here:
$71,042
State:
$95,910
Salary/wage: $63,323 (reported on 80.7% of returns)
Here:
$63,323
State:
$77,331
(% of AGI for various income ranges: 1142.7% for AGIs below $25k, 4030.3% for AGIs $25k-50k, 7479.2% for AGIs $50k-75k, 10954.1% for AGIs $75k-100k, 20454.3% for AGIs $100k-200k, 82722.6% for AGIs over 200k)
Taxable interest for individuals: $1,030 (reported on 30.4% of returns)
This zip code:
$1,030
California:
$2,294
(% of AGI for various income ranges: 13.7% for AGIs below $25k, 16.8% for AGIs $25k-50k, 33.2% for AGIs $50k-75k, 55.9% for AGIs $75k-100k, 136.1% for AGIs $100k-200k, 563.5% for AGIs over 200k)
Ordinary dividends: $4,668 (reported on 16.9% of returns)
Here:
$4,668
State:
$10,949
(% of AGI for various income ranges: 17.3% for AGIs below $25k, 28.9% for AGIs $25k-50k, 79.8% for AGIs $50k-75k, 147.5% for AGIs $75k-100k, 314.0% for AGIs $100k-200k, 1830.5% for AGIs over 200k)
Net capital gain/loss in AGI: +$18,130 (reported on 16.5% of returns)
Here:
+$18,130
State:
+$49,306
(% of AGI for various income ranges: 8.8% for AGIs below $25k, 31.0% for AGIs $25k-50k, 91.0% for AGIs $50k-75k, 212.4% for AGIs $75k-100k, 513.4% for AGIs $100k-200k, 12442.1% for AGIs over 200k)
Profit/loss from business: +$12,409 (reported on 25.1% of returns)
Here:
+$12,409
State:
+$15,671
(% of AGI for various income ranges: 289.8% for AGIs below $25k, 203.6% for AGIs $25k-50k, 247.2% for AGIs $50k-75k, 529.1% for AGIs $75k-100k, 1147.4% for AGIs $100k-200k, 4756.0% for AGIs over 200k)
Taxable individual retirement arrangement distribution: $18,898 (reported on 4.5% of returns)
90065:
$18,898
California:
$23,505
(% of AGI for various income ranges: 26.4% for AGIs below $25k, 43.6% for AGIs $25k-50k, 111.9% for AGIs $50k-75k, 250.2% for AGIs $75k-100k, 466.7% for AGIs $100k-200k, 983.5% for AGIs over 200k)
Self-employed (Keogh) retirement plans: $25,476 (reported on 0.9% of returns)
90065:
$25,476
California:
$30,163
(% of AGI for various income ranges: 20.6% for AGIs $50k-75k, 77.0% for AGIs $100k-200k, 884.2% for AGIs over 200k)
Total itemized deductions: $30,412 (reported on 15.2% of returns)
Here:
$30,412
State:
$39,517
(% of AGI for various income ranges: 88.0% for AGIs below $25k, 154.7% for AGIs $25k-50k, 486.6% for AGIs $50k-75k, 1090.0% for AGIs $75k-100k, 2439.3% for AGIs $100k-200k, 8224.4% for AGIs over 200k)
Charity contributions: $4,942 (reported on 12.6% of returns)
Here:
$4,942
State:
$12,598
(% of AGI for various income ranges: 3.8% for AGIs below $25k, 17.8% for AGIs $25k-50k, 60.6% for AGIs $50k-75k, 115.8% for AGIs $75k-100k, 315.5% for AGIs $100k-200k, 1371.2% for AGIs over 200k)
Taxes paid: $8,776 (reported on 15.1% of returns)
90065:
$8,776
State:
$8,807
(% of AGI for various income ranges: 19.4% for AGIs below $25k, 38.6% for AGIs $25k-50k, 141.5% for AGIs $50k-75k, 345.0% for AGIs $75k-100k, 766.1% for AGIs $100k-200k, 2178.6% for AGIs over 200k)
Earned income credit: $1,836 (reported on 15.2% of returns)
Here:
$1,836
State:
$2,074
(% of AGI for various income ranges: 85.7% for AGIs below $25k, 56.6% for AGIs $25k-50k, 0.6% for AGIs $50k-75k)
Percentage of individuals using paid preparers for their 2020 taxes: 92.5%
Here:
92%
State:
92%
(% for various income ranges: 90.4% for AGIs below $25k, 92.8% for AGIs $25k-50k, 93.7% for AGIs $50k-75k, 93.3% for AGIs $75k-100k, 93.8% for AGIs $100k-200k, 95.9% for AGIs over 200k)
Averages for the 2012 tax year for zip code 90065, filed in 2013:
Average Adjusted Gross Income (AGI) in 2012: $49,796 (Individual Income Tax Returns)
Here:
$49,796
State:
$72,726
Salary/wage: $46,195 (reported on 83.7% of returns)
Here:
$46,195
State:
$59,079
(% of AGI for various income ranges: 74.9% for AGIs below $25k, 85.0% for AGIs $25k-50k, 81.3% for AGIs $50k-75k, 80.1% for AGIs $75k-100k, 79.7% for AGIs $100k-200k, 62.1% for AGIs over 200k)
Taxable interest for individuals: $756 (reported on 29.2% of returns)
This zip code:
$756
California:
$2,146
(% of AGI for various income ranges: 0.6% for AGIs below $25k, 0.4% for AGIs $25k-50k, 0.4% for AGIs $50k-75k, 0.5% for AGIs $75k-100k, 0.4% for AGIs $100k-200k, 0.5% for AGIs over 200k)
Ordinary dividends: $3,306 (reported on 12.2% of returns)
Here:
$3,306
State:
$9,308
(% of AGI for various income ranges: 0.7% for AGIs below $25k, 0.6% for AGIs $25k-50k, 0.7% for AGIs $50k-75k, 0.7% for AGIs $75k-100k, 0.8% for AGIs $100k-200k, 1.4% for AGIs over 200k)
Net capital gain/loss in AGI: +$5,443 (reported on 10.0% of returns)
Here:
+$5,443
State:
+$30,460
(% of AGI for various income ranges: 0.1% for AGIs $25k-50k, 0.2% for AGIs $50k-75k, 0.4% for AGIs $75k-100k, 0.8% for AGIs $100k-200k, 4.9% for AGIs over 200k)
Profit/loss from business: +$11,541 (reported on 22.1% of returns)
Here:
+$11,541
State:
+$17,064
(% of AGI for various income ranges: 13.6% for AGIs below $25k, 5.2% for AGIs $25k-50k, 3.3% for AGIs $50k-75k, 3.7% for AGIs $75k-100k, 4.1% for AGIs $100k-200k, 3.6% for AGIs over 200k)
Taxable individual retirement arrangement distribution: $13,679 (reported on 5.1% of returns)
90065:
$13,679
California:
$19,557
(% of AGI for various income ranges: 1.2% for AGIs below $25k, 1.0% for AGIs $25k-50k, 1.5% for AGIs $50k-75k, 1.4% for AGIs $75k-100k, 1.7% for AGIs $100k-200k, 1.4% for AGIs over 200k)
Self-employment retirement plans: $15,507 (reported on 0.7% of returns)
90065:
$15,507
California:
$24,530
(% of AGI for various income ranges: 0.1% for AGIs below $25k, 0.2% for AGIs $50k-75k, 0.3% for AGIs $100k-200k, 0.7% for AGIs over 200k)
Total itemized deductions: $25,991 (26% of AGI, reported on 31.6% of returns)
Here:
$25,991
State:
$34,004
Here:
26.3% of AGI
State:
22.7% of AGI
(% of AGI for various income ranges: 7.3% for AGIs below $25k, 11.0% for AGIs $25k-50k, 17.5% for AGIs $50k-75k, 19.5% for AGIs $75k-100k, 21.2% for AGIs $100k-200k, 18.0% for AGIs over 200k)
Charity contributions: $2,598 (reported on 26.1% of returns)
Here:
$2,598
State:
$4,659
(% of AGI for various income ranges: 0.4% for AGIs below $25k, 0.9% for AGIs $25k-50k, 1.5% for AGIs $50k-75k, 1.7% for AGIs $75k-100k, 1.8% for AGIs $100k-200k, 1.5% for AGIs over 200k)
Taxes paid: $9,248 (reported on 31.4% of returns)
90065:
$9,248
State:
$14,448
(% of AGI for various income ranges: 1.7% for AGIs below $25k, 2.4% for AGIs $25k-50k, 4.9% for AGIs $50k-75k, 6.5% for AGIs $75k-100k, 8.2% for AGIs $100k-200k, 9.0% for AGIs over 200k)
Earned income credit: $2,244 (reported on 22.4% of returns)
Here:
$2,244
State:
$2,286
(% of AGI for various income ranges: 7.0% for AGIs below $25k, 1.2% for AGIs $25k-50k)
Percentage of individuals using paid preparers for their 2012 taxes: 73.6%
Here:
74%
State:
64%
(% for various income ranges: 73.1% for AGIs below $25k, 73.9% for AGIs $25k-50k, 72.1% for AGIs $50k-75k, 72.7% for AGIs $75k-100k, 75.2% for AGIs $100k-200k, 81.6% for AGIs over 200k)
Averages for the 2004 tax year for zip code 90065, filed in 2005:
Average Adjusted Gross Income (AGI) in 2004: $39,288 (Individual Income Tax Returns)
Here:
$39,288
State:
$58,600
Salary/wage: $37,529 (reported on 85.3% of returns)
Here:
$37,529
State:
$49,455
(% of AGI for various income ranges: 91.1% for AGIs below $10k, 82.9% for AGIs $10k-25k, 88.8% for AGIs $25k-50k, 85.1% for AGIs $50k-75k, 83.1% for AGIs $75k-100k, 71.7% for AGIs over 100k)
Taxable interest for individuals: $1,065 (reported on 36.3% of returns)
This zip code:
$1,065
California:
$2,365
(% of AGI for various income ranges: 2.2% for AGIs below $10k, 1.0% for AGIs $10k-25k, 0.7% for AGIs $25k-50k, 1.0% for AGIs $50k-75k, 1.0% for AGIs $75k-100k, 1.1% for AGIs over 100k)
Taxable dividends: $2,232 (reported on 13.8% of returns)
Here:
$2,232
State:
$4,746
(% of AGI for various income ranges: 2.0% for AGIs below $10k, 0.5% for AGIs $10k-25k, 0.4% for AGIs $25k-50k, 0.6% for AGIs $50k-75k, 0.8% for AGIs $75k-100k, 1.3% for AGIs over 100k)
Net capital gain/loss: +$7,690 (reported on 11.8% of returns)
Here:
+$7,690
State:
+$23,418
(% of AGI for various income ranges: -1.2% for AGIs below $10k, 0.0% for AGIs $10k-25k, 0.1% for AGIs $25k-50k, 0.5% for AGIs $50k-75k, 1.0% for AGIs $75k-100k, 6.9% for AGIs over 100k)
Profit/loss from business: +$10,418 (reported on 19.7% of returns)
Here:
+$10,418
State:
+$16,826
(% of AGI for various income ranges: 23.3% for AGIs below $10k, 8.7% for AGIs $10k-25k, 4.4% for AGIs $25k-50k, 3.9% for AGIs $50k-75k, 3.2% for AGIs $75k-100k, 4.8% for AGIs over 100k)
IRA payment deduction: $2,808 (reported on 2.4% of returns)
90065:
$2,808
California:
$3,192
(% of AGI for various income ranges: 0.2% for AGIs below $10k, 0.1% for AGIs $10k-25k, 0.3% for AGIs $25k-50k, 0.2% for AGIs $50k-75k, 0.2% for AGIs $75k-100k, 0.1% for AGIs over 100k)
Self-employed pension: $12,109 (reported on 0.9% of returns)
Here:
$12,109
California:
$17,688
(% of AGI for various income ranges: 0.1% for AGIs $10k-25k, 0.1% for AGIs $25k-50k, 0.2% for AGIs $50k-75k, 0.2% for AGIs $75k-100k, 0.6% for AGIs over 100k)
Total itemized deductions: $21,914 (30% of AGI, reported on 33.8% of returns)
Here:
$21,914
State:
$28,113
Here:
29.7% of AGI
State:
25.3% of AGI
(% of AGI for various income ranges: 17.7% for AGIs below $10k, 9.7% for AGIs $10k-25k, 15.5% for AGIs $25k-50k, 22.2% for AGIs $50k-75k, 24.5% for AGIs $75k-100k, 21.2% for AGIs over 100k)
Charity contributions deductions: $2,741 (4% of AGI, reported on 29.6% of returns)
Here:
$2,741
State:
$3,923
Here:
3.5% of AGI
State:
3.3% of AGI
(% of AGI for various income ranges: 0.5% for AGIs below $10k, 0.8% for AGIs $10k-25k, 1.7% for AGIs $25k-50k, 2.5% for AGIs $50k-75k, 2.9% for AGIs $75k-100k, 2.5% for AGIs over 100k)
Total tax: $5,633 (reported on 69.0% of returns)
90065:
$5,633
State:
$10,761
(% of AGI for various income ranges: 5.5% for AGIs below $10k, 3.5% for AGIs $10k-25k, 6.0% for AGIs $25k-50k, 8.9% for AGIs $50k-75k, 10.4% for AGIs $75k-100k, 16.4% for AGIs over 100k)
Earned income credit: $1,876 (reported on 22.9% of returns)
Here:
$1,876
State:
$1,763
Percentage of individuals using paid preparers for their 2004 taxes: 75.5%
Here:
76%
State:
66%
(% for various income ranges: 70.3% for AGIs below $10k, 78.5% for AGIs $10k-25k, 76.1% for AGIs $25k-50k, 74.2% for AGIs $50k-75k, 74.9% for AGIs $75k-100k, 77.0% for AGIs over 100k)
Likely homosexual households (counted as self-reported same-sex unmarried-partner households)
Lesbian couples: 0.1% of all households
Gay men: 0.5% of all households
Household received Food Stamps/SNAP in the past 12 months: 1,968 Household did not receive Food Stamps/SNAP in the past 12 months: 14,488
Women who had a birth in the past 12 months: 628 (474 now married, 153 unmarried) Women who did not have a birth in the past 12 months: 10,608 (3,649 now married, 6,982 unmarried)
Housing units in zip code 90065 with a mortgage: 5,499 (734 second mortgage, 42 home equity loan, 673 both second mortgage and home equity loan) Houses without a mortgage: 82
Median monthly owner costs for units with a mortgage: $3,521 Median monthly owner costs for units without a mortgage: $757
Residents with income below the poverty level in 2022:
This zip code:
13.5%
Whole state:
12.2%
Residents with income below 50% of the poverty level in 2022:
This zip code:
7.4%
Whole state:
6.2%
Median number of rooms in houses and condos:
Here:
5.4
State:
6.0
Median number of rooms in apartments:
Here:
3.5
State:
3.9
Notable locations in this zip code not listed on our city pages
Notable locations in zip code 90065: Southern Pacific Shops (A), Braun Research Library (B), Cypress Park Branch Los Angeles Public Library (C), Premier Ambulance Service (D), MEDI - Star Ambulance Service (E), Southwest Museum (F), City of Los Angeles Fire Department Station 50 (G), Casa de Adobe (H), City of Los Angeles Fire Department Station 44 (I), Los Angeles Municipal Arraignment Court (J), Saint Bernard's Hall (K), Northeast YMCA (L). Display/hide their locations on the map
Churches in zip code 90065 include: Highland View Pentecostal Assembly Church (A), Kingdom Hall of Jehovahs Witness (B), Divine Saviour Catholic Church (C), Cypress Park Christian Church (D), Mount Washington Four Square Church (E), Saint Bernard's Roman Catholic Church (F). Display/hide their locations on the map
Parks in zip code 90065 include: Rio de Los Angeles State Park (1), Poplar Recreation Center (2), Smith Recreation Center (3), Sycamore Grove Park (4), Verdugo Recreation Center (5), Carlin Smith Playground (6), Cleland Avenue Bicentennial Park (7), Cypress Park (8), Glassell Park (9). Display/hide their locations on the map
4,490 married couples with children.
2,069 single-parent households (497 men, 1,572 women).
43.3% of residents of 90065 zip code speak English at home.
41.6% of residents speak Spanish at home (59% very well, 17% well, 18% not well, 6% not at all).
4.4% of residents speak other Indo-European language at home (82% very well, 11% well, 8% not well).
10.0% of residents speak Asian or Pacific Island language at home (51% very well, 29% well, 16% not well, 5% not at all).
0.8% of residents speak other language at home (68% very well, 18% well, 12% not well, 2% not at all).
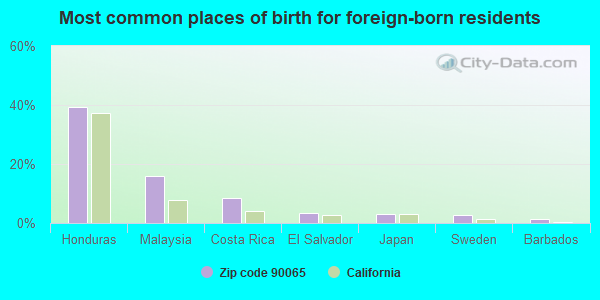
Foreign born population: 15,556 (34.9%) (60.0% of them are naturalized citizens)
Major facilities with environmental interests located in this zip code:
APPLIED GRAPHICS TECHNOLOGIES (3116 W AVE 32 in LOS ANGELES, CA)
AIR MAJOR (AIRS/AFS) STATE MASTER (California - Hazardous Waste Tracking) - HAZARDOU WASTE PROGRAM CRITERIA AND HAZARDOUS AIR POLLUTANT INVENTORY (Inventory of air pollution sources) Large Quantity Generators, more that 1000 kg of hazardous waste/month (Resource Conservation and Recovery Act (tracking hazardous waste)) - notification Business SIC classification: COMMERCIAL PRINTING, LITHOGRAPHIC; PLATEMAKING AND RELATED SERVICES Organizations: APPLIED GRAPHICS TECH INC (CONTACT/OWNER)
Alternative names: SEVEN WORLDWIDE, SCHAWKWORLDWIDE
ADAMS E S (632 N AVE 50 in LOS ANGELES, CA)
STATE MASTER (California - Hazardous Waste Tracking) - HAZARDOU WASTE PROGRAM Large Quantity Generators, more that 1000 kg of hazardous waste/month (Resource Conservation and Recovery Act (tracking hazardous waste)) - notification Organizations: L A UNIFIED SCHOOL DISTRICT (CONTACT/OWNER)
Alternative names: LA USD ALDAMA ELEM, LAUSD/ ALDAMA ELEM
LOS ANGELES USD ARAGON ELEM SCHOOL (1118 ARAGON AVE in LOS ANGELES, CA)
(Geographic Names Information System) STATE MASTER (California - Hazardous Waste Tracking) - HAZARDOU WASTE PROGRAM Small Quantity Generators, between 100 kg and 1000 kg of hazardous waste/month (Resource Conservation and Recovery Act (tracking hazardous waste)) - notification Organizations: LOS ANGELES UNIFIED SCHOOL DISTRICT (CONTACT/OWNER)
Alternative names: ARAGON AVENUE ELEMENTARY, ARAGON AVENUE ELEMENTARY SCHOOL, LAUSD/ ARAGON AVE ELEM
GORY ELECTRIC MOTORS (2015 SAN FERNANDO RD in LOS ANGELES, CA)
STATE MASTER (California - Hazardous Waste Tracking) - HAZARDOU WASTE PROGRAM CRITERIA AND HAZARDOUS AIR POLLUTANT INVENTORY (Inventory of air pollution sources) Small Quantity Generators, between 100 kg and 1000 kg of hazardous waste/month (Resource Conservation and Recovery Act (tracking hazardous waste)) - notification Business SIC classification: ARMATURE REWINDING SHOPS Organizations: MOORE LEE D (CONTACT/OWNER)
LOS ANGELES USD LORETO ELEM SCHOOL (3408 ARROYO SECO AVE in LOS ANGELES, CA)
STATE MASTER (California - Hazardous Waste Tracking) - HAZARDOU WASTE PROGRAM Small Quantity Generators, between 100 kg and 1000 kg of hazardous waste/month (Resource Conservation and Recovery Act (tracking hazardous waste)) - notification Organizations: LOS ANGELES UNIFIED SCHOOL DISTRICT (CONTACT/OWNER)
Alternative names: LAUSD/ LORETO ST ELEM, LORETO STREET ELEMENTARY
K T INDUSTRIES (3203 FLETCHER DR in LOS ANGELES, CA)
STATE MASTER (California - Hazardous Waste Tracking) - HAZARDOU WASTE PROGRAM Small Quantity Generators, between 100 kg and 1000 kg of hazardous waste/month (Resource Conservation and Recovery Act (tracking hazardous waste)) - notification Business NAICS classification: SWITCHGEAR AND SWITCHBOARD APPARATUS MANUFACTURING. Organizations: ROBERT H WARREN (CONTACT/OWNER)
LOS ANGELES USD FLETCHER ELEM SCHOOL (3350 FLETCHER DR in LOS ANGELES, CA)
STATE MASTER (California - Hazardous Waste Tracking) - HAZARDOU WASTE PROGRAM Small Quantity Generators, between 100 kg and 1000 kg of hazardous waste/month (Resource Conservation and Recovery Act (tracking hazardous waste)) - notification Organizations: LOS ANGELES UNIFIED SCHOOL DISTRICT (CONTACT/OWNER)
Alternative names: FLETCHER DRIVE ELEMENTARY, LAUSD/ FLETCHER DRIVE ELEM
LOS ANGELES NORTHEAST POLICE STATION (3353 SAN FERNANDO ROAD in LOS ANGELES, CA)
STATE MASTER (California - Hazardous Waste Tracking) - HAZARDOU WASTE PROGRAM Small Quantity Generators, between 100 kg and 1000 kg of hazardous waste/month (Resource Conservation and Recovery Act (tracking hazardous waste)) - notification Organizations: CITY OF LOS ANGELES (CONTACT/OWNER)
Alternative names: CITY OF LA GENERAL SERVICES, LA NORTHEAST POLICE STATION
LA USD GLASSELL PARK EL (2211 W AVE 30 in LOS ANGELES, CA)
STATE MASTER (California - Hazardous Waste Tracking) - HAZARDOU WASTE PROGRAM Small Quantity Generators, between 100 kg and 1000 kg of hazardous waste/month (Resource Conservation and Recovery Act (tracking hazardous waste)) - notification Alternative names: GLASSELL PARK ELEMENTARY, LAUSD/GLASSELL PARK ELEM
LOS ANGELES USD NIGHTINGAL JR HG SCHOOL (3311 N FIGUEROA ST in LOS ANGELES, CA)
STATE MASTER (California - Hazardous Waste Tracking) - HAZARDOU WASTE PROGRAM Small Quantity Generators, between 100 kg and 1000 kg of hazardous waste/month (Resource Conservation and Recovery Act (tracking hazardous waste)) - notification Organizations: LOS ANGELES UNIFIED SCHOOL DISTRICT (CONTACT/OWNER)
Alternative names: LAUSD/NIGHTINGALE JH
LOS ANGELES STRIPPING AND FINISHING CTR (1120 N SAN FERNANDO RD in LOS ANGELES, CA)
STATE MASTER (California - Hazardous Waste Tracking) - HAZARDOU WASTE PROGRAM Small Quantity Generators, between 100 kg and 1000 kg of hazardous waste/month (Resource Conservation and Recovery Act (tracking hazardous waste)) - notification Organizations: RAND LUKASIEWICZ (CONTACT/OWNER)
LIZARDE AUTO SVC (2821 N FIGUEROA ST in LOS ANGELES, CA)
STATE MASTER (California - Hazardous Waste Tracking) - HAZARDOU WASTE PROGRAM Small Quantity Generators, between 100 kg and 1000 kg of hazardous waste/month (Resource Conservation and Recovery Act (tracking hazardous waste)) - notification Business NAICS classification: GENERAL AUTOMOTIVE REPAIR. Organizations: GUS LIZARDE (CONTACT/OWNER)
CHEVRON STATION 90851 (3100 N SAN FERNANDO RD in LOS ANGELES, CA)
STATE MASTER (California - Hazardous Waste Tracking) - HAZARDOU WASTE PROGRAM Small Quantity Generators, between 100 kg and 1000 kg of hazardous waste/month (Resource Conservation and Recovery Act (tracking hazardous waste)) - notification Organizations: CHEVRON PRODUCTS CO (CONTACT/OWNER)
Housing units lacking complete plumbing facilities: 0.8% Housing units lacking complete kitchen facilities: 2.3%
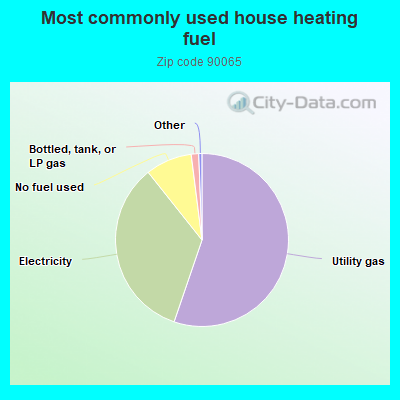
55.3%Utility gas
34.1%Electricity
8.7%No fuel used
1.4%Bottled, tank, or LP gas
Population in 1990: 45,578. Population change in the 1990s: +1,946 (+4.3%).
Place of birth for U.S.-born residents:
This state: 21,620
Northeast: 1,668
Midwest: 1,659
South: 1,823
West: 1,484
61% of the 90065 zip code residents lived in the same house 5 years ago. Out of people who lived in different houses, 90% lived in this county. Out of people who lived in different counties, 50% lived in California.
91% of the 90065 zip code residents lived in the same house 1 year ago. Out of people who lived in different houses, 78% moved from this county. Out of people who lived in different houses, 4% moved from different county within same state. Out of people who lived in different houses, 13% moved from different state. Out of people who lived in different houses, 3% moved from abroad.
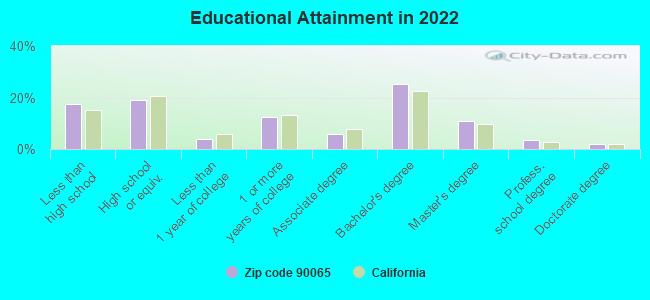
Private vs. public school enrollment:
Students in private schools in grades 1 to 8 (elementary and middle school): 594
Here:
17.8%
California:
10.5%
Students in private schools in grades 9 to 12 (high school): 253
Here:
14.3%
California:
8.5%
Students in private undergraduate colleges: 342
Here:
17.8%
California:
15.9%
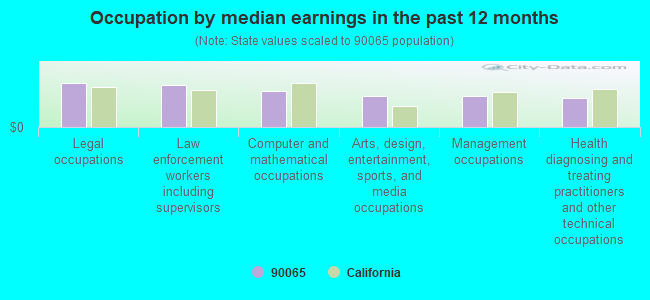
Occupation by median earnings in the past 12 months ($)
133,154Legal occupations
126,458Law enforcement workers including supervisors
109,748Computer and mathematical occupations
95,091Arts, design, entertainment, sports, and media occupations
93,103Management occupations
88,952Health diagnosing and treating practitioners and other technical occupations
Companies with biggest federal contracts located in this zip code (LOS ANGELES, CA):
J A M FIRE PROTECTION INC (3221 N SAN FERNANDO RD; small business) : $646,201 in 3 contractsfrom 2003 to 2004
$520,000 with Air Force for Maintenance, Repair or Alteration of Real Property -- Other Airfield Structures. Signed on 2003-07-31. Completion date: 2003-11-19.
$120,423, same as above.Signed on 2004-03-15. Completion date: 2004-06-22.
$5,778, same as above.Signed on 2004-08-09. Completion date: 2004-08-31.
CNS COMPUTER, INC (3421 N SAN FERNANDO RD # H; small business) : $230,762 in 3 contractsfrom 2004 to 2005
$114,230 with Air Force for ADP Components. Signed on 2004-08-30. Completion date: 2004-09-29.
$100,024 with Army for Maintenance, Repair and Rebuilding of Equipment -- Automatic Data Processing Equipment (Including Firmware), Software, Supplies and Support Equipment. Taking place in MD. Signed on 2004-12-14. Completion date: 2005-09-30.
$16,508 with Navy for Hardware, Commercial. Signed on 2005-08-25. Completion date: 2005-09-30.
SAVE-MORE WHOLESALE ELECTRIC (3421 SAN FERNANDO RD., UNI; small business)
$128,619 with Air Force for Transformers: Distribution and Power Station. Signed on 2000-05-01. Completion date: 2000-10-31.
INTELACARD LLC (3370 SAN FERNANDO RD , #20; small business) : $105,976 in 11 contractsfrom 2002 to 2006
Contracts for Traffic and Transit Signal Systems, Industrial Marking Machines, Plate, Sheet, Strip, Foil; and Leaf, Installation of Equipment -- Electrical and Electronic Equipment Components, and moreby Navy Signed by year:2000: $0; 2001: $0; 2002: $54,500; 2003: $4,458; 2004: $5,481; 2005: $31,337; 2006: $10,200.
Biggest contracts:
$54,500 with Navy for Traffic and Transit Signal Systems. Signed on 2002-09-11. Completion date: 2002-10-11.
$20,581 with Navy for Industrial Marking Machines. Signed on 2005-12-29. Completion date: 2006-01-27.
$10,200 with Navy for Plate, Sheet, Strip, Foil; and Leaf. Signed on 2006-03-06. Completion date: 2006-04-05.
$4,180 with Navy for Installation of Equipment -- Electrical and Electronic Equipment Components. Signed on 2005-02-22. Completion date: 2005-03-17.
DJ SAFETY, INC (2623 N SAN FERNANDO RD; small business) : $39,178 in 5 contractsfrom 2004 to 2005
Contracts for Vehicular Furniture and Accessories by Defense Logistics Agency Signed by year:2000: $0; 2001: $0; 2002: $0; 2003: $0; 2004: $27,795; 2005: $11,383; 2006: $0.
Biggest contracts:
$11,232 with Defense Logistics Agency for Vehicular Furniture and Accessories. Signed on 2004-11-03. Completion date: 2005-01-02.
$9,482, same as above.Signed on 2004-12-30. Completion date: 2005-02-24.
$7,081, same as above.Signed on 2004-11-03. Completion date: 2005-01-02.
$5,817, same as above.Signed on 2005-08-24. Completion date: 2005-09-24.
D X COMMUNICATIONS, INC (3370 N SAN FERNANDO RD; small business) : $38,667 in 2 contractsfrom 2000 to 2005
$35,280 with Navy for Amplifiers. Signed on 2000-04-21. Completion date: 2000-07-24.
$3,387 with Air Force for Radio and Television Communication Equipment, Except Airborne. Taking place in SC. Signed on 2005-12-21. Completion date: 2006-01-18.
CUSTOM DESIGN ENCLOSURES (3032 DOLORES ST; small business) : $29,049 in 2 contractsfrom 2005 to 2006
$15,493 with Navy for Torpedo Maintenance, Repair, and Checkout Specialized Equipment. Signed on 2005-03-02. Completion date: 2005-05-06.
$13,556, same as above.Signed on 2006-04-12. Completion date: 2006-06-30.
EUROTEL CORPORATION (12300 WILSHIRE BLVD STE 32)
$9,200 with Navy for Telephone and Telegraph Equipment. Signed on 2003-10-01. Completion date: 2004-09-30.
BARRAGAN, JESSE (3027 TREADWELL ST; small business)
$5,345 with Navy for Industrial Assembly Machines. Signed on 2005-06-28. Completion date: 2005-07-28.
THAIGER GRAPHICS (2838 ESTARA AVENUE; small business)
$3,025 with U.S. Army Corps of Engineers - civil program financing only for Signs, Advertising Displays, and Identification Plates. Signed on 2002-12-18. Completion date: 2003-02-18.
Top industries in this zip code by the number of employees in 2005:
Construction: Poured Concrete Foundation and Structure Contractors (500-999 employees: 1 establishment, 5-9 employees: 2 establishments)
2005 - 2018 National Fire Incident Reporting System (NFIRS) incidents
Based on the data from the years 2005 - 2018 the average number of fire incidents per year is 91. The highest number of fire incidents - 133 took place in 2006, and the least - 42 in 2012. The data has a dropping trend.
When looking into fire subcategories, the most reports belonged to: Structure Fires (42.1%), and Outside Fires (34.6%).
Fire incident types reported to NFIRS in Zip Code 90065

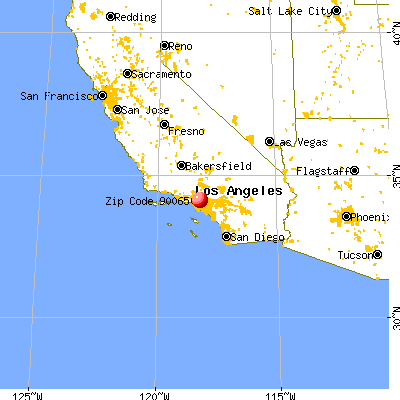


 Nearest zip codes: 90041, 91205, 90031, 90042, 90039, 90090.


 Based on the data from the years 2005 - 2018 the average number of fire incidents per year is 91. The highest number of fire incidents - 133 took place in 2006, and the least - 42 in 2012. The data has a dropping trend.
 When looking into fire subcategories, the most reports belonged to: Structure Fires (42.1%), and Outside Fires (34.6%).