Estimated zip code population in 2022: 28,085 Zip code population in 2010: 27,425 Zip code population in 2000: 27,864
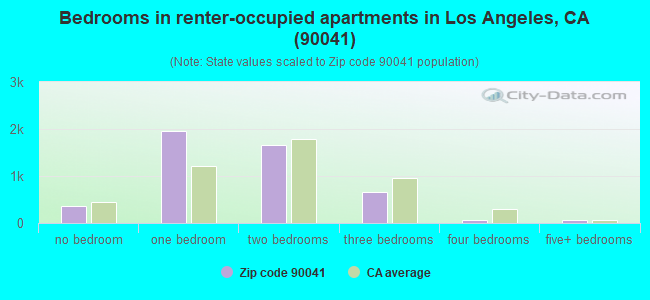
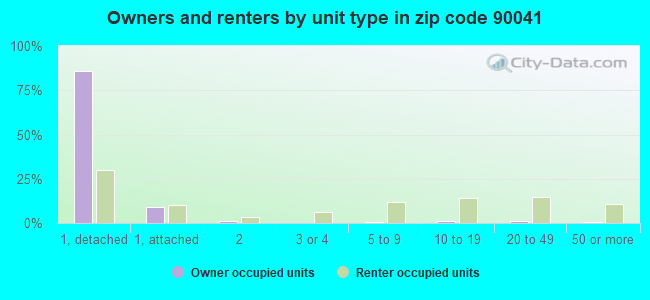
Houses and condos: 10,527 Renter-occupied apartments: 4,786
% of renters here:
48%
State:
44%
March 2022 cost of living index in zip code 90041: 136.7 (high, U.S. average is 100)
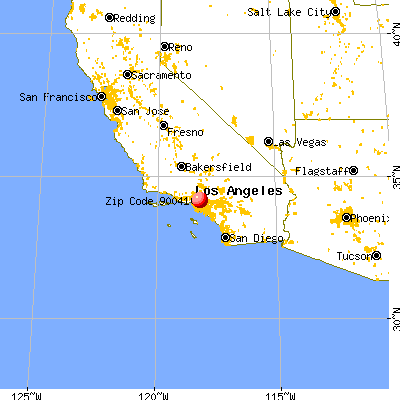
Land area: 3.6 sq. mi. Water area: 0.0 sq. mi.
Population density: 7,779 people per square mile
(high).
OSM Map
General Map
Google Map
MSN Map
OSM Map
General Map
Google Map
MSN Map
OSM Map
General Map
Google Map
MSN Map
OSM Map
General Map
Google Map
MSN Map
Please wait while loading the map...
Real estate property taxes paid for housing units in 2022:
This zip code:
0.5% ($6,033)
California:
0.7% ($4,831)
Median real estate property taxes paid for housing units with mortgages in 2022: $6,972 (0.6%) Median real estate property taxes paid for housing units with no mortgage in 2022: $3,769 (0.3%)
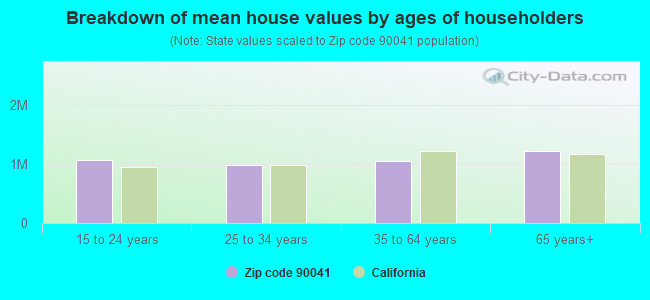
Estimated median house/condo value in 2022: $1,131,563
90041:
$1,131,563
California:
$715,900
According to our research of California and other state lists, there were 16 registered sex offenders living in 90041 zip code as of April 27, 2024. The ratio of all residents to sex offenders in zip code 90041 is 1,801 to 1. The ratio of registered sex offenders to all residents in this zip code is lower than the state average.
Median resident age:
This zip code:
41.0 years
California median age:
37.9 years
Average household size:
This zip code:
2.6 people
California:
2.8 people
Averages for the 2020 tax year for zip code 90041, filed in 2021:
Average Adjusted Gross Income (AGI) in 2020: $84,696 (Individual Income Tax Returns)
Here:
$84,696
State:
$95,910
Salary/wage: $75,332 (reported on 79.0% of returns)
Here:
$75,332
State:
$77,331
(% of AGI for various income ranges: 1051.2% for AGIs below $25k, 3978.7% for AGIs $25k-50k, 7295.2% for AGIs $50k-75k, 10759.6% for AGIs $75k-100k, 21413.8% for AGIs $100k-200k, 78134.3% for AGIs over 200k)
Taxable interest for individuals: $1,031 (reported on 38.1% of returns)
This zip code:
$1,031
California:
$2,294
(% of AGI for various income ranges: 23.7% for AGIs below $25k, 24.4% for AGIs $25k-50k, 34.4% for AGIs $50k-75k, 53.8% for AGIs $75k-100k, 136.9% for AGIs $100k-200k, 523.4% for AGIs over 200k)
Ordinary dividends: $4,924 (reported on 21.2% of returns)
Here:
$4,924
State:
$10,949
(% of AGI for various income ranges: 27.2% for AGIs below $25k, 43.8% for AGIs $25k-50k, 80.2% for AGIs $50k-75k, 164.4% for AGIs $75k-100k, 301.3% for AGIs $100k-200k, 1932.6% for AGIs over 200k)
Net capital gain/loss in AGI: +$22,541 (reported on 20.8% of returns)
Here:
+$22,541
State:
+$49,306
(% of AGI for various income ranges: 9.1% for AGIs below $25k, 26.5% for AGIs $25k-50k, 101.0% for AGIs $50k-75k, 135.7% for AGIs $75k-100k, 703.6% for AGIs $100k-200k, 14723.4% for AGIs over 200k)
Profit/loss from business: +$11,696 (reported on 25.2% of returns)
Here:
+$11,696
State:
+$15,671
(% of AGI for various income ranges: 221.9% for AGIs below $25k, 248.2% for AGIs $25k-50k, 321.2% for AGIs $50k-75k, 506.1% for AGIs $75k-100k, 813.9% for AGIs $100k-200k, 3446.3% for AGIs over 200k)
Taxable individual retirement arrangement distribution: $17,417 (reported on 6.3% of returns)
90041:
$17,417
California:
$23,505
(% of AGI for various income ranges: 53.0% for AGIs below $25k, 64.2% for AGIs $25k-50k, 165.6% for AGIs $50k-75k, 237.6% for AGIs $75k-100k, 440.8% for AGIs $100k-200k, 931.7% for AGIs over 200k)
Self-employed (Keogh) retirement plans: $22,025 (reported on 1.2% of returns)
90041:
$22,025
California:
$30,163
(% of AGI for various income ranges: 12.2% for AGIs $25k-50k, 30.0% for AGIs $75k-100k, 71.9% for AGIs $100k-200k, 639.4% for AGIs over 200k)
Total itemized deductions: $37,100 (reported on 18.8% of returns)
Here:
$37,100
State:
$39,517
(% of AGI for various income ranges: 120.9% for AGIs below $25k, 204.8% for AGIs $25k-50k, 563.8% for AGIs $50k-75k, 1191.7% for AGIs $75k-100k, 2513.4% for AGIs $100k-200k, 11796.0% for AGIs over 200k)
Charity contributions: $6,145 (reported on 16.3% of returns)
Here:
$6,145
State:
$12,598
(% of AGI for various income ranges: 5.1% for AGIs below $25k, 22.1% for AGIs $25k-50k, 70.2% for AGIs $50k-75k, 159.1% for AGIs $75k-100k, 370.5% for AGIs $100k-200k, 1855.1% for AGIs over 200k)
Taxes paid: $8,724 (reported on 18.8% of returns)
90041:
$8,724
State:
$8,807
(% of AGI for various income ranges: 25.7% for AGIs below $25k, 46.8% for AGIs $25k-50k, 147.3% for AGIs $50k-75k, 341.7% for AGIs $75k-100k, 760.2% for AGIs $100k-200k, 2066.9% for AGIs over 200k)
Earned income credit: $1,359 (reported on 11.0% of returns)
Here:
$1,359
State:
$2,074
(% of AGI for various income ranges: 54.5% for AGIs below $25k, 38.4% for AGIs $25k-50k)
Percentage of individuals using paid preparers for their 2020 taxes: 91.4%
Here:
91%
State:
92%
(% for various income ranges: 89.0% for AGIs below $25k, 91.4% for AGIs $25k-50k, 91.7% for AGIs $50k-75k, 92.0% for AGIs $75k-100k, 92.8% for AGIs $100k-200k, 94.8% for AGIs over 200k)
Averages for the 2012 tax year for zip code 90041, filed in 2013:
Average Adjusted Gross Income (AGI) in 2012: $58,947 (Individual Income Tax Returns)
Here:
$58,947
State:
$72,726
Salary/wage: $55,626 (reported on 82.4% of returns)
Here:
$55,626
State:
$59,079
(% of AGI for various income ranges: 68.7% for AGIs below $25k, 81.2% for AGIs $25k-50k, 80.7% for AGIs $50k-75k, 81.1% for AGIs $75k-100k, 81.7% for AGIs $100k-200k, 66.3% for AGIs over 200k)
Taxable interest for individuals: $794 (reported on 35.6% of returns)
This zip code:
$794
California:
$2,146
(% of AGI for various income ranges: 0.8% for AGIs below $25k, 0.5% for AGIs $25k-50k, 0.4% for AGIs $50k-75k, 0.5% for AGIs $75k-100k, 0.4% for AGIs $100k-200k, 0.5% for AGIs over 200k)
Ordinary dividends: $3,600 (reported on 16.2% of returns)
Here:
$3,600
State:
$9,308
(% of AGI for various income ranges: 1.1% for AGIs below $25k, 0.8% for AGIs $25k-50k, 0.8% for AGIs $50k-75k, 0.9% for AGIs $75k-100k, 0.8% for AGIs $100k-200k, 1.7% for AGIs over 200k)
Net capital gain/loss in AGI: +$3,095 (reported on 13.2% of returns)
Here:
+$3,095
State:
+$30,460
(% of AGI for various income ranges: 0.2% for AGIs $25k-50k, 0.3% for AGIs $75k-100k, 0.6% for AGIs $100k-200k, 2.7% for AGIs over 200k)
Profit/loss from business: +$11,333 (reported on 23.0% of returns)
Here:
+$11,333
State:
+$17,064
(% of AGI for various income ranges: 15.3% for AGIs below $25k, 5.6% for AGIs $25k-50k, 3.2% for AGIs $50k-75k, 2.8% for AGIs $75k-100k, 2.8% for AGIs $100k-200k, 4.1% for AGIs over 200k)
Taxable individual retirement arrangement distribution: $13,605 (reported on 6.8% of returns)
90041:
$13,605
California:
$19,557
(% of AGI for various income ranges: 2.1% for AGIs below $25k, 1.8% for AGIs $25k-50k, 1.8% for AGIs $50k-75k, 1.2% for AGIs $75k-100k, 1.6% for AGIs $100k-200k, 1.1% for AGIs over 200k)
Self-employment retirement plans: $15,020 (reported on 0.8% of returns)
90041:
$15,020
California:
$24,530
(% of AGI for various income ranges: 0.3% for AGIs $50k-75k, 0.2% for AGIs $100k-200k, 0.4% for AGIs over 200k)
Total itemized deductions: $27,112 (26% of AGI, reported on 38.8% of returns)
Here:
$27,112
State:
$34,004
Here:
26.3% of AGI
State:
22.7% of AGI
(% of AGI for various income ranges: 12.7% for AGIs below $25k, 11.8% for AGIs $25k-50k, 16.2% for AGIs $50k-75k, 19.5% for AGIs $75k-100k, 20.9% for AGIs $100k-200k, 20.0% for AGIs over 200k)
Charity contributions: $3,003 (reported on 33.3% of returns)
Here:
$3,003
State:
$4,659
(% of AGI for various income ranges: 0.7% for AGIs below $25k, 1.2% for AGIs $25k-50k, 1.6% for AGIs $50k-75k, 2.1% for AGIs $75k-100k, 1.9% for AGIs $100k-200k, 1.9% for AGIs over 200k)
Taxes paid: $9,434 (reported on 38.7% of returns)
90041:
$9,434
State:
$14,448
(% of AGI for various income ranges: 2.5% for AGIs below $25k, 2.5% for AGIs $25k-50k, 4.4% for AGIs $50k-75k, 6.4% for AGIs $75k-100k, 8.0% for AGIs $100k-200k, 9.2% for AGIs over 200k)
Earned income credit: $1,746 (reported on 15.7% of returns)
Here:
$1,746
State:
$2,286
(% of AGI for various income ranges: 4.8% for AGIs below $25k, 0.8% for AGIs $25k-50k)
Percentage of individuals using paid preparers for their 2012 taxes: 69.3%
Here:
69%
State:
64%
(% for various income ranges: 66.5% for AGIs below $25k, 66.8% for AGIs $25k-50k, 68.9% for AGIs $50k-75k, 72.7% for AGIs $75k-100k, 75.9% for AGIs $100k-200k, 84.6% for AGIs over 200k)
Averages for the 2004 tax year for zip code 90041, filed in 2005:
Average Adjusted Gross Income (AGI) in 2004: $44,933 (Individual Income Tax Returns)
Here:
$44,933
State:
$58,600
Salary/wage: $43,685 (reported on 84.1% of returns)
Here:
$43,685
State:
$49,455
(% of AGI for various income ranges: 111.9% for AGIs below $10k, 78.7% for AGIs $10k-25k, 85.9% for AGIs $25k-50k, 86.7% for AGIs $50k-75k, 84.7% for AGIs $75k-100k, 74.5% for AGIs over 100k)
Taxable interest for individuals: $1,059 (reported on 43.2% of returns)
This zip code:
$1,059
California:
$2,365
(% of AGI for various income ranges: 6.0% for AGIs below $10k, 1.5% for AGIs $10k-25k, 0.8% for AGIs $25k-50k, 0.8% for AGIs $50k-75k, 0.8% for AGIs $75k-100k, 1.0% for AGIs over 100k)
Taxable dividends: $2,144 (reported on 18.1% of returns)
Here:
$2,144
State:
$4,746
(% of AGI for various income ranges: 4.6% for AGIs below $10k, 0.9% for AGIs $10k-25k, 0.5% for AGIs $25k-50k, 0.9% for AGIs $50k-75k, 0.6% for AGIs $75k-100k, 1.0% for AGIs over 100k)
Net capital gain/loss: +$8,984 (reported on 14.4% of returns)
Here:
+$8,984
State:
+$23,418
(% of AGI for various income ranges: -2.0% for AGIs below $10k, -0.4% for AGIs $10k-25k, 0.1% for AGIs $25k-50k, 0.5% for AGIs $50k-75k, 1.3% for AGIs $75k-100k, 7.8% for AGIs over 100k)
Profit/loss from business: +$10,823 (reported on 20.0% of returns)
Here:
+$10,823
State:
+$16,826
(% of AGI for various income ranges: 26.3% for AGIs below $10k, 8.8% for AGIs $10k-25k, 4.4% for AGIs $25k-50k, 2.3% for AGIs $50k-75k, 3.6% for AGIs $75k-100k, 5.2% for AGIs over 100k)
IRA payment deduction: $2,712 (reported on 3.1% of returns)
90041:
$2,712
California:
$3,192
(% of AGI for various income ranges: 0.4% for AGIs below $10k, 0.3% for AGIs $10k-25k, 0.3% for AGIs $25k-50k, 0.2% for AGIs $50k-75k, 0.1% for AGIs $75k-100k, 0.1% for AGIs over 100k)
Self-employed pension: $14,897 (reported on 0.9% of returns)
Here:
$14,897
California:
$17,688
Total itemized deductions: $23,142 (30% of AGI, reported on 39.0% of returns)
Here:
$23,142
State:
$28,113
Here:
29.8% of AGI
State:
25.3% of AGI
(% of AGI for various income ranges: 21.2% for AGIs below $10k, 12.8% for AGIs $10k-25k, 16.2% for AGIs $25k-50k, 21.9% for AGIs $50k-75k, 24.5% for AGIs $75k-100k, 21.5% for AGIs over 100k)
Charity contributions deductions: $2,913 (4% of AGI, reported on 35.4% of returns)
Here:
$2,913
State:
$3,923
Here:
3.6% of AGI
State:
3.3% of AGI
(% of AGI for various income ranges: 1.1% for AGIs below $10k, 1.1% for AGIs $10k-25k, 1.8% for AGIs $25k-50k, 2.6% for AGIs $50k-75k, 2.9% for AGIs $75k-100k, 2.5% for AGIs over 100k)
Total tax: $6,049 (reported on 77.5% of returns)
90041:
$6,049
State:
$10,761
(% of AGI for various income ranges: 6.3% for AGIs below $10k, 4.5% for AGIs $10k-25k, 6.9% for AGIs $25k-50k, 8.8% for AGIs $50k-75k, 10.3% for AGIs $75k-100k, 15.5% for AGIs over 100k)
Earned income credit: $1,551 (reported on 15.4% of returns)
Here:
$1,551
State:
$1,763
Percentage of individuals using paid preparers for their 2004 taxes: 69.7%
Here:
70%
State:
66%
(% for various income ranges: 61.1% for AGIs below $10k, 71.0% for AGIs $10k-25k, 68.5% for AGIs $25k-50k, 72.4% for AGIs $50k-75k, 74.5% for AGIs $75k-100k, 76.9% for AGIs over 100k)
Likely homosexual households (counted as self-reported same-sex unmarried-partner households)
Lesbian couples: 1.2% of all households
Gay men: 0.7% of all households
Household received Food Stamps/SNAP in the past 12 months: 935 Household did not receive Food Stamps/SNAP in the past 12 months: 9,039
Women who had a birth in the past 12 months: 325 (221 now married, 104 unmarried) Women who did not have a birth in the past 12 months: 6,480 (2,565 now married, 3,915 unmarried)
Housing units in zip code 90041 with a mortgage: 3,831 (447 second mortgage, 52 home equity loan, 246 both second mortgage and home equity loan) Houses without a mortgage: 159
Median monthly owner costs for units with a mortgage: $3,476 Median monthly owner costs for units without a mortgage: $879
Residents with income below the poverty level in 2022:
This zip code:
10.4%
Whole state:
12.2%
Residents with income below 50% of the poverty level in 2022:
This zip code:
4.2%
Whole state:
6.2%
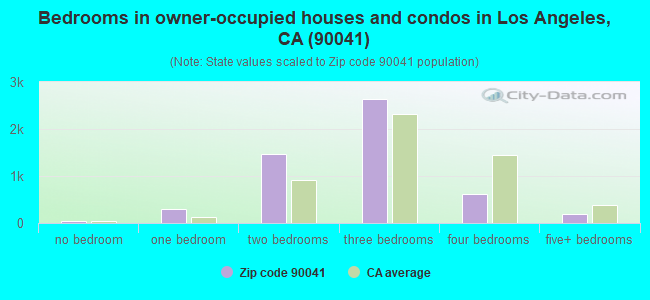
Median number of rooms in houses and condos:
Here:
5.5
State:
6.0
Median number of rooms in apartments:
Here:
3.6
State:
3.9
Notable locations in this zip code not listed on our city pages
Notable locations in zip code 90041: York Boulevard Puming Station (A), Eagle Rock Branch Los Angeles Public Library (B), WCTU Home (C), City of Los Angeles Fire Department Station 55 (D), City of Los Angeles Fire Department Station 42 (E), Spencer Field House (F), Bell-Young Hall (G), Pawley Hall (H), Stewart-Cleland Hall (I), Moore Laboratory of Zoology (J), Braun Hall (K), Norris Hall South (L), Norris Hall North (M), Haines Hall (N), Chilcott Hall (O), Erdman Hall (P), Weingart Center For The Liberal Arts (Q), Samuelson Campus Pavilion (R), Johnson Student Center (S), Cooris Administration Center (T). Display/hide their locations on the map
Shopping Centers: Eagle Rock Town Square Shopping Center (1), Eagle Rock Plaza Shopping Center (2), Eagle Rock Plaza Shopping Center (3). Display/hide their locations on the map
Churches in zip code 90041 include: Eagle Rock Baptist Church (A), Eagle Rock Covenant Church (B), Eagle Rock Lutheran Church (C), Eagle Rock Nazarene Church (D), Eagle Rock Presbyterian Church (E), Eagle Rock Seventh Day Adventist Church (F), Gloria Baptist Church (G), Highland Park Seventh Day Adventist Church (H), Saint Barnabas Episcopal Church (I). Display/hide their locations on the map
Parks in zip code 90041 include: Patterson Field (1), Taylor Pool (2), Bell Field (3), Anderson Field (4), Eagle Rock Recreation Center (5), Eagle Rock Hillside Park (6), Yosemite Recreation Center (7). Display/hide their locations on the map
Tourist attraction (not listed on the city page) : Arcade World (Amusement & Theme Parks; 2700 Colorado Boulevard Suite 227).
3,348 married couples with children.
1,190 single-parent households (445 men, 745 women).
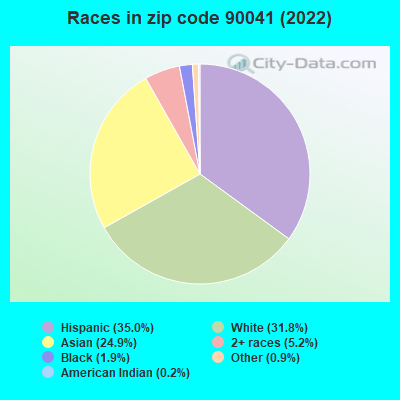
55.1% of residents of 90041 zip code speak English at home.
21.0% of residents speak Spanish at home (70% very well, 13% well, 14% not well, 3% not at all).
4.1% of residents speak other Indo-European language at home (77% very well, 7% well, 16% not well).
19.7% of residents speak Asian or Pacific Island language at home (63% very well, 29% well, 8% not well).
0.5% of residents speak other language at home (59% very well, 22% well, 11% not well, 8% not at all).
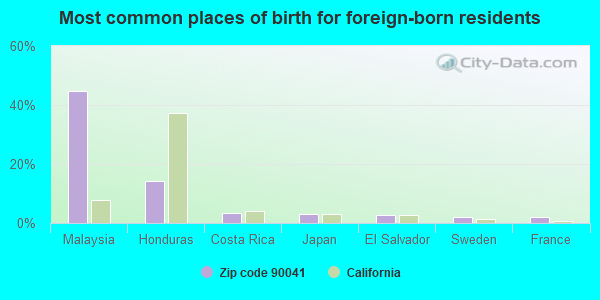
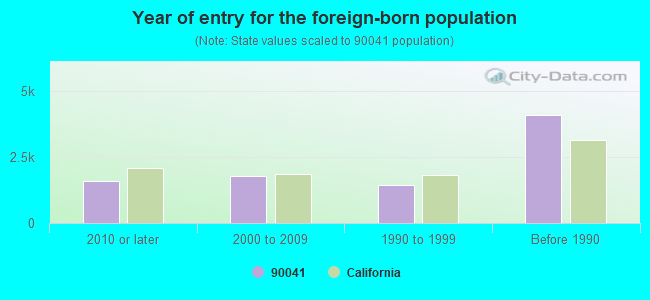
Foreign born population: 8,711 (31.0%) (70.9% of them are naturalized citizens)
Major facilities with environmental interests located in this zip code:
LAUSD EAGLE ROCK ELEM SCHOOL (2057 FAIR PARK AVE in LOS ANGELES, CA)
STATE MASTER (California - Hazardous Waste Tracking) - HAZARDOU WASTE PROGRAM Small Quantity Generators, between 100 kg and 1000 kg of hazardous waste/month (Resource Conservation and Recovery Act (tracking hazardous waste)) - notification Alternative names: EAGLE ROCK ELEMENTARY
CHEVRON STATION 92885 (2960 WEST BROADWAY in LOS ANGELES, CA)
STATE MASTER (California - Hazardous Waste Tracking) - HAZARDOU WASTE PROGRAM HAZARDOUS WASTE BIENNIAL REPORTER (Resource Conservation and Recovery Act (tracking hazardous waste)) Small Quantity Generators, between 100 kg and 1000 kg of hazardous waste/month (Resource Conservation and Recovery Act (tracking hazardous waste)) - notification Organizations: CHEVRON USA PRODUCTS CO (CONTACT/OWNER)
Alternative names: CHEVRON STATION 9 2885
LOS ANGELES EAGLE ROCK YARD (2231 FAIR PARK AVE in EAGLE ROCK, CA)
STATE MASTER (California - Hazardous Waste Tracking) - HAZARDOU WASTE PROGRAM Small Quantity Generators, between 100 kg and 1000 kg of hazardous waste/month (Resource Conservation and Recovery Act (tracking hazardous waste))
CHEVRON STATION NO 98119 (7368 N FIGUEROA ST in LOS ANGELES, CA)
STATE MASTER (California - Hazardous Waste Tracking) - HAZARDOU WASTE PROGRAM Small Quantity Generators, between 100 kg and 1000 kg of hazardous waste/month (Resource Conservation and Recovery Act (tracking hazardous waste)) - notification Organizations: CHEVRON PRODUCTS CO (CONTACT/OWNER)
CALIFORNIA Z CARS (2101 W COLORADO BLVD in LOS ANGELES, CA)
STATE MASTER (California - Hazardous Waste Tracking) - HAZARDOU WASTE PROGRAM Small Quantity Generators, between 100 kg and 1000 kg of hazardous waste/month (Resource Conservation and Recovery Act (tracking hazardous waste)) - notification Organizations: PHILLIP TOLENTINO (CONTACT/OWNER)
1-DAY PAINT AND BODY CENTERS INC (2222 COLORADO BLVD in EAGLE ROCK, CA)
CRITERIA AND HAZARDOUS AIR POLLUTANT INVENTORY (Inventory of air pollution sources) Small Quantity Generators, between 100 kg and 1000 kg of hazardous waste/month (Resource Conservation and Recovery Act (tracking hazardous waste)) Business SIC classification: TOP, BODY, AND UPHOLSTERY REPAIR SHOPS AND PAINT SHOPS Business NAICS classification: AUTOMOTIVE BODY, PAINT, AND INTERIOR REPAIR AND MAINTENANCE.
1509 N AVE 49 (1509 N AVE 49 in LOS ANGELES, CA)
Small Quantity Generators, between 100 kg and 1000 kg of hazardous waste/month (Resource Conservation and Recovery Act (tracking hazardous waste)) Organizations: OCCIDENTAL COLLEGE FACILITIES DEPT (CONTACT/OPERATOR)
, OCCIDENTAL COLLEGE (CONTACT/OWNER)
1524 NORTH AVE 49 (1524 NORTH AVE in LOS ANGELES, CA)
Small Quantity Generators, between 100 kg and 1000 kg of hazardous waste/month (Resource Conservation and Recovery Act (tracking hazardous waste)) Organizations: OCCIDENTAL COLLEGE FACILITIES DEPT (CONTACT/OPERATOR)
, OCCIDENTAL COLLEGE (CONTACT/OWNER)
1633 CAMPUS ROAD (1633 CAMPUS ROAD in LOS ANGELES, CA)
Small Quantity Generators, between 100 kg and 1000 kg of hazardous waste/month (Resource Conservation and Recovery Act (tracking hazardous waste)) Organizations: OCCIDENTAL COLLEGE FACILITIES DEPT (CONTACT/OPERATOR)
, OCCIDENTAL COLLEGE (CONTACT/OWNER)
1733 CAMPUS RD (1733 CAMPUS RD in LOS ANGELES, CA)
Small Quantity Generators, between 100 kg and 1000 kg of hazardous waste/month (Resource Conservation and Recovery Act (tracking hazardous waste)) Organizations: OCCIDENTAL COLLEGE FACILITIES DEPT (CONTACT/OPERATOR)
, OCCIDENTAL COLLEGE (CONTACT/OWNER)
1888 CAMPUS RD (1888 CAMPUS RD in LOS ANGELES, CA)
Small Quantity Generators, between 100 kg and 1000 kg of hazardous waste/month (Resource Conservation and Recovery Act (tracking hazardous waste)) Organizations: OCCIDENTAL COLLEGE FACILITIES DEPT (CONTACT/OPERATOR)
, OCCIDENTAL COLLEGE (CONTACT/OWNER)
4823 STRATFORD ROAD (4823 STRATFORD ROAD in LOS ANGELES, CA)
Small Quantity Generators, between 100 kg and 1000 kg of hazardous waste/month (Resource Conservation and Recovery Act (tracking hazardous waste)) Organizations: OCCIDENTAL COLLEGE FACILITIES DEPT (CONTACT/OPERATOR)
, OCCIDENTAL COLLEGE (CONTACT/OWNER)
4829 STRATFORD ROAD (4829 STRATFORD ROAD in LOS ANGELES, CA)
Small Quantity Generators, between 100 kg and 1000 kg of hazardous waste/month (Resource Conservation and Recovery Act (tracking hazardous waste)) Organizations: OCCIDENTAL COLLEGE FACILITIES DEPT (CONTACT/OPERATOR)
, OCCIDENTAL COLLEGE (CONTACT/OWNER)
Housing units lacking complete plumbing facilities: 0.5% Housing units lacking complete kitchen facilities: 1.7%
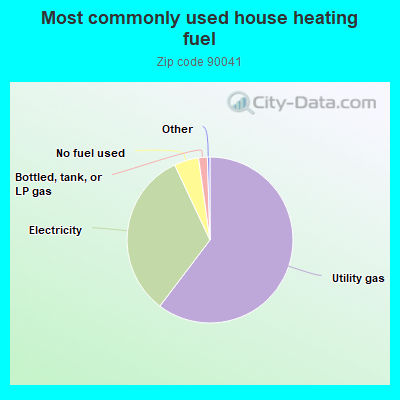
60.4%Utility gas
32.7%Electricity
4.8%No fuel used
1.7%Bottled, tank, or LP gas
Population in 1990: 26,864. Population change in the 1990s: +1,000 (+3.7%).
Place of birth for U.S.-born residents:
This state: 14,272
Northeast: 1,324
Midwest: 1,223
South: 1,460
West: 779
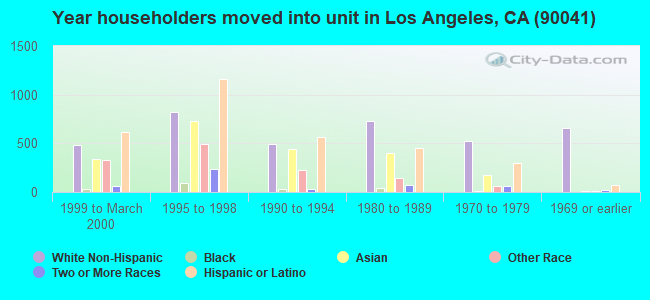
59% of the 90041 zip code residents lived in the same house 5 years ago. Out of people who lived in different houses, 85% lived in this county. Out of people who lived in different counties, 50% lived in California.
90% of the 90041 zip code residents lived in the same house 1 year ago. Out of people who lived in different houses, 82% moved from this county. Out of people who lived in different houses, 6% moved from different county within same state. Out of people who lived in different houses, 7% moved from different state. Out of people who lived in different houses, 3% moved from abroad.
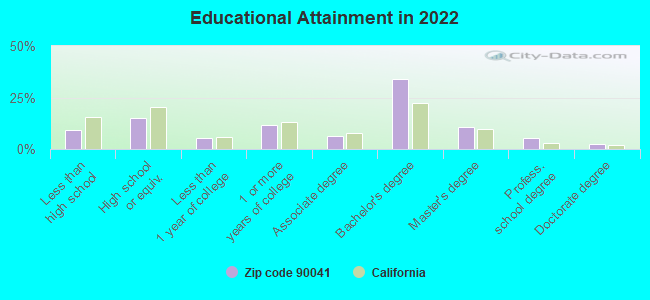
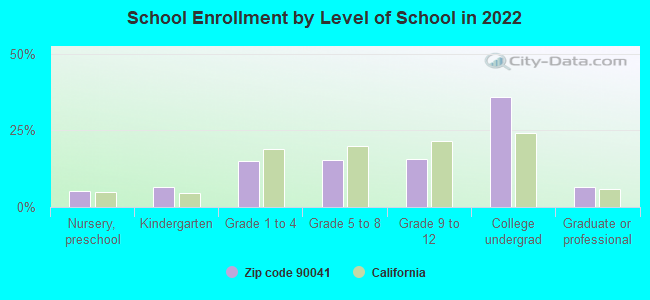
Private vs. public school enrollment:
Students in private schools in grades 1 to 8 (elementary and middle school): 361
Here:
18.7%
California:
10.5%
Students in private schools in grades 9 to 12 (high school): 146
Here:
14.7%
California:
8.5%
Students in private undergraduate colleges: 1,172
Here:
50.8%
California:
15.9%
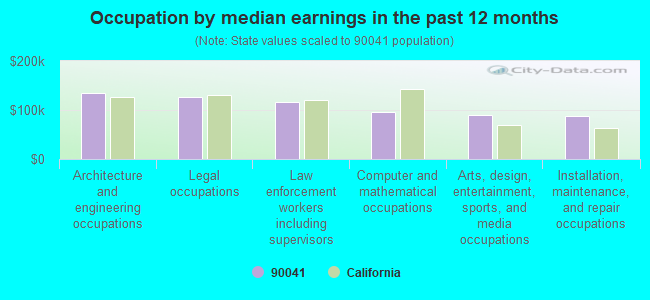
Occupation by median earnings in the past 12 months ($)
133,882Architecture and engineering occupations
126,982Legal occupations
116,268Law enforcement workers including supervisors
95,825Computer and mathematical occupations
89,862Arts, design, entertainment, sports, and media occupations
88,256Installation, maintenance, and repair occupations
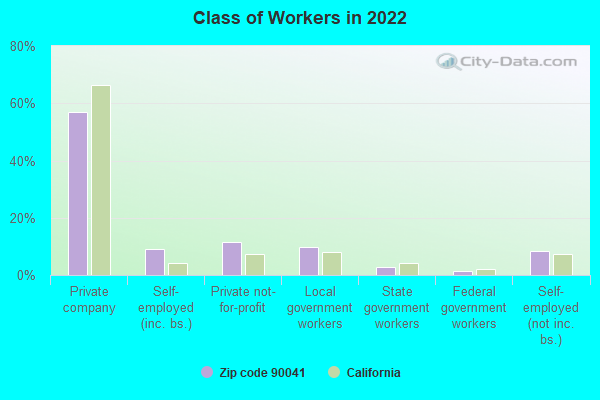
Companies with federal contracts located in this zip code:
CITIBANK USA (7470 N FIGUEROA STREET in LOS ANGELES, CA; small business)
$160 with Bureau of the Public Debt for ADP Software. Taking place in WV. Signed on 2005-03-29. Completion date: 2005-04-28.
Top industries in this zip code by the number of employees in 2005:
Educational Services: Colleges, Universities, and Professional Schools (500-999 employees: 1 establishment)
2005 - 2018 National Fire Incident Reporting System (NFIRS) incidents
Based on the data from the years 2005 - 2018 the average number of fire incidents per year is 68. The highest number of fire incidents - 91 took place in 2014, and the least - 51 in 2012. The data has a dropping trend.
When looking into fire subcategories, the most reports belonged to: Structure Fires (45.5%), and Outside Fires (29.8%).
Fire incident types reported to NFIRS in Zip Code 90041


 Nearest zip codes: 91206, 90042, 90065, 91205, 91105, 91210.
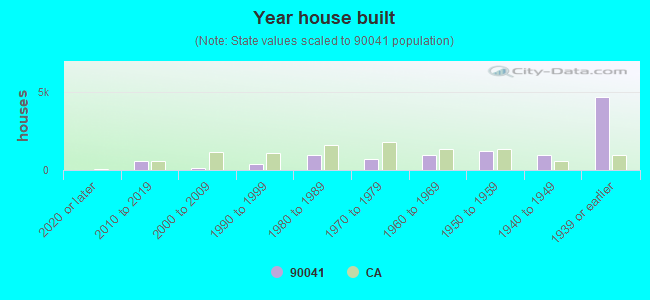


 Based on the data from the years 2005 - 2018 the average number of fire incidents per year is 68. The highest number of fire incidents - 91 took place in 2014, and the least - 51 in 2012. The data has a dropping trend.
 When looking into fire subcategories, the most reports belonged to: Structure Fires (45.5%), and Outside Fires (29.8%).