Estimated zip code population in 2022: 12,586 Zip code population in 2010: 11,254 Zip code population in 2000: 10,245
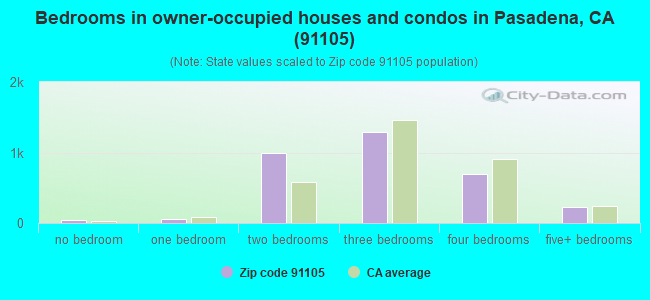
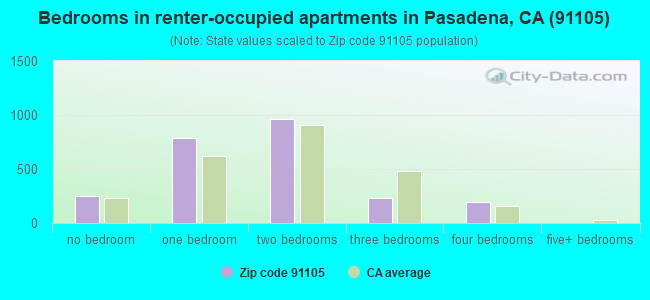
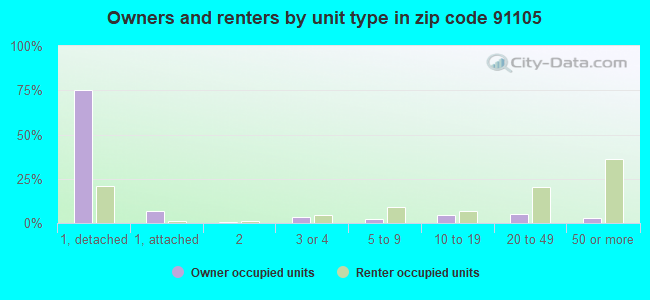
Houses and condos: 6,707 Renter-occupied apartments: 2,429
% of renters here:
42%
State:
44%
March 2022 cost of living index in zip code 91105: 140.4 (very high, U.S. average is 100)
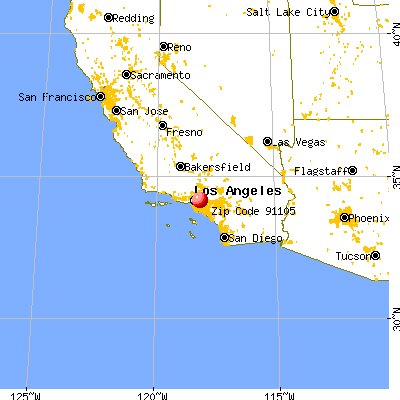
Land area: 3.7 sq. mi. Water area: 0.0 sq. mi.
Population density: 3,408 people per square mile
(average).
OSM Map
General Map
Google Map
MSN Map
OSM Map
General Map
Google Map
MSN Map
OSM Map
General Map
Google Map
MSN Map
OSM Map
General Map
Google Map
MSN Map
Please wait while loading the map...
Real estate property taxes paid for housing units in 2022:
This zip code:
0.6% ($10,292)
California:
0.7% ($4,831)
Median real estate property taxes paid for housing units with mortgages in 2022: $10,330 (0.6%) Median real estate property taxes paid for housing units with no mortgage in 2022: $8,378 (0.6%)
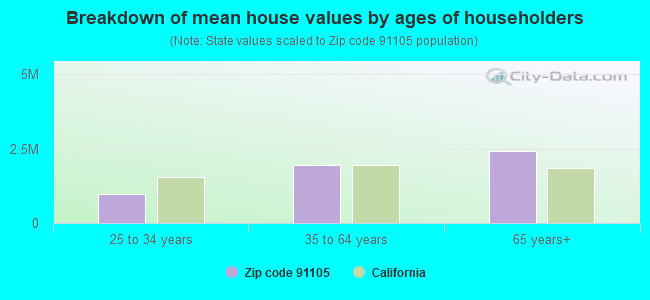
Estimated median house/condo value in 2022: $1,632,356
91105:
$1,632,356
California:
$715,900
According to our research of California and other state lists, there were 2 registered sex offenders living in 91105 zip code as of April 26, 2024. The ratio of all residents to sex offenders in zip code 91105 is 5,948 to 1. The ratio of registered sex offenders to all residents in this zip code is much lower than the state average.
Median resident age:
This zip code:
47.8 years
California median age:
37.9 years
Average household size:
This zip code:
2.1 people
California:
2.8 people
Averages for the 2020 tax year for zip code 91105, filed in 2021:
Average Adjusted Gross Income (AGI) in 2020: $281,435 (Individual Income Tax Returns)
Here:
$281,435
State:
$95,910
Salary/wage: $156,959 (reported on 70.0% of returns)
Here:
$156,959
State:
$77,331
(% of AGI for various income ranges: 1134.4% for AGIs below $25k, 3931.6% for AGIs $25k-50k, 7145.0% for AGIs $50k-75k, 11130.0% for AGIs $75k-100k, 21168.6% for AGIs $100k-200k, 143825.8% for AGIs over 200k)
Taxable interest for individuals: $10,420 (reported on 59.2% of returns)
This zip code:
$10,420
California:
$2,294
(% of AGI for various income ranges: 67.9% for AGIs below $25k, 95.2% for AGIs $25k-50k, 184.2% for AGIs $50k-75k, 291.9% for AGIs $75k-100k, 500.9% for AGIs $100k-200k, 9772.1% for AGIs over 200k)
Ordinary dividends: $33,627 (reported on 50.8% of returns)
Here:
$33,627
State:
$10,949
(% of AGI for various income ranges: 228.4% for AGIs below $25k, 300.4% for AGIs $25k-50k, 970.5% for AGIs $50k-75k, 954.7% for AGIs $75k-100k, 1926.0% for AGIs $100k-200k, 25547.4% for AGIs over 200k)
Net capital gain/loss in AGI: +$142,105 (reported on 48.8% of returns)
Here:
+$142,105
State:
+$49,306
(% of AGI for various income ranges: 103.4% for AGIs below $25k, 197.4% for AGIs $25k-50k, 816.6% for AGIs $50k-75k, 855.3% for AGIs $75k-100k, 1601.4% for AGIs $100k-200k, 121286.3% for AGIs over 200k)
Profit/loss from business: +$33,035 (reported on 24.4% of returns)
Here:
+$33,035
State:
+$15,671
(% of AGI for various income ranges: 192.0% for AGIs below $25k, 438.8% for AGIs $25k-50k, 512.6% for AGIs $50k-75k, 708.1% for AGIs $75k-100k, 1748.2% for AGIs $100k-200k, 9987.9% for AGIs over 200k)
Taxable individual retirement arrangement distribution: $51,837 (reported on 13.6% of returns)
91105:
$51,837
California:
$23,505
(% of AGI for various income ranges: 86.6% for AGIs below $25k, 151.0% for AGIs $25k-50k, 463.2% for AGIs $50k-75k, 570.3% for AGIs $75k-100k, 1772.5% for AGIs $100k-200k, 8883.2% for AGIs over 200k)
Self-employed (Keogh) retirement plans: $45,360 (reported on 3.6% of returns)
91105:
$45,360
California:
$30,163
(% of AGI for various income ranges: 39.2% for AGIs $25k-50k, 149.5% for AGIs $100k-200k, 2708.4% for AGIs over 200k)
Total itemized deductions: $61,965 (reported on 35.4% of returns)
Here:
$61,965
State:
$39,517
(% of AGI for various income ranges: 474.4% for AGIs below $25k, 663.6% for AGIs $25k-50k, 1235.0% for AGIs $50k-75k, 2032.5% for AGIs $75k-100k, 3899.5% for AGIs $100k-200k, 29357.4% for AGIs over 200k)
Charity contributions: $29,697 (reported on 31.1% of returns)
Here:
$29,697
State:
$12,598
(% of AGI for various income ranges: 25.2% for AGIs below $25k, 62.8% for AGIs $25k-50k, 164.5% for AGIs $50k-75k, 225.6% for AGIs $75k-100k, 751.4% for AGIs $100k-200k, 15119.5% for AGIs over 200k)
Taxes paid: $9,247 (reported on 35.1% of returns)
91105:
$9,247
State:
$8,807
(% of AGI for various income ranges: 71.1% for AGIs below $25k, 128.6% for AGIs $25k-50k, 262.1% for AGIs $50k-75k, 465.3% for AGIs $75k-100k, 978.2% for AGIs $100k-200k, 3483.9% for AGIs over 200k)
Earned income credit: $1,138 (reported on 5.4% of returns)
Here:
$1,138
State:
$2,074
(% of AGI for various income ranges: 39.3% for AGIs below $25k, 36.2% for AGIs $25k-50k)
Percentage of individuals using paid preparers for their 2020 taxes: 92.7%
Here:
93%
State:
92%
(% for various income ranges: 91.0% for AGIs below $25k, 92.9% for AGIs $25k-50k, 93.2% for AGIs $50k-75k, 91.0% for AGIs $75k-100k, 91.9% for AGIs $100k-200k, 94.8% for AGIs over 200k)
Averages for the 2012 tax year for zip code 91105, filed in 2013:
Average Adjusted Gross Income (AGI) in 2012: $221,455 (Individual Income Tax Returns)
Here:
$221,455
State:
$72,726
Salary/wage: $144,353 (reported on 69.9% of returns)
Here:
$144,353
State:
$59,079
(% of AGI for various income ranges: 57.2% for AGIs below $25k, 60.4% for AGIs $25k-50k, 59.7% for AGIs $50k-75k, 57.7% for AGIs $75k-100k, 60.4% for AGIs $100k-200k, 41.0% for AGIs over 200k)
Taxable interest for individuals: $5,605 (reported on 61.4% of returns)
This zip code:
$5,605
California:
$2,146
(% of AGI for various income ranges: 3.2% for AGIs below $25k, 2.2% for AGIs $25k-50k, 1.8% for AGIs $50k-75k, 1.8% for AGIs $75k-100k, 1.3% for AGIs $100k-200k, 1.5% for AGIs over 200k)
Ordinary dividends: $25,389 (reported on 48.2% of returns)
Here:
$25,389
State:
$9,308
(% of AGI for various income ranges: 7.9% for AGIs below $25k, 4.8% for AGIs $25k-50k, 4.8% for AGIs $50k-75k, 5.0% for AGIs $75k-100k, 3.8% for AGIs $100k-200k, 5.9% for AGIs over 200k)
Net capital gain/loss in AGI: +$75,635 (reported on 45.6% of returns)
Here:
+$75,635
State:
+$30,460
(% of AGI for various income ranges: 0.7% for AGIs below $25k, 0.9% for AGIs $25k-50k, 1.2% for AGIs $50k-75k, 2.4% for AGIs $75k-100k, 2.1% for AGIs $100k-200k, 20.0% for AGIs over 200k)
Profit/loss from business: +$45,959 (reported on 25.2% of returns)
Here:
+$45,959
State:
+$17,064
(% of AGI for various income ranges: 14.7% for AGIs below $25k, 10.9% for AGIs $25k-50k, 6.8% for AGIs $50k-75k, 6.2% for AGIs $75k-100k, 5.9% for AGIs $100k-200k, 4.7% for AGIs over 200k)
Taxable individual retirement arrangement distribution: $40,927 (reported on 18.5% of returns)
91105:
$40,927
California:
$19,557
(% of AGI for various income ranges: 4.5% for AGIs below $25k, 4.7% for AGIs $25k-50k, 4.2% for AGIs $50k-75k, 4.7% for AGIs $75k-100k, 5.9% for AGIs $100k-200k, 2.8% for AGIs over 200k)
Self-employment retirement plans: $36,207 (reported on 4.5% of returns)
91105:
$36,207
California:
$24,530
(% of AGI for various income ranges: 1.4% for AGIs $50k-75k, 0.5% for AGIs $100k-200k, 0.8% for AGIs over 200k)
Total itemized deductions: $65,425 (20% of AGI, reported on 63.0% of returns)
Here:
$65,425
State:
$34,004
Here:
19.9% of AGI
State:
22.7% of AGI
(% of AGI for various income ranges: 32.3% for AGIs below $25k, 21.9% for AGIs $25k-50k, 19.6% for AGIs $50k-75k, 23.0% for AGIs $75k-100k, 22.7% for AGIs $100k-200k, 17.3% for AGIs over 200k)
Charity contributions: $11,601 (reported on 55.5% of returns)
Here:
$11,601
State:
$4,659
(% of AGI for various income ranges: 1.3% for AGIs below $25k, 2.0% for AGIs $25k-50k, 2.0% for AGIs $50k-75k, 2.5% for AGIs $75k-100k, 2.8% for AGIs $100k-200k, 3.0% for AGIs over 200k)
Taxes paid: $32,788 (reported on 63.0% of returns)
91105:
$32,788
State:
$14,448
(% of AGI for various income ranges: 6.6% for AGIs below $25k, 5.7% for AGIs $25k-50k, 5.8% for AGIs $50k-75k, 7.4% for AGIs $75k-100k, 9.0% for AGIs $100k-200k, 9.8% for AGIs over 200k)
Earned income credit: $1,288 (reported on 5.4% of returns)
Here:
$1,288
State:
$2,286
(% of AGI for various income ranges: 2.4% for AGIs below $25k, 0.3% for AGIs $25k-50k)
Percentage of individuals using paid preparers for their 2012 taxes: 70.7%
Here:
71%
State:
64%
(% for various income ranges: 59.8% for AGIs below $25k, 65.8% for AGIs $25k-50k, 65.3% for AGIs $50k-75k, 73.4% for AGIs $75k-100k, 73.3% for AGIs $100k-200k, 82.1% for AGIs over 200k)
Averages for the 2004 tax year for zip code 91105, filed in 2005:
Average Adjusted Gross Income (AGI) in 2004: $165,000 (Individual Income Tax Returns)
Here:
$165,000
State:
$58,600
Salary/wage: $119,228 (reported on 67.1% of returns)
Here:
$119,228
State:
$49,455
(% of AGI for various income ranges: 56.6% for AGIs $10k-25k, 62.9% for AGIs $25k-50k, 57.0% for AGIs $50k-75k, 57.0% for AGIs $75k-100k, 46.0% for AGIs over 100k)
Taxable interest for individuals: $7,117 (reported on 70.9% of returns)
This zip code:
$7,117
California:
$2,365
(% of AGI for various income ranges: 8.1% for AGIs $10k-25k, 4.1% for AGIs $25k-50k, 3.7% for AGIs $50k-75k, 3.5% for AGIs $75k-100k, 2.8% for AGIs over 100k)
Taxable dividends: $21,647 (reported on 56.1% of returns)
Here:
$21,647
State:
$4,746
(% of AGI for various income ranges: 6.9% for AGIs $10k-25k, 4.3% for AGIs $25k-50k, 6.3% for AGIs $50k-75k, 5.3% for AGIs $75k-100k, 7.5% for AGIs over 100k)
Net capital gain/loss: +$46,573 (reported on 51.1% of returns)
Here:
+$46,573
State:
+$23,418
(% of AGI for various income ranges: -2.2% for AGIs $10k-25k, 1.1% for AGIs $25k-50k, 1.4% for AGIs $50k-75k, 2.1% for AGIs $75k-100k, 16.2% for AGIs over 100k)
Profit/loss from business: +$33,619 (reported on 26.2% of returns)
Here:
+$33,619
State:
+$16,826
(% of AGI for various income ranges: 15.3% for AGIs $10k-25k, 9.2% for AGIs $25k-50k, 6.4% for AGIs $50k-75k, 7.1% for AGIs $75k-100k, 4.8% for AGIs over 100k)
IRA payment deduction: $3,618 (reported on 3.6% of returns)
91105:
$3,618
California:
$3,192
(% of AGI for various income ranges: 0.5% for AGIs $10k-25k, 0.4% for AGIs $25k-50k, 0.2% for AGIs $50k-75k, 0.2% for AGIs $75k-100k, 0.0% for AGIs over 100k)
Self-employed pension: $26,447 (reported on 5.6% of returns)
Here:
$26,447
California:
$17,688
(% of AGI for various income ranges: 0.4% for AGIs $25k-50k, 0.4% for AGIs $50k-75k, 0.8% for AGIs $75k-100k, 0.9% for AGIs over 100k)
Total itemized deductions: $53,787 (22% of AGI, reported on 63.3% of returns)
Here:
$53,787
State:
$28,113
Here:
21.7% of AGI
State:
25.3% of AGI
(% of AGI for various income ranges: 31.6% for AGIs $10k-25k, 22.5% for AGIs $25k-50k, 26.1% for AGIs $50k-75k, 27.1% for AGIs $75k-100k, 19.4% for AGIs over 100k)
Charity contributions deductions: $12,074 (5% of AGI, reported on 58.4% of returns)
Here:
$12,074
State:
$3,923
Here:
4.6% of AGI
State:
3.3% of AGI
(% of AGI for various income ranges: 2.6% for AGIs $10k-25k, 2.7% for AGIs $25k-50k, 3.4% for AGIs $50k-75k, 3.6% for AGIs $75k-100k, 4.4% for AGIs over 100k)
Total tax: $37,631 (reported on 85.4% of returns)
91105:
$37,631
State:
$10,761
(% of AGI for various income ranges: 5.8% for AGIs $10k-25k, 8.9% for AGIs $25k-50k, 10.9% for AGIs $50k-75k, 11.9% for AGIs $75k-100k, 20.7% for AGIs over 100k)
Earned income credit: $1,000 (reported on 4.7% of returns)
Here:
$1,000
State:
$1,763
Percentage of individuals using paid preparers for their 2004 taxes: 74.7%
Here:
75%
State:
66%
(% for various income ranges: 65.2% for AGIs below $10k, 70.4% for AGIs $10k-25k, 68.6% for AGIs $25k-50k, 75.4% for AGIs $50k-75k, 76.9% for AGIs $75k-100k, 81.7% for AGIs over 100k)
Likely homosexual households (counted as self-reported same-sex unmarried-partner households)
Lesbian couples: 0.3% of all households
Gay men: 0.5% of all households
Household received Food Stamps/SNAP in the past 12 months: 113 Household did not receive Food Stamps/SNAP in the past 12 months: 5,501
Women who had a birth in the past 12 months: 88 (88 now married, 0 unmarried) Women who did not have a birth in the past 12 months: 2,568 (1,329 now married, 1,225 unmarried)
Housing units in zip code 91105 with a mortgage: 2,093 (236 second mortgage, 231 both second mortgage and home equity loan) Houses without a mortgage: 57
Median monthly owner costs for units with a mortgage: $3,876 Median monthly owner costs for units without a mortgage: $1,480
Residents with income below the poverty level in 2022:
This zip code:
5.6%
Whole state:
12.2%
Residents with income below 50% of the poverty level in 2022:
This zip code:
1.6%
Whole state:
6.2%
Median number of rooms in houses and condos:
Here:
6.6
State:
6.0
Median number of rooms in apartments:
Here:
3.7
State:
3.9
Notable locations in this zip code not listed on our city pages
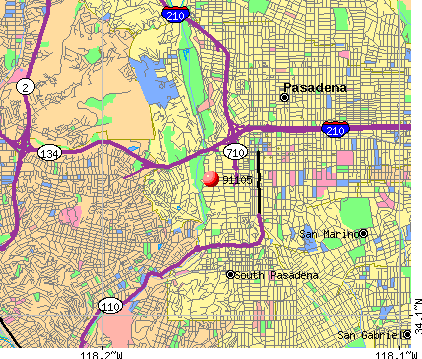
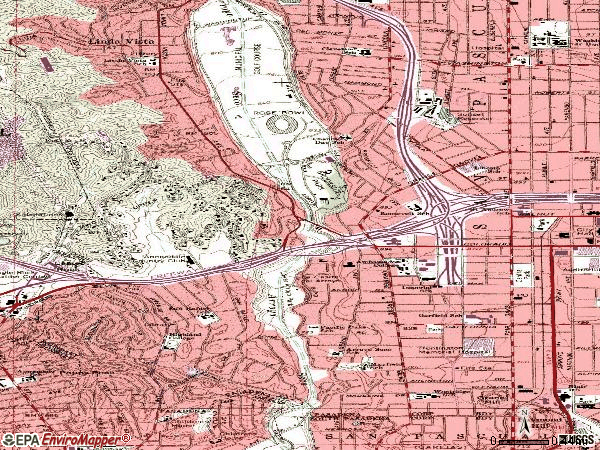
Notable locations in zip code 91105: Annandale Golf Course (A), Annandale Country Club (B), San Rafael Branch Pasadena Public Library (C), Ambassador Auditorium (D), Norton Simon Museum of Art (E), La Casita del Arroyo (F), Pasadena Fire Department Station 31 (G), Pasadena Fire Department Station 39 (H), East Patient Tower (I), Wingate Building (J), La Vina Building (K), Edward Valentine Building (L). Display/hide their locations on the map
Parks in zip code 91105 include: Central Park (1), Lower Arroyo Park (2), Busch Gardens (3), Carmelita Gardens (4), Singer Park (5), Defenders Parkway (6), San Rafael Park (7). Display/hide their locations on the map
1,515 married couples with children.
206 single-parent households (91 men, 115 women).
73.6% of residents of 91105 zip code speak English at home.
9.9% of residents speak Spanish at home (83% very well, 12% well, 5% not well).
4.0% of residents speak other Indo-European language at home (86% very well, 8% well, 4% not well, 2% not at all).
11.5% of residents speak Asian or Pacific Island language at home (63% very well, 23% well, 10% not well, 4% not at all).
1.3% of residents speak other language at home (87% very well, 9% well, 3% not well).
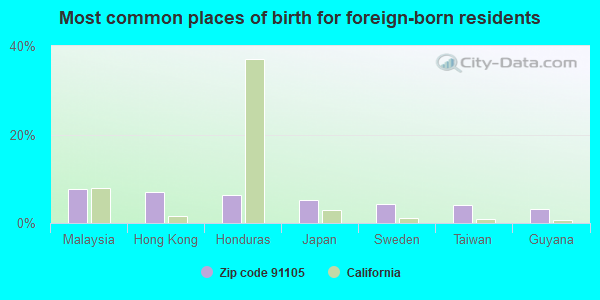
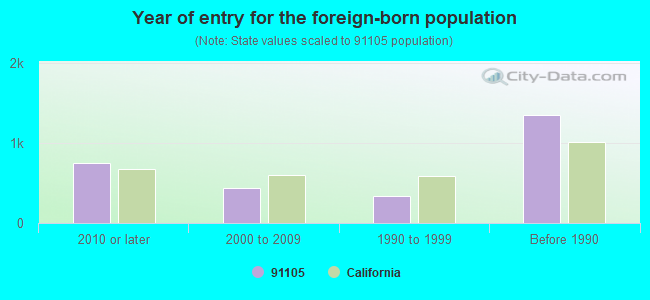
Foreign born population: 2,684 (21.3%) (67.3% of them are naturalized citizens)
Major facilities with environmental interests located in this zip code:
MONITOR POLISHING AND PLATING (390 SOUTH PASADENA AVENUE in PASADENA, CA)
AIR MINOR (AIRS/AFS) SUPERFUND (Superfund database) (Integrated Compliance Information System) - ICIS-09-2002-0045, FORMAL ENFORCEMENT ACTION CRITERIA AND HAZARDOUS AIR POLLUTANT INVENTORY (Inventory of air pollution sources) Small Quantity Generators, between 100 kg and 1000 kg of hazardous waste/month (Resource Conservation and Recovery Act (tracking hazardous waste)) Business SIC and NAICS classification: ELECTROPLATING, PLATING, POLISHING, ANODIZING, AND COLORING Organizations: MORGAN DAVID (CONTACT/OPERATOR)
Alternative names: MONITOR PLATING & POLISHING
HUNTINGTON TRUST (707 S RAYMOND AVE in PASADENA, CA)
STATE MASTER (California - Hazardous Waste Tracking) - HAZARDOU WASTE PROGRAM Large Quantity Generators, more that 1000 kg of hazardous waste/month (Resource Conservation and Recovery Act (tracking hazardous waste)) - notification Organizations: HUNTINGTON MEM HOSP TRUST (CONTACT/OWNER)
A P COMPANY (115 W CALIFORNIA BLVD in PASADENA, CA)
STATE MASTER (California - Hazardous Waste Tracking) - HAZARDOU WASTE PROGRAM TRANSPORTER (Resource Conservation and Recovery Act (tracking hazardous waste)) - notification USED OIL PROGRAM (Resource Conservation and Recovery Act (tracking hazardous waste))
ENVIRO CLEAN (137 WAVERLY DR in PASADENA, CA)
STATE MASTER (California - Hazardous Waste Tracking) - HAZARDOU WASTE PROGRAM TRANSPORTER (Resource Conservation and Recovery Act (tracking hazardous waste)) Organizations: JOE GIBBS (CONTACT/OPERATOR)
, JOE RAY ENT (CONTACT/OWNER)
GENZYME GENETICS (11 W DEL MAR BLVD in PASADENA, CA)
STATE MASTER (California - Hazardous Waste Tracking) - HAZARDOU WASTE PROGRAM Small Quantity Generators, between 100 kg and 1000 kg of hazardous waste/month (Resource Conservation and Recovery Act (tracking hazardous waste)) - notification Business NAICS classification: MEDICAL LABORATORIES. Organizations: GENZYME CORPORATION (CONTACT/OWNER)
Alternative names: GENETICS INSTITUTE THE
MOTOROLA LIKE SCIENCES (757 SOUTH RAYMOND AVENUE in PASADENA, CA)
STATE MASTER (California - Hazardous Waste Tracking) - HAZARDOU WASTE PROGRAM Small Quantity Generators, between 100 kg and 1000 kg of hazardous waste/month (Resource Conservation and Recovery Act (tracking hazardous waste)) - notification Business NAICS classification: MEDICAL LABORATORIES. Organizations: JON KAYYEM / ED COOK (CONTACT/OPERATOR)
, MOTOROLA INC (CONTACT/OWNER)
Alternative names: CLINICAL MICRO SENSORS, MOTOROLA LIFE SCIENCES
EQUILON ENTERPRISES (1050 S FAIR OAKS in PASADENA, CA) . Federal Facility
STATE MASTER (California - Hazardous Waste Tracking) - HAZARDOU WASTE PROGRAM Small Quantity Generators, between 100 kg and 1000 kg of hazardous waste/month (Resource Conservation and Recovery Act (tracking hazardous waste)) - notification Organizations: EQUILON ENTERPRISES, LLC (CONTACT/OWNER)
Alternative names: SHELL OIL CO
GEM HEALTHCARE, LLC (716 S FAIR OAKS AVE in PASADENA, CA) . Federal Facility
STATE MASTER (California - Hazardous Waste Tracking) - HAZARDOU WASTE PROGRAM Small Quantity Generators, between 100 kg and 1000 kg of hazardous waste/month (Resource Conservation and Recovery Act (tracking hazardous waste)) - notification Organizations: PASADENA HOSPITAL ASSOC (CONTACT/OWNER)
Alternative names: HUNTINGTON EXTENDED CARE
HOME VAN VECHTEN THE (450 S ARROYO PKY in PASADENA, CA)
STATE MASTER (California - Hazardous Waste Tracking) - HAZARDOU WASTE PROGRAM Small Quantity Generators, between 100 kg and 1000 kg of hazardous waste/month (Resource Conservation and Recovery Act (tracking hazardous waste))
HUNTINGTON MEMORIAL HOSPITAL (100 CONGRESS ST in PASADENA, CA)
AIR MAJOR (AIRS/AFS) COMPLIANCE ACTIVITY (Tracking inspections of insecticide, fungicide, and rodenticide, and toxic substances) CRITERIA AND HAZARDOUS AIR POLLUTANT INVENTORY (Inventory of air pollution sources) Business SIC and NAICS classification: GENERAL MEDICAL AND SURGICAL HOSPITALS
ADLOFF & KING PLATING CO, INC (965 S FAIR OAKS in PASADENA, CA)
Small Quantity Generators, between 100 kg and 1000 kg of hazardous waste/month (Resource Conservation and Recovery Act (tracking hazardous waste)) - notification
AFP DIAGNOSTIC INC (49 W DEL MAR BLVD in PASADENA, CA)
Small Quantity Generators, between 100 kg and 1000 kg of hazardous waste/month (Resource Conservation and Recovery Act (tracking hazardous waste)) - notification Organizations: OMAR S ALFI MD (CONTACT/OWNER)
FARRIS AND SONS AUTO SVC (621 S ARROYO PARKWAY UNIT B in PASADENA, CA)
Small Quantity Generators, between 100 kg and 1000 kg of hazardous waste/month (Resource Conservation and Recovery Act (tracking hazardous waste)) - notification Organizations: ALLAN CHU (CONTACT/OWNER)
Housing units lacking complete kitchen facilities: 1.6%
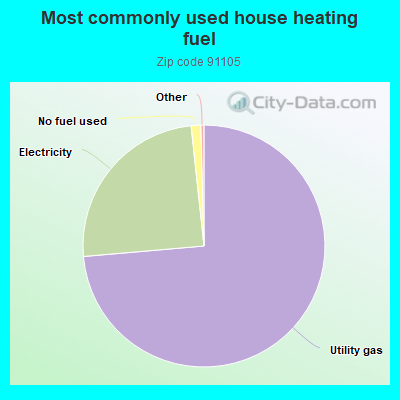
73.7%Utility gas
24.7%Electricity
1.3%No fuel used
Population in 1990: 11,165.
Place of birth for U.S.-born residents:
This state: 6,161
Northeast: 1,279
Midwest: 1,205
South: 678
West: 325
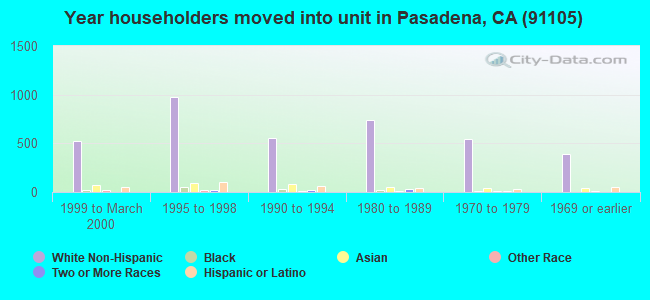
60% of the 91105 zip code residents lived in the same house 5 years ago. Out of people who lived in different houses, 75% lived in this county. Out of people who lived in different counties, 50% lived in California.
82% of the 91105 zip code residents lived in the same house 1 year ago. Out of people who lived in different houses, 61% moved from this county. Out of people who lived in different houses, 11% moved from different county within same state. Out of people who lived in different houses, 11% moved from different state. Out of people who lived in different houses, 16% moved from abroad.
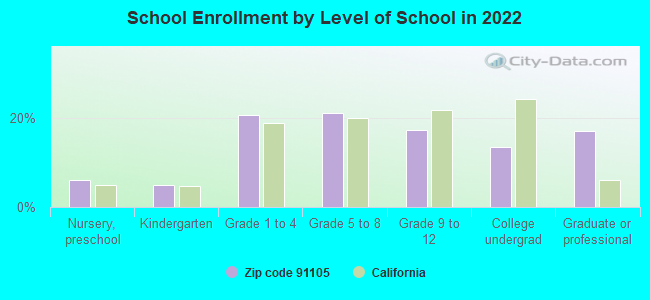
Private vs. public school enrollment:
Students in private schools in grades 1 to 8 (elementary and middle school): 585
Here:
62.5%
California:
10.5%
Students in private schools in grades 9 to 12 (high school): 271
Here:
74.1%
California:
8.5%
Students in private undergraduate colleges: 174
Here:
59.2%
California:
15.9%
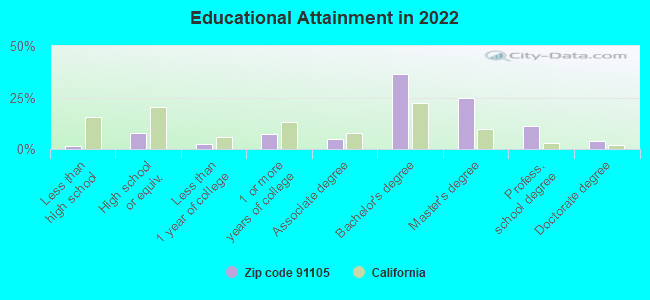
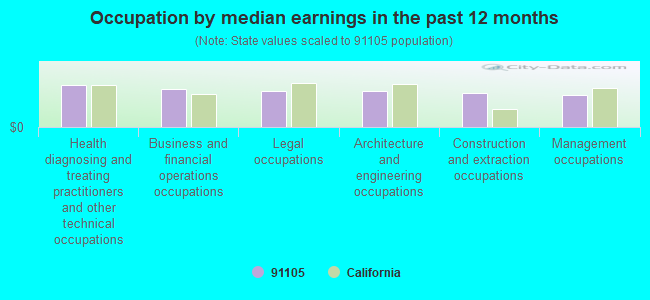
Occupation by median earnings in the past 12 months ($)
156,674Health diagnosing and treating practitioners and other technical occupations
140,642Business and financial operations occupations
134,427Legal occupations
134,017Architecture and engineering occupations
125,704Construction and extraction occupations
120,896Management occupations
Companies with biggest federal contracts located in this zip code (PASADENA, CA):
JACOBS ENGINEERING GROUP INC (1111 S ARROYO PKWY) : $343,733,134 in 1134 contractsfrom 1999 to 2006
Contracts for Maintenance, Repair or Alteration of Real Property -- Unimproved Real Property (Land), Airfield, Communication and Missile Facilities, Architect - Engineer Services (including landscaping, interior layout, and designing), Maintenance, Repair or Alteration of Real Property -- Restoration of real property, and moreby Air Force, Army, Public Buildings Service, National Institutes of Health, and others Signed by year:2000: $86,166,162; 2001: $65,405,689; 2002: $56,404,876; 2003: $33,487,337; 2004: $40,139,916; 2005: $48,676,595; 2006: $7,264,734.
Biggest contracts:
$7,352,596 with Air Force for Maintenance, Repair or Alteration of Real Property -- Unimproved Real Property (Land). Taking place in MA. Signed on 2000-02-16. Completion date: 2001-02-15.
$6,681,000 with Air Force for Airfield, Communication and Missile Facilities. Taking place in MA. Signed on 2000-09-28. Completion date: 2002-12-31.
$6,464,426 with Air Force for Architect - Engineer Services (including landscaping, interior layout, and designing). Taking place in MD. Signed on 2005-07-20. Completion date: 2005-12-30.
$6,442,663 with Air Force for Airfield, Communication and Missile Facilities. Taking place in MA. Signed on 2001-02-15. Completion date: 2002-02-14.
MATHEMATICAL SYSTEMS & SOLUTIO (685 BUSCH GARDEN DR; small business) : $699,697 in 4 contractsfrom 2001 to 2005
$299,779 with Air Force for Physical Sciences -- Management and Support (R&D). Signed on 2004-03-18. Completion date: 2005-05-31.
$200,000 with Air Force for Mathematical and Computer Sciences -- Management and Support (R&D). Signed on 2003-06-03. Completion date: 2004-05-31.
$99,984 with Air Force for Physical Sciences -- Management and Support (R&D). Signed on 2001-10-19. Completion date: 2002-10-21.
$99,934, same as above.Signed on 2005-07-08. Completion date: 2006-04-30.
ROGERSON KRATOS (403 S RAYMOND AVE; small business) 100 employees, $0 revenue. : $656,375 in 30 contractsfrom 2001 to 2006
Contracts for Pressure, Temperature, and Humidity Measuring and Controlling Instruments, Airframe Structural Components, Liquid and Gas Flow, Liquid Level, and Mechanical Motion Measuring Instruments, Electrical and Electronic Properties Measuring and Testing Instruments, and moreby Defense Logistics Agency, Air Force, Navy, Army, and others Signed by year:2000: $0; 2001: $35,070; 2002: $71,292; 2003: $2,619; 2004: $112,229; 2005: $285,582; 2006: $149,583.
Biggest contracts:
$87,360 with Defense Logistics Agency for Pressure, Temperature, and Humidity Measuring and Controlling Instruments. Signed on 2005-04-19. Completion date: 2005-05-19.
$75,400, same as above.Signed on 2005-05-18. Completion date: 2005-11-09.
$64,980 with Defense Logistics Agency for Airframe Structural Components. Signed on 2002-04-26. Completion date: 2002-12-06.
$57,080 with Defense Logistics Agency for Liquid and Gas Flow, Liquid Level, and Mechanical Motion Measuring Instruments. Signed on 2004-04-26. Completion date: 2004-10-05.
PHASEBRIDGE INC (859 S RAYMOND AVE; small business) : $612,940 in 4 contractsfrom 2001 to 2005
$349,993 with Department of Defense for Defense Electronics and Communication Equipment -- Advanced Development (R&D). Signed on 2005-03-08. Completion date: 2005-09-07.
$98,219 with Air Force for Other Defense -- Basic Research (R&D). Signed on 2004-08-02. Completion date: 2005-07-18.
$95,008 with Army for Other Defense -- Applied Research and Exploratory Development (R&D). Signed on 2001-03-26. Completion date: 2001-11-30.
$69,720 with Army for Other Research and Development -- Basic Research (R&D). Signed on 2003-12-12. Completion date: 2004-06-14.
ALFIGEN, INC (11 WEST DEL MAR BOULEVARD; small business) : $258,410 in 16 contractsfrom 2002 to 2005
Contracts for Laboratory Testing Services by Army, Navy Signed by year:2000: $0; 2001: $0; 2002: $51,510; 2003: $111,500; 2004: $79,875; 2005: $15,525; 2006: $0.
Biggest contracts:
$51,510 with Army for Laboratory Testing Services. Signed on 2002-10-31. Completion date: 2003-09-30.
$51,500 with Army for Laboratory Testing Services. Taking place in KS. Signed on 2003-11-07. Completion date: 2004-09-30.
$15,000 with Navy for Laboratory Testing Services. Signed on 2003-12-29. Completion date: 2004-01-31.
$15,000, same as above.Signed on 2003-10-01. Completion date: 2003-10-01.
MEASUREMENT SCIENCE ENTERPRISE (123 W BELLEVUE DRIVE, SUI; small business) : $257,527 in 4 contractsfrom 2004 to 2006
$80,121 with Defense Threat Reduction Agency for Physical Properties Testing and Inspection. Signed on 2006-01-20. Completion date: 2006-04-29.
$69,932 with Army for Other Research and Development -- Applied Research and Exploratory Development (R&D). Signed on 2004-09-10. Completion date: 2005-09-09.
$67,665 with Air Force for Electrical and Electronic Properties Measuring and Testing Instruments. Signed on 2005-07-05. Completion date: 2005-09-20.
$39,809 with Defense Threat Reduction Agency for Physical Properties Testing and Inspection. Signed on 2006-02-23. Completion date: 2006-04-29.
DISC MARKETING INC (35 WEST DAYTON ST; small business) : $175,900 in 5 contractsfrom 2002 to 2003
Contracts for Program Review/Development Services, Military Personnel Recruitment by Army Signed by year:2000: $0; 2001: $0; 2002: $56,500; 2003: $119,400; 2004: $0; 2005: $0; 2006: $0.
Biggest contracts:
$69,400 with Army for Program Review/Development Services. Signed on 2003-05-30. Completion date: 2003-07-18.
$60,000, same as above.Signed on 2003-03-18. Completion date: 2003-07-18.
$46,500 with Army for Military Personnel Recruitment. Signed on 2002-09-14. Completion date: 2002-11-08.
$10,000, same as above.Signed on 2002-11-25. Completion date: 2002-11-08.
TECH/KNOWLEDGE INC (200 E DEL MAR AVE STE 300; small business)
$60,900 with Air Force for Other Special Studies and Analyses. Signed on 2003-09-30. Completion date: 2003-12-11.
ARGA CONTROLS INC (35 E GLENARM ST; small business) : $53,462 in 9 contractsfrom 2005 to 2006
Contracts for Electrical and Electronic Properties Measuring and Testing Instruments, Miscellaneous Special Industry Machinery by Defense Logistics Agency, Army, U.S. Army Corps of Engineers - civil program financing only Signed by year:2000: $0; 2001: $0; 2002: $0; 2003: $0; 2004: $0; 2005: $50,312; 2006: $3,150.
Biggest contracts:
$11,500 with Defense Logistics Agency for Electrical and Electronic Properties Measuring and Testing Instruments. Signed on 2005-09-28. Completion date: 2006-01-27.
$10,920, same as above.Signed on 2005-01-28. Completion date: 2005-03-15.
$10,920, same as above.Signed on 2005-01-28. Completion date: 2005-03-15.
$4,550, same as above.Signed on 2005-10-04. Completion date: 2006-01-30.
M3 LLC (54 WEST GREEN STREET, STUD)
$29,509 with Air Force for Office Furniture. Signed on 2001-01-24. Completion date: 2001-02-28.
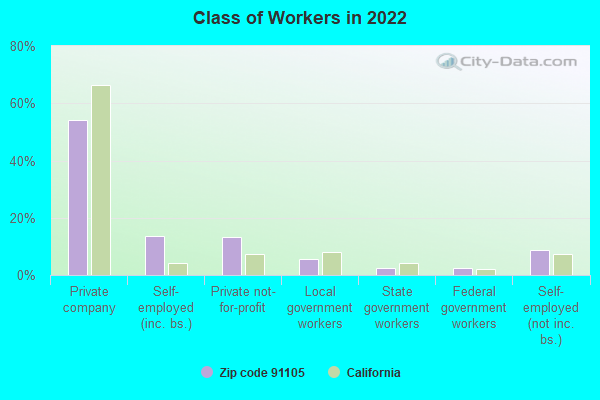
Top industries in this zip code by the number of employees in 2005:
2005 - 2018 National Fire Incident Reporting System (NFIRS) incidents
Based on the data from the years 2005 - 2018 the average number of fires per year is 35. The highest number of reported fire incidents - 54 took place in 2017, and the least - 22 in 2012. The data has a growing trend.
When looking into fire subcategories, the most incidents belonged to: Structure Fires (44.7%), and Mobile Property/Vehicle Fires (25.1%).
Fire incident types reported to NFIRS in Zip Code 91105


 Nearest zip codes: 91101, 91103, 91030, 90042, 91106, 90041.


 Based on the data from the years 2005 - 2018 the average number of fires per year is 35. The highest number of reported fire incidents - 54 took place in 2017, and the least - 22 in 2012. The data has a growing trend.
 When looking into fire subcategories, the most incidents belonged to: Structure Fires (44.7%), and Mobile Property/Vehicle Fires (25.1%).