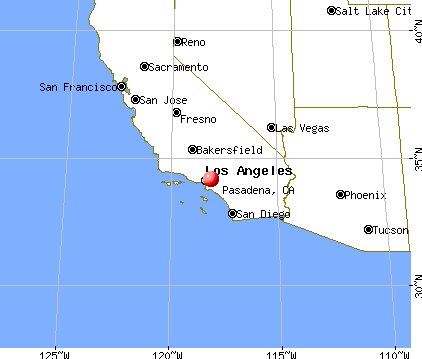
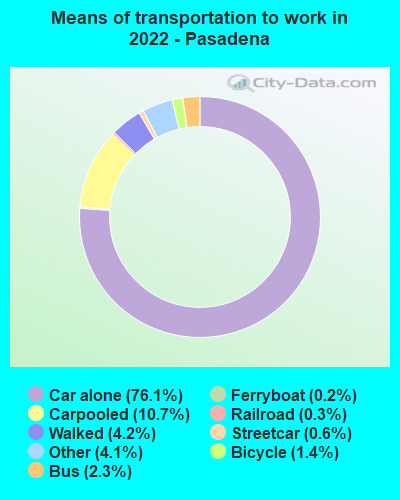
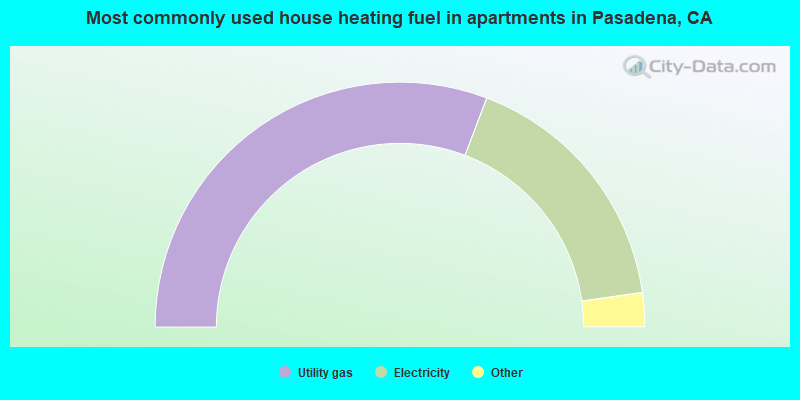
Pasadena, California
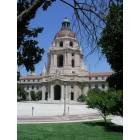
Pasadena: City Hall
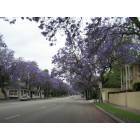
Pasadena: Jacarnda in Pasadena in June

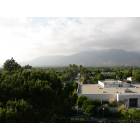
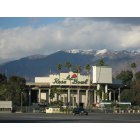
Pasadena: view of San Gabriel Mountains looking over Pasadena
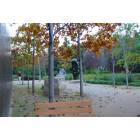
Pasadena: Looking north from the building in Pasadena City College
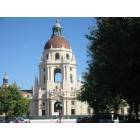
Pasadena: Pasadena City Hall after retrofit, April 2007
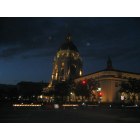
Pasadena: Pasadena City Hall
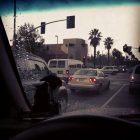
Pasadena: A Beautyfull Rainy Day in Pasadena Ca Taken At Lake Ave & Washington Blvd...
Pasadena: Rose Bowl-January 2010
Pasadena: Norton Simon Museum

Pasadena: Pasadena City Hall during Retrofit
Pasadena: Pasadena Sunset
- add
your
Submit your own pictures of this city and show them to the world
- OSM Map
- General Map
- Google Map
- MSN Map
Population change since 2000: +0.2%
 |
| Males: 67,668 | |
| Females: 66,543 |
| Median resident age: | 39.4 years |
| California median age: | 37.9 years |
Zip codes: 91101, 91106, 91108.
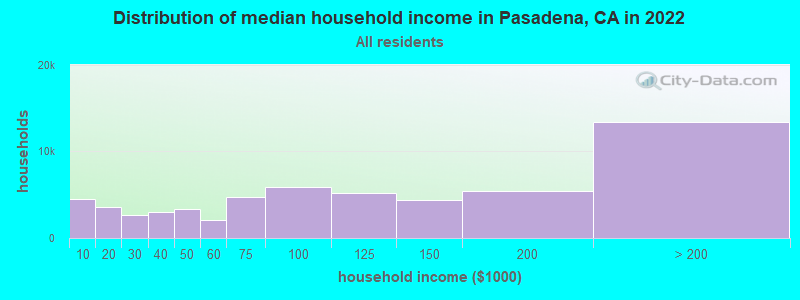
Pasadena Zip Code Map| Pasadena: | $95,134 |
| CA: | $91,551 |
Estimated per capita income in 2022: $66,260 (it was $28,186 in 2000)
Pasadena city income, earnings, and wages data
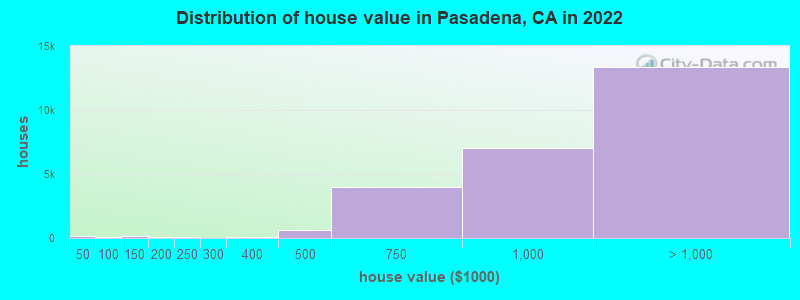
Estimated median house or condo value in 2022: over $1,000,000 (it was $268,100 in 2000)
| Pasadena: | over $1,000,000 |
| CA: | $715,900 |
Mean prices in 2022: all housing units: over $1,000,000; detached houses: over $1,000,000; townhouses or other attached units: over $1,000,000; in 2-unit structures: $642,135; in 3-to-4-unit structures: $971,552; in 5-or-more-unit structures: $954,338; mobile homes: $138,717
Median gross rent in 2022: $1,985.
(8.2% for White Non-Hispanic residents, 18.6% for Black residents, 15.8% for Hispanic or Latino residents, 20.2% for other race residents, 11.0% for two or more races residents)
Detailed information about poverty and poor residents in Pasadena, CA


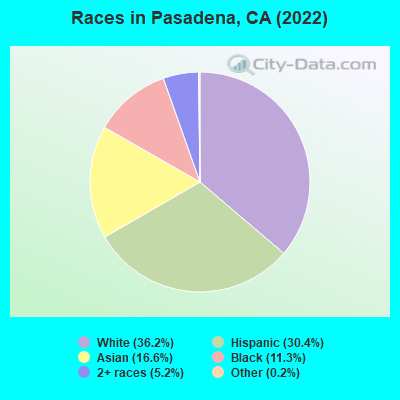
- 48,54436.2%White alone
- 40,86630.4%Hispanic
- 22,22316.6%Asian alone
- 15,18011.3%Black alone
- 6,9925.2%Two or more races
- 3290.2%Other race alone
- 800.06%American Indian alone
According to our research of California and other state lists, there were 104 registered sex offenders living in Pasadena, California as of April 27, 2024.
The ratio of all residents to sex offenders in Pasadena is 1,366 to 1.
The ratio of registered sex offenders to all residents in this city is lower than the state average.
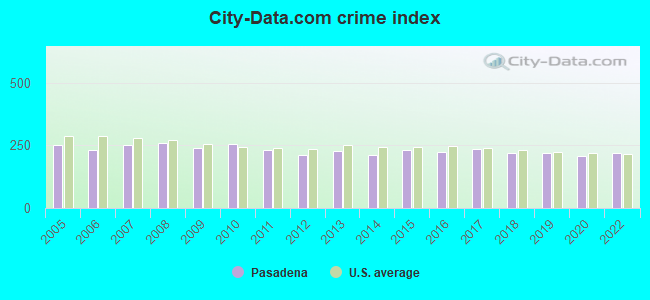
The City-Data.com crime index weighs serious crimes and violent crimes more heavily. Higher means more crime, U.S. average is 246.1. It adjusts for the number of visitors and daily workers commuting into cities.
- means the value is smaller than the state average.- means the value is about the same as the state average.
- means the value is bigger than the state average.
- means the value is much bigger than the state average.
Crime rate in Pasadena detailed stats: murders, rapes, robberies, assaults, burglaries, thefts, arson
Full-time law enforcement employees in 2021, including police officers: 325 (221 officers - 188 male; 33 female).
| Officers per 1,000 residents here: | 1.56 |
| California average: | 2.30 |
 Recent articles from our blog. Our writers, many of them Ph.D. graduates or candidates, create easy-to-read articles on a wide variety of topics.


Latest news from Pasadena, CA collected exclusively by city-data.com from local newspapers, TV, and radio stations
Ancestries: Armenian (3.1%), English (2.8%), Italian (2.1%), German (1.9%), European (1.7%), Irish (1.6%).
Current Local Time: PST time zone
Elevation: 865 feet
Land area: 23.1 square miles.
Population density: 5,811 people per square mile (average).
39,336 residents are foreign born (13.0% Latin America, 12.7% Asia).
| This city: | 29.2% |
| California: | 26.5% |
Median real estate property taxes paid for housing units with mortgages in 2022: $7,305 (0.6%)
Median real estate property taxes paid for housing units with no mortgage in 2022: $3,643 (0.4%)
Nearest city with pop. 200,000+: Southwest San Gabriel Valley, CA (6.5 miles  , pop. 320,008).
Nearest city with pop. 1,000,000+: Los Angeles, CA (14.8 miles , pop. 3,694,820).
Nearest cities:
), ), Latitude: 34.16 N, Longitude: 118.13 W
Daytime population change due to commuting: +35,720 (+26.6%)
Workers who live and work in this city: 39,900 (50.9%)
Area code commonly used in this area: 626
Property values in Pasadena, CA
Pasadena tourist attractions:
- Hilton Pasadena
- California Institute of Technology
- Eaton Canyon Natural Area
- Eaton Canyon
- Colorado Boulevard
- Gold Class Cinema
- Lake Avenue
- Jet Propulsion Laboratory
- Kidspace Children's Museum
- Ice House Comedy Nightclub
- Norton Simon Museum
- Playhouse District
- Red White & Bluezz
- Pasadena Convention Center
- Pasadena Ice Skating Center
- Pasadena Playhouse
- Old Pasadena
- Pacific Asia Museum
- Sheraton Pasadena
- Tournament of Roses Association
- Wrigley Gardens
- Courtyard by Marriott Los Angeles Old Pasadena
- The Rose Bowl And Tournament Of Roses Parade In Pasadena, California
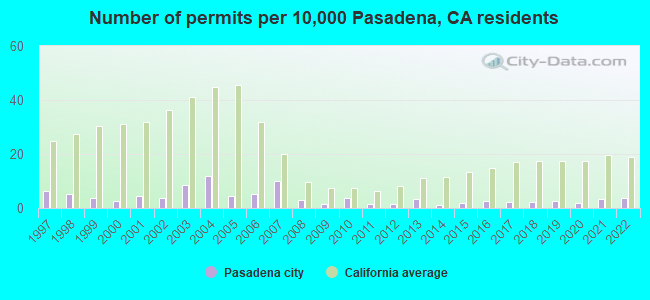
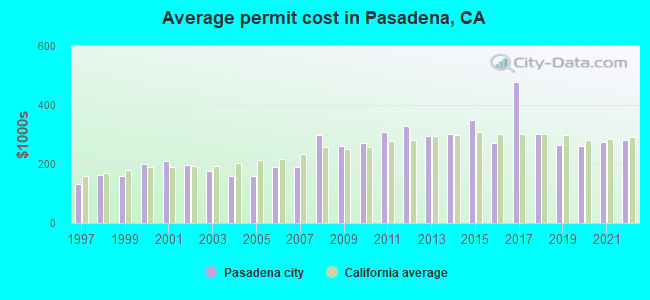
Single-family new house construction building permits:
- 2022: 51 buildings, average cost: $281,700
- 2021: 46 buildings, average cost: $275,300
- 2020: 23 buildings, average cost: $261,600
- 2019: 35 buildings, average cost: $266,400
- 2018: 31 buildings, average cost: $302,700
- 2017: 30 buildings, average cost: $476,700
- 2016: 33 buildings, average cost: $271,500
- 2015: 26 buildings, average cost: $349,000
- 2014: 15 buildings, average cost: $302,200
- 2013: 44 buildings, average cost: $296,100
- 2012: 22 buildings, average cost: $329,700
- 2011: 21 buildings, average cost: $306,900
- 2010: 52 buildings, average cost: $271,800
- 2009: 20 buildings, average cost: $261,900
- 2008: 39 buildings, average cost: $298,000
- 2007: 133 buildings, average cost: $190,000
- 2006: 68 buildings, average cost: $189,200
- 2005: 61 buildings, average cost: $159,000
- 2004: 160 buildings, average cost: $160,600
- 2003: 113 buildings, average cost: $175,000
- 2002: 52 buildings, average cost: $196,700
- 2001: 59 buildings, average cost: $209,900
- 2000: 33 buildings, average cost: $199,200
- 1999: 49 buildings, average cost: $160,500
- 1998: 68 buildings, average cost: $162,300
- 1997: 85 buildings, average cost: $133,100
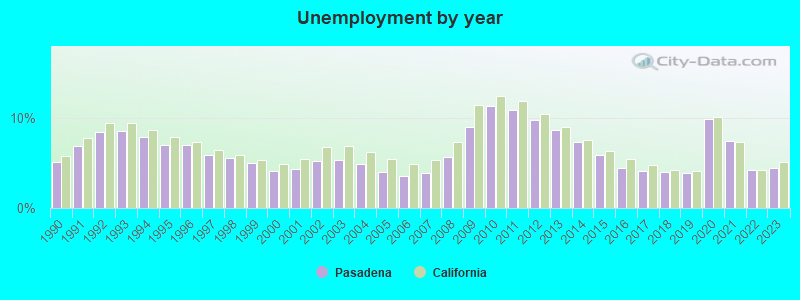
| Here: | 4.4% |
| California: | 5.1% |
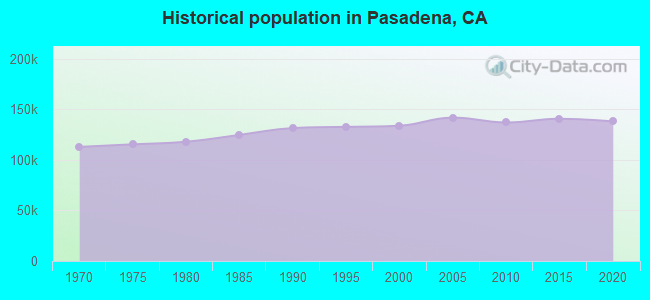
Population change in the 1990s: +2,021 (+1.5%).
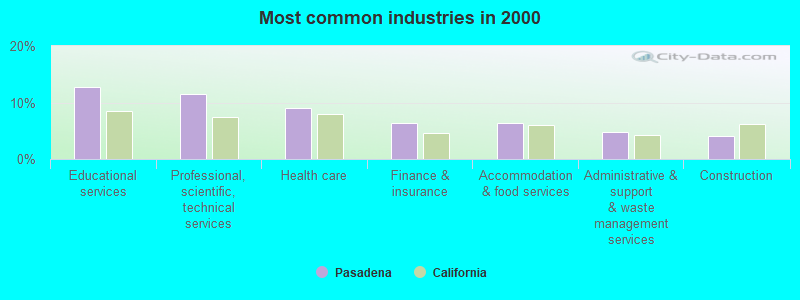
- Educational services (12.7%)
- Professional, scientific, technical services (11.4%)
- Health care (9.0%)
- Finance & insurance (6.3%)
- Accommodation & food services (6.3%)
- Administrative & support & waste management services (4.8%)
- Construction (4.1%)
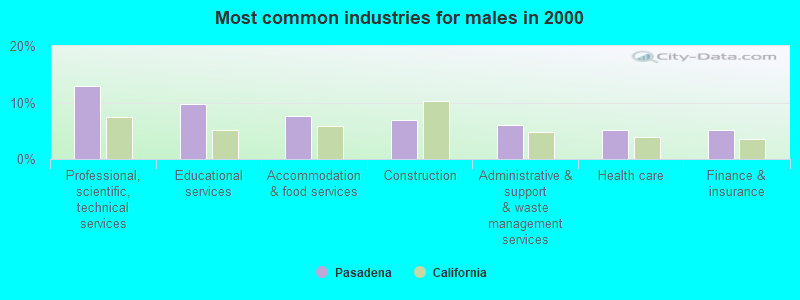
- Professional, scientific, technical services (12.9%)
- Educational services (9.8%)
- Accommodation & food services (7.6%)
- Construction (6.9%)
- Administrative & support & waste management services (6.0%)
- Health care (5.1%)
- Finance & insurance (5.1%)
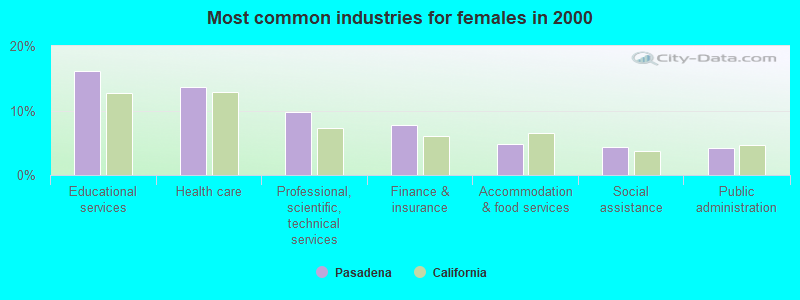
- Educational services (16.1%)
- Health care (13.6%)
- Professional, scientific, technical services (9.7%)
- Finance & insurance (7.8%)
- Accommodation & food services (4.8%)
- Social assistance (4.4%)
- Public administration (4.2%)
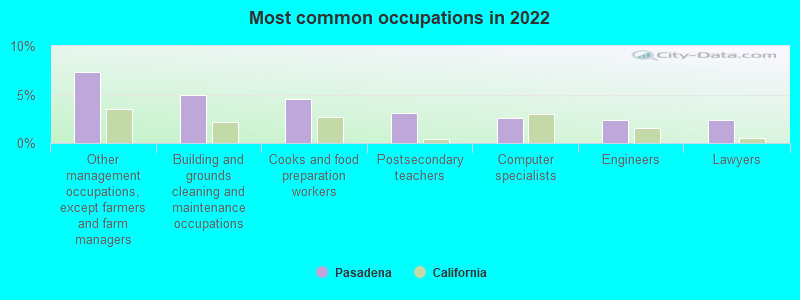
- Other management occupations, except farmers and farm managers (7.3%)
- Building and grounds cleaning and maintenance occupations (5.0%)
- Cooks and food preparation workers (4.5%)
- Postsecondary teachers (3.1%)
- Computer specialists (2.6%)
- Engineers (2.4%)
- Lawyers (2.4%)
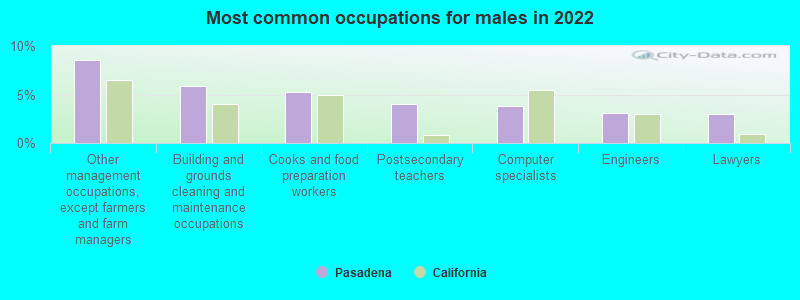
- Other management occupations, except farmers and farm managers (8.5%)
- Building and grounds cleaning and maintenance occupations (5.9%)
- Cooks and food preparation workers (5.3%)
- Postsecondary teachers (4.0%)
- Computer specialists (3.8%)
- Engineers (3.1%)
- Lawyers (3.0%)
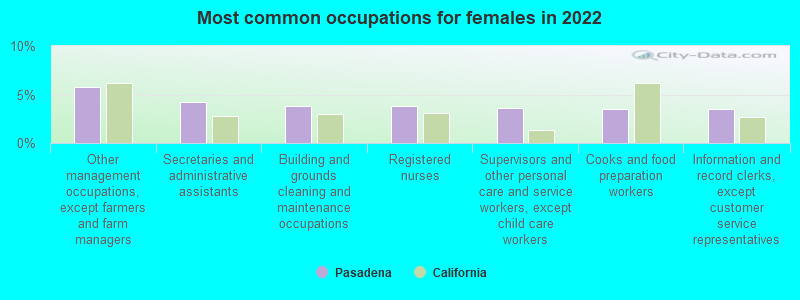
- Other management occupations, except farmers and farm managers (5.8%)
- Secretaries and administrative assistants (4.2%)
- Building and grounds cleaning and maintenance occupations (3.8%)
- Registered nurses (3.8%)
- Supervisors and other personal care and service workers, except child care workers (3.6%)
- Cooks and food preparation workers (3.6%)
- Information and record clerks, except customer service representatives (3.5%)
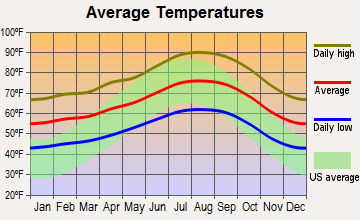
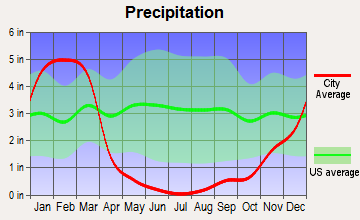
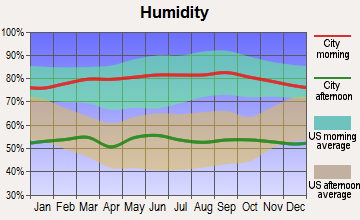
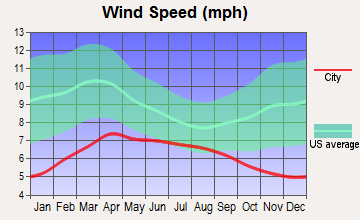
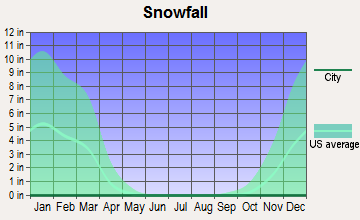
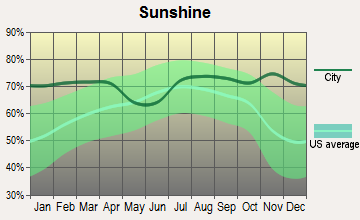
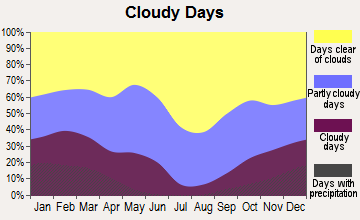
Average climate in Pasadena, California
Based on data reported by over 4,000 weather stations
|
|

(lower is better)
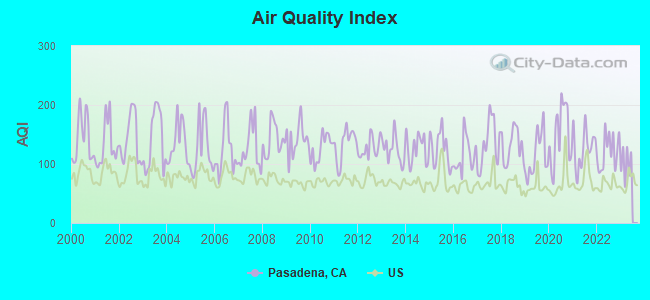
Air Quality Index (AQI) level in 2022 was 121. This is significantly worse than average.
| City: | 121 |
| U.S.: | 73 |
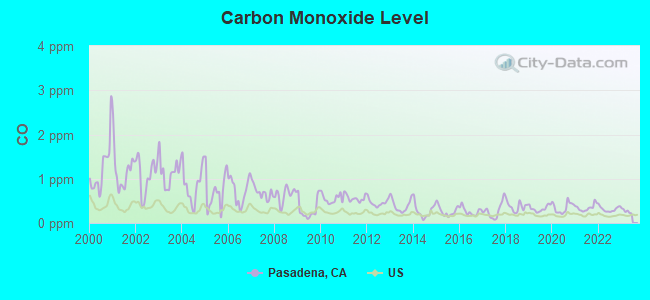
Carbon Monoxide (CO) [ppm] level in 2022 was 0.314. This is worse than average. Closest monitor was 0.1 miles away from the city center.
| City: | 0.314 |
| U.S.: | 0.251 |
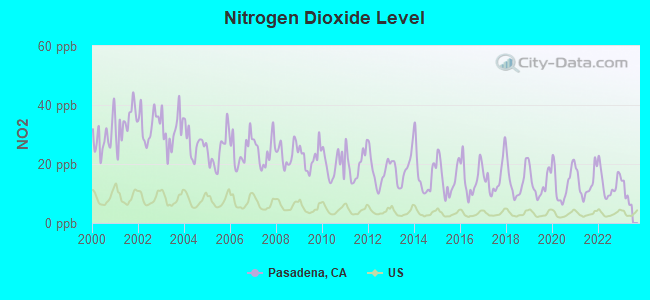
Nitrogen Dioxide (NO2) [ppb] level in 2022 was 13.3. This is significantly worse than average. Closest monitor was 0.1 miles away from the city center.
| City: | 13.3 |
| U.S.: | 5.1 |
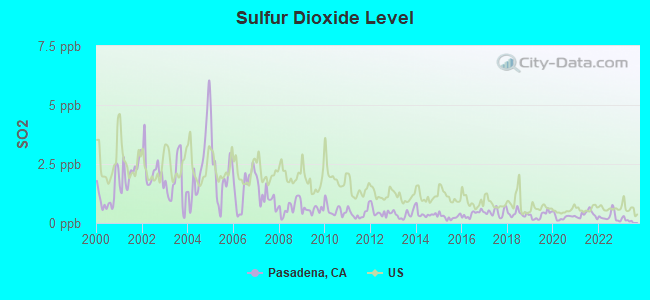
Sulfur Dioxide (SO2) [ppb] level in 2022 was 0.266. This is significantly better than average. Closest monitor was 0.1 miles away from the city center.
| City: | 0.266 |
| U.S.: | 1.515 |
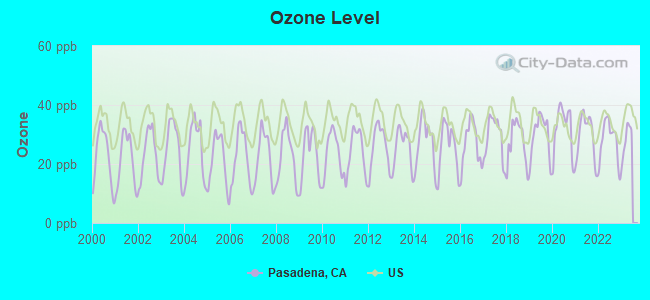
Ozone [ppb] level in 2022 was 27.8. This is about average. Closest monitor was 0.6 miles away from the city center.
| City: | 27.8 |
| U.S.: | 33.3 |
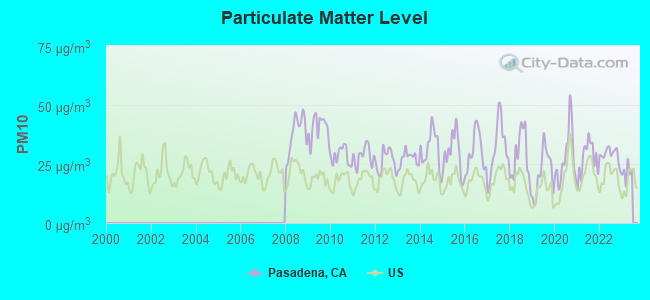
Particulate Matter (PM10) [µg/m3] level in 2022 was 28.9. This is significantly worse than average. Closest monitor was 8.2 miles away from the city center.
| City: | 28.9 |
| U.S.: | 19.2 |
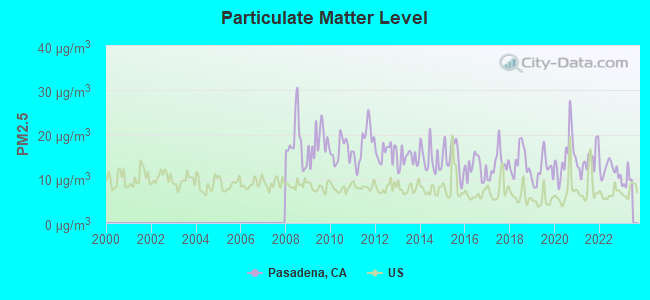
Particulate Matter (PM2.5) [µg/m3] level in 2022 was 12.1. This is significantly worse than average. Closest monitor was 1.6 miles away from the city center.
| City: | 12.1 |
| U.S.: | 8.1 |
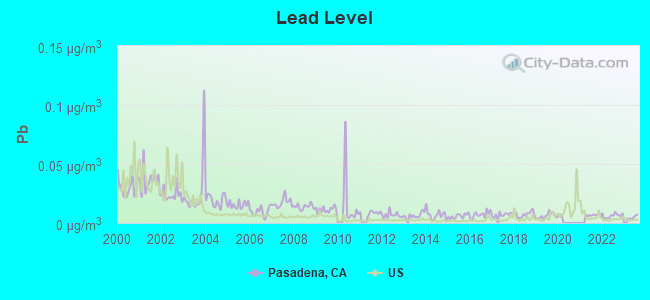
Lead (Pb) [µg/m3] level in 2022 was 0.00609. This is significantly better than average. Closest monitor was 0.1 miles away from the city center.
| City: | 0.00609 |
| U.S.: | 0.00931 |
Earthquake activity:
Pasadena-area historical earthquake activity is significantly above California state average. It is 7166% greater than the overall U.S. average.On 7/21/1952 at 11:52:14, a magnitude 7.7 (7.7 UK, Class: Major, Intensity: VIII - XII) earthquake occurred 76.5 miles away from the city center, causing $50,000,000 total damage
On 6/28/1992 at 11:57:34, a magnitude 7.6 (6.2 MB, 7.6 MS, 7.3 MW, Depth: 0.7 mi) earthquake occurred 91.6 miles away from Pasadena center, causing 3 deaths (1 shaking deaths, 2 other deaths) and 400 injuries, causing $100,000,000 total damage and $40,000,000 insured losses
On 10/16/1999 at 09:46:44, a magnitude 7.4 (6.3 MB, 7.4 MS, 7.2 MW, 7.3 ML) earthquake occurred 100.0 miles away from Pasadena center
On 11/4/1927 at 13:51:53, a magnitude 7.5 (7.5 UK) earthquake occurred 173.3 miles away from the city center
On 1/17/1994 at 12:30:55, a magnitude 6.8 (6.4 MB, 6.8 MS, 6.7 MW, Depth: 11.4 mi, Class: Strong, Intensity: VII - IX) earthquake occurred 25.4 miles away from the city center, causing 60 deaths (60 shaking deaths) and 7000 injuries
On 4/21/1918 at 22:32:30, a magnitude 6.8 (6.8 UK) earthquake occurred 46.3 miles away from Pasadena center
Magnitude types: body-wave magnitude (MB), local magnitude (ML), surface-wave magnitude (MS), moment magnitude (MW)
Natural disasters:
The number of natural disasters in Los Angeles County (57) is a lot greater than the US average (15).Major Disasters (Presidential) Declared: 27
Emergencies Declared: 3
Causes of natural disasters: Fires: 37, Floods: 16, Storms: 9, Winter Storms: 6, Landslides: 5, Mudslides: 5, Earthquakes: 3, Freeze: 1, Heavy Rain: 1, Hurricane: 1, Snow: 1, Tornado: 1, Wind: 1, Other: 1 (Note: some incidents may be assigned to more than one category).
Main business address for: WESCO FINANCIAL CORP (SERVICES-EQUIPMENT RENTAL & LEASING, NEC), AMERON INTERNATIONAL CORP (CONCRETE GYPSUM PLASTER PRODUCTS), JACOBS ENGINEERING GROUP INC /DE/ (HEAVY CONSTRUCTION OTHER THAN BUILDING CONST - CONTRACTORS), PAULA FINANCIAL (FIRE, MARINE & CASUALTY INSURANCE), ALEXANDRIA REAL ESTATE EQUITIES INC (REAL ESTATE INVESTMENT TRUSTS), AUTOIMMUNE INC (BIOLOGICAL PRODUCTS (NO DIAGNOSTIC SUBSTANCES)), INDYMAC BANCORP INC (SAVINGS INSTITUTION, FEDERALLY CHARTERED), AVERY DENNISON CORPORATION (CONVERTED PAPER & PAPERBOARD PRODS (NO CONTAINERS/BOXES)) and 1 other public companies.
Hospitals in Pasadena:
- ASSURANCE HOSPICE, INC (40 N ALTADENA DRIVE, SUITE 118)
- AURORA LAS ENCINAS HOSPITAL (2900 E DEL MAR BLVD)
- HOSPICE ANGELES (739 E WALNUT STREET SUITE 205)
- HUNTINGTON MEMORIAL HOSPITAL (Voluntary non-profit - Private, provides emergency services, 100 W CALIFORNIA BLVD)
- HUNTINGTON OUTPATIENT SURGERY CENTER (797 SOUTH FAIR OAKS AVENUE)
- VISITING NURSE ASSOC - PASADENA (2500 E COLORADO BLVD)
Nursing Homes in Pasadena:
- BRIGHTON CONVALESCENT CENTER (1836 N. FAIR OAKS)
- CAMELLIA GARDENS CARE CENTER (1920 N. FAIR OAKS AVENUE)
- GEM TRANSITIONAL (716 SOUTH FAIR OAKS AVE)
- MARLINDA IMPERIAL CONV HOSP (150 BELLEFONTAINE)
- MONTE VISTA GROVE HOMES (2889 SAN PASQUAL STREET)
- ROSE GARDEN CONVALESCENT CTR (1899 N RAYMOND AVE)
- SOPHIA-LYN CONVALESCENT HOSP (1570 N. FAIR OAKS AVENUE)
- ST. LUKE MEDICAL CENTER (2632 E. WASHINGTON BLVD.)
- THE CALIFORNIAN-PASADENA (120 BELLEFONTAINE STREET)
- VILLA GARDENS HEALTH CARE UNIT (842 EAST VILLA STREET)
- VILLA OAKS CONV HOSPITAL (1515 N.FAIR OAKS AVENUE)
Dialysis Facilities in Pasadena:
- ARROYO DIALYSIS CENTER (1111 S. ARROYO PARKWAY, SUITE 150)
- DAVITA-EATON CANYON DIALYSIS (2551 E. WASHINGTON BLVD.)
- HUNTINGTON DIALYSIS CENTER (806 S. FAIR OAKS AVENUE)
- PASADENA FOOTHILLS DIALYSIS CENTER (3722 E. COLORADO BLVD.)
Home Health Centers in Pasadena:
- A AND P HOME HEALTH, INC (2396 E FOOTHILL BLVD)
- ALSA HOME HEALTH CARE, INC (130 COOK AVENUE, SUITE 102)
- BENEVOLENT HOME CARE (426 S ROSEMEAD BLVD)
- CONCORD HOME HEALTH CARE (424 NORTH LAKE AVENUE SUITE 202)
- HOME CARE OF AMERICA (1930 E. COLORADO BLVD.)
- MOBILE NURSING CARE (1028 N LAKE AVENUE #207)
- PASADENA HOME HEALTH CARE (3821 E SIERRA MADRE BLVD)
- SMART CARE LINK, INC (2525 E COLORADO BLVD, SUITE 104)
- VALENCIA HOME CARE (1864 EAST WASHINGTON BLVD, #201)
- VIRGINIA HOME CARE AGENCY (1028 N LAKE AVE, # 102)
- VNA OF GREATER LOS ANGELES, INC (3452 E FOOTHILL BLVD, STE 130)
Heliports located in Pasadena:
See details about Heliports located in Pasadena, CAColleges/Universities in Pasadena:
- Pasadena City College (Full-time enrollment: 14,712; Location: 1570 E Colorado Blvd.; Public; Website: www.pasadena.edu)
- Le Cordon Bleu College of Culinary Arts-Pasadena (Full-time enrollment: 2,934; Location: 530 East Colorado Boulevard; Private, for-profit; Website: www.chefs.edu/los-angeles/)
- Art Center College of Design (Full-time enrollment: 2,346; Location: 1700 Lida St; Private, not-for-profit; Website: www.artcenter.edu; Offers Master's degree)
- California Institute of Technology (Full-time enrollment: 2,246; Location: 1200 E California Blvd; Private, not-for-profit; Website: www.caltech.edu; Offers Doctor's degree)
- Fuller Theological Seminary in California (Full-time enrollment: 1,873; Location: 135 N Oakland Ave; Private, not-for-profit; Website: www.fuller.edu; Offers Doctor's degree)
- Pacific Oaks College (Full-time enrollment: 971; Location: 55 Eureka Street; Private, not-for-profit; Website: www.pacificoaks.edu; Offers Master's degree)
- North-West College-Pasadena (Full-time enrollment: 328; Location: 530 E Union; Private, for-profit; Website: www.north-westcollege.edu)
- Los Angeles Music Academy (Full-time enrollment: 172; Location: 370 S Fair Oaks Ave; Private, for-profit; Website: www.lama.edu)
- Providence Christian College (Full-time enrollment: 66; Location: 1539 East Howard Street; Private, not-for-profit; Website: providencecc.net)
Other colleges/universities with over 2000 students near Pasadena:
- Occidental College (about 5 miles; Los Angeles, CA; Full-time enrollment: 2,276)
- Glendale Community College (about 6 miles; Glendale, CA; FT enrollment: 11,348)
- California State University-Los Angeles (about 7 miles; Los Angeles, CA; FT enrollment: 17,545)
- East Los Angeles College (about 9 miles; Monterey Park, CA; FT enrollment: 17,297)
- Marinello Schools of Beauty-Los Angeles (about 11 miles; Los Angeles, CA; FT enrollment: 3,923)
- Los Angeles City College (about 11 miles; Los Angeles, CA; FT enrollment: 10,027)
- Fashion Institute of Design & Merchandising-Los Angeles (about 11 miles; Los Angeles, CA; FT enrollment: 3,705)
User-submitted facts and corrections:
- Another church in Pasadena: Throop Memorial Unitarian Universalist Church, 300 S. Los Robles, Pasadena CA 91101
Points of interest:
Notable locations in Pasadena: Rose Bowl (A), Oak Grove Ranger Station (B), Eaton Substation (C), Brookside Golf Course (D), Annandale Golf Course (E), Annandale Country Club (F), Linda Vista Branch Pasadena Public Library (G), San Rafael Branch Pasadena Public Library (H), Lamanda Park Branch Pasadena Public Library (I), Rosemont Pavilion (J), Pasadena Playhouse (K), Pasadena Historical Society Museum (L), Armory Center for the Arts (M), Ambassador Auditorium (N), Santa Catalina Branch Pasedena Public Library (O), Pasadena Civic Auditorium (P), Pacific Asia Museum (Q), Norton Simon Museum of Art (R), La Pintoresca Branch Pasadena Public Library (S), Hill Avenue Branch Pasadena Public Library (T). Display/hide their locations on the map
Shopping Centers: El Nido Plaza Shopping Center (1), Hastings Village Shopping Center (2), Plaza Pasadena Shopping Center (3), North Lake Square Shopping Center (4), Hastings Ranch Shopping Center (5), Hastings Ranch Plaza Shopping Center (6). Display/hide their locations on the map
Main business address in Pasadena include: WESCO FINANCIAL CORP (A), AMERON INTERNATIONAL CORP (B), JACOBS ENGINEERING GROUP INC /DE/ (C), PAULA FINANCIAL (D), ALEXANDRIA REAL ESTATE EQUITIES INC (E), AUTOIMMUNE INC (F), INDYMAC BANCORP INC (G), AVERY DENNISON CORPORATION (H). Display/hide their locations on the map
Churches in Pasadena include: Apostolic Christian Church (A), Armenian Church of the Nazarene (B), Church of Jesus Christ of Latter Day Saints (C), First Church of the Nazarene (D), Foothills Community Church (E), Light of Love Mission Church (F), Mount Olive Lutheran Church (G), Pasadena Alliance Church (H), Pasadena Christian Church (I). Display/hide their locations on the map
Reservoirs: Sunset Reservoir (A), Devils Gate Reservoir (B), Eaton Canyon Reservoir (C). Display/hide their locations on the map
Parks in Pasadena include: Robinson Stadium (1), Central Park (2), Brookside Park (3), Besse Park (4), Grant Park (5), Hamilton Park (6), Jefferson Recreation Center (7), Lower Arroyo Park (8), Oak Grove Park (9). Display/hide their locations on the map
Tourist attractions: Culture Plaza of the Americas (Cultural Attractions- Events- & Facilities; 1217 North Chester Avenue) (1), Bahama Lanes (Amusement & Theme Parks; 3545 East Foothill Boulevard) (2), Arcade Lane-Pasadena (Amusement & Theme Parks; 696 East Colorado Boulevard Suite 208) (3), Amf Bowling Centers (Amusement & Theme Parks; 3545 East Foothill Boulevard) (4), At Your Place Repairs (Arcades & Amusements; 1110 N Mar Vista Ave) (5). Display/hide their approximate locations on the map
Hotels: Best Western Pasadena Inn (3570 East Colorado Boulevard) (1), Best Western Colorado Inn Pasa (2156 East Colorado Boulevard) (2), Astro Motel Pasadena (2818 East Colorado Boulevard) (3), Ace Motel (2870 East Colorado Boulevard) (4), Best Western Pasadena Royale (3600 East Colorado Boulevard) (5). Display/hide their approximate locations on the map
Courts: Los Angeles County - Civil Division- Sheriff- Court Services Division- Pasa (300 East Walnut Street) (1), Los Angeles County - Conciliation Court (300 East Walnut Street) (2), Courts - Federal - Appeals Court- Clerk's Office Information (125 South Grand Avenue Pasaden) (3), United States Government - Courts- Ninth Judicial Circuit Historical Soc (125 South Grand Avenue) (4), Pasadena Courthouse - General Civil (300 East Walnut Street) (5). Display/hide their approximate locations on the map
Birthplace of: Roger Ingram - Trumpeter, Steve Dahl - Shock jock, Missy Franklin - International swimmer, Stan Freberg - Author, Bill Richardson - Politician, Sophia Bush - Actor, Julia Child - Chef, Drew Pinsky - Radio and television personality, Wally Hedrick - Artist, Brodus Clay - Professional wrestler.
Drinking water stations with addresses in Pasadena and their reported violations in the past:
COUNTRY CORNERS MOBILE HOME COMMUNITY (Serves GA, Population served: 382, Purch surface water):Past monitoring violations:OTSEGO MOTEL (Address: 1100 CORDOVA STREET , Serves NY, Population served: 85, Groundwater):
- Follow-up Or Routine LCR Tap M/R - In OCT-01-2000, Contaminant: Lead and Copper Rule. Follow-up actions: St Compliance achieved (JUN-08-2001), St Intentional no-action (FEB-10-2004)
- Follow-up Or Routine LCR Tap M/R - In OCT-01-1997, Contaminant: Lead and Copper Rule. Follow-up actions: St Compliance achieved (2 times from MAY-27-1998 to JUN-26-1998), St Public Notif requested (OCT-09-1998), St Public Notif received (DEC-17-1998), St Intentional no-action (FEB-10-2004)
- Follow-up Or Routine LCR Tap M/R - In OCT-01-1995, Contaminant: Lead and Copper Rule. Follow-up actions: St Compliance achieved (JUN-11-1996), St Public Notif requested (DEC-19-1997), St Public Notif received (MAY-01-1998), St Intentional no-action (FEB-10-2004)
- 2 routine major monitoring violations
Past monitoring violations:JULIAN OAKS YOUTH MINISTRIES (Population served: 70, Groundwater):
- 2 routine major monitoring violations
Past monitoring violations:YOSEMITE RESORT PROPERTIES (Population served: 9, Groundwater):
- 3 routine major monitoring violations
- 2 regular monitoring violations
Past monitoring violations:
- Follow-up Or Routine LCR Tap M/R - In JAN-01-2006, Contaminant: Lead and Copper Rule. Follow-up actions: St AO (w/o penalty) issued (DEC-28-2005), St Compliance achieved (DEC-28-2005)
| This city: | 2.4 people |
| California: | 2.9 people |
| This city: | 55.9% |
| Whole state: | 68.7% |
| This city: | 6.7% |
| Whole state: | 7.2% |
Likely homosexual households (counted as self-reported same-sex unmarried-partner households)
- Lesbian couples: 0.5% of all households
- Gay men: 0.7% of all households
People in group quarters in Pasadena in 2010:
- 991 people in college/university student housing
- 890 people in nursing facilities/skilled-nursing facilities
- 598 people in group homes intended for adults
- 431 people in residential treatment centers for adults
- 298 people in other noninstitutional facilities
- 141 people in emergency and transitional shelters (with sleeping facilities) for people experiencing homelessness
- 56 people in residential treatment centers for juveniles (non-correctional)
- 32 people in correctional facilities intended for juveniles
- 22 people in in-patient hospice facilities
- 21 people in group homes for juveniles (non-correctional)
- 13 people in workers' group living quarters and job corps centers
People in group quarters in Pasadena in 2000:
- 1,236 people in nursing homes
- 548 people in college dormitories (includes college quarters off campus)
- 415 people in homes or halfway houses for drug/alcohol abuse
- 319 people in other noninstitutional group quarters
- 267 people in other nonhousehold living situations
- 264 people in homes for the mentally retarded
- 215 people in homes for the mentally ill
- 113 people in other group homes
- 36 people in religious group quarters
- 29 people in hospitals/wards and hospices for chronically ill
- 29 people in other hospitals or wards for chronically ill
- 29 people in hospitals or wards for drug/alcohol abuse
- 23 people in other types of correctional institutions
- 8 people in homes for the physically handicapped
- 6 people in mental (psychiatric) hospitals or wards
- 6 people in schools, hospitals, or wards for the intellectually disabled
- 4 people in unknown juvenile institutions
Banks with most branches in Pasadena (2011 data):
- Wells Fargo Bank, National Association: 7 branches. Info updated 2011/04/05: Bank assets: $1,161,490.0 mil, Deposits: $905,653.0 mil, headquarters in Sioux Falls, SD, positive income, 6395 total offices, Holding Company: Wells Fargo & Company
- Bank of America, National Association: Pasadena Main Branch, California And Pasadena Branch, Colorado-Bonnie Branch, Foothill And Rosemead Branch, Lake And Colorado Branch, Pasadena Branch. Info updated 2009/11/18: Bank assets: $1,451,969.3 mil, Deposits: $1,077,176.8 mil, headquarters in Charlotte, NC, positive income, 5782 total offices, Holding Company: Bank Of America Corporation
- JPMorgan Chase Bank, National Association: East Foothill Branch, Pasadena Branch, Pasadena East Branch, Colorado & Arroyo Parkway Banking Ce, 1845 East Washington Branch. Info updated 2011/11/10: Bank assets: $1,811,678.0 mil, Deposits: $1,190,738.0 mil, headquarters in Columbus, OH, positive income, International Specialization, 5577 total offices, Holding Company: Jpmorgan Chase & Co.
- Citibank, National Association: 161 W California Blvd Branch, 285 South Lake Avenue Branch, East Colorado Boulevard Branch, 3677 East Foothill Blvd Branch. Info updated 2012/01/10: Bank assets: $1,288,658.0 mil, Deposits: $882,541.0 mil, headquarters in Sioux Falls, SD, positive income, International Specialization, 1048 total offices, Holding Company: Citigroup Inc.
- Bank of the West: Pasadena Main Branch, Pasadena East Branch, Cbo Pasadena Branch. Info updated 2009/11/16: Bank assets: $62,408.3 mil, Deposits: $43,995.2 mil, headquarters in San Francisco, CA, positive income, 647 total offices, Holding Company: Bnp Paribas
- OneWest Bank, FSB: Onewest Bank, Fsb, Cbg-Telebank Branch, Hastings Ranch Branch. Info updated 2011/07/21: Bank assets: $26,181.3 mil, Deposits: $15,408.4 mil, local headquarters, positive income, 79 total offices
- U.S. Bank National Association: Pasadena Branch at 720 East Colorado Boulevard, branch established on 2004/08/02; Sierra Madre Vons Branch at 2355 East Colorado Boulevard, branch established on 2011/06/30. Info updated 2012/01/30: Bank assets: $330,470.8 mil, Deposits: $236,091.5 mil, headquarters in Cincinnati, OH, positive income, 3121 total offices, Holding Company: U.S. Bancorp
- Professional Business Bank: East Pasadena Branch at 2700 East Foothill Boulevard, branch established on 2010/12/31; at 2700 East Foothill Boulevard, Suite #200, branch established on 2009/03/09. Info updated 2011/07/07: Bank assets: $239.5 mil, Deposits: $201.2 mil, local headquarters, positive income, Commercial Lending Specialization, 4 total offices, Holding Company: Scj, Inc.
- Community Bank: at 790 East Colorado Boulevard, branch established on 1983/01/11; Pasadena Main Branch at 505 East Colorado Boulevard, branch established on 1945/08/18. Info updated 2010/02/16: Bank assets: $2,601.3 mil, Deposits: $1,941.4 mil, local headquarters, positive income, Commercial Lending Specialization, 17 total offices
- 15 other banks with 16 local branches
For population 15 years and over in Pasadena:
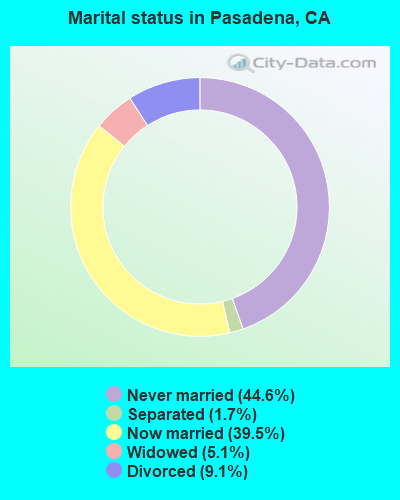
- Never married: 44.6%
- Now married: 39.5%
- Separated: 1.7%
- Widowed: 5.1%
- Divorced: 9.1%
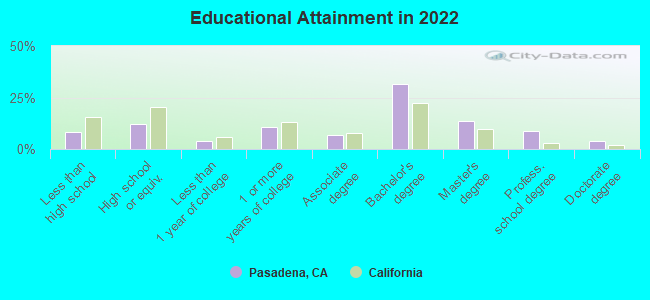
For population 25 years and over in Pasadena:
- High school or higher: 91.7%
- Bachelor's degree or higher: 58.5%
- Graduate or professional degree: 26.7%
- Unemployed: 6.7%
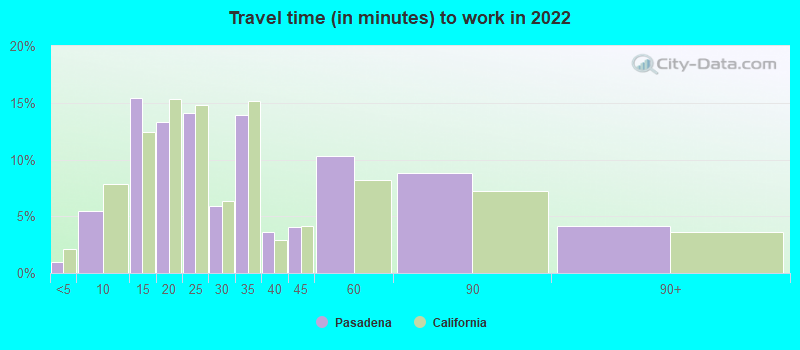
- Mean travel time to work (commute): 18.9 minutes
| Here: | 12.6 |
| California average: | 15.5 |


Graphs represent county-level data. Detailed 2008 Election Results
Religion statistics for Pasadena, CA (based on Los Angeles County data)


| Religion | Adherents | Congregations |
|---|---|---|
| Catholic | 3,542,994 | 275 |
| Evangelical Protestant | 814,611 | 3,249 |
| Other | 451,594 | 1,023 |
| Mainline Protestant | 229,056 | 860 |
| Black Protestant | 112,338 | 290 |
| Orthodox | 63,517 | 76 |
| None | 4,604,495 | - |
Food Environment Statistics:
| Los Angeles County: | 2.12 / 10,000 pop. |
| State: | 2.14 / 10,000 pop. |
| Here: | 0.03 / 10,000 pop. |
| California: | 0.04 / 10,000 pop. |
| Los Angeles County: | 0.58 / 10,000 pop. |
| California: | 0.62 / 10,000 pop. |
| This county: | 1.23 / 10,000 pop. |
| California: | 1.49 / 10,000 pop. |
| Here: | 7.15 / 10,000 pop. |
| California: | 7.42 / 10,000 pop. |
| Los Angeles County: | 7.5% |
| California: | 7.3% |
| Los Angeles County: | 20.4% |
| California: | 21.3% |
| This county: | 18.6% |
| State: | 17.9% |
Health and Nutrition:
| Pasadena: | 50.9% |
| California: | 49.4% |
| Pasadena: | 50.8% |
| State: | 48.0% |
| Pasadena: | 27.9 |
| California: | 28.1 |
| Pasadena: | 18.4% |
| State: | 20.2% |
| Pasadena: | 10.6% |
| California: | 11.2% |
| This city: | 6.8 |
| California: | 6.8 |
| Pasadena: | 31.6% |
| California: | 31.5% |
| Pasadena: | 58.4% |
| California: | 56.4% |
| Pasadena: | 82.0% |
| California: | 80.9% |
More about Health and Nutrition of Pasadena, CA Residents
| Local government employment and payroll (March 2022) | |||||
| Function | Full-time employees | Monthly full-time payroll | Average yearly full-time wage | Part-time employees | Monthly part-time payroll |
|---|---|---|---|---|---|
| Electric Power | 251 | $2,949,424 | $141,008 | 4 | $31,828 |
| Police Protection - Officers | 220 | $2,821,691 | $153,910 | 0 | $0 |
| Firefighters | 149 | $2,163,289 | $174,225 | 0 | $0 |
| Other Government Administration | 135 | $1,192,138 | $105,968 | 14 | $21,308 |
| Other and Unallocable | 116 | $1,071,165 | $110,810 | 43 | $79,152 |
| Solid Waste Management | 112 | $773,539 | $82,879 | 0 | $0 |
| Parks and Recreation | 110 | $761,692 | $83,094 | 91 | $91,729 |
| Police - Other | 108 | $1,057,545 | $117,505 | 25 | $48,438 |
| Health | 105 | $708,042 | $80,919 | 8 | $24,156 |
| Financial Administration | 94 | $990,412 | $126,436 | 7 | $24,058 |
| Streets and Highways | 86 | $850,193 | $118,632 | 5 | $18,693 |
| Water Supply | 77 | $759,234 | $118,322 | 0 | $0 |
| Local Libraries | 55 | $415,542 | $90,664 | 47 | $80,195 |
| Judicial and Legal | 32 | $415,602 | $155,851 | 1 | $3,693 |
| Fire - Other | 21 | $213,851 | $122,201 | 2 | $3,625 |
| Housing and Community Development (Local) | 18 | $178,932 | $119,288 | 8 | $23,403 |
| Totals for Government | 1,689 | $17,322,291 | $123,071 | 255 | $450,277 |
Pasadena government finances - Expenditure in 2021 (per resident):
- Construction - General - Other: $24,305,000 ($181.10)
Regular Highways: $5,135,000 ($38.26)
Parks and Recreation: $4,835,000 ($36.03)
Local Fire Protection: $1,217,000 ($9.07)
Libraries: $1,028,000 ($7.66)
Housing and Community Development: $634,000 ($4.72)
Correctional Institutions: $570,000 ($4.25)
General Public Buildings: $359,000 ($2.67)
Police Protection: $261,000 ($1.94)
Central Staff Services: $187,000 ($1.39)
Health - Other: $185,000 ($1.38)
- Current Operations - Electric Utilities: $131,074,000 ($976.63)
Central Staff Services: $77,534,000 ($577.70)
General - Other: $77,463,000 ($577.17)
Police Protection: $69,541,000 ($518.15)
Water Utilities: $49,118,000 ($365.98)
Local Fire Protection: $44,163,000 ($329.06)
Housing and Community Development: $33,989,000 ($253.25)
Parks and Recreation: $29,531,000 ($220.03)
Parking Facilities: $24,536,000 ($182.82)
Transit Utilities: $20,591,000 ($153.42)
Health - Other: $19,510,000 ($145.37)
Solid Waste Management: $19,376,000 ($144.37)
Libraries: $13,045,000 ($97.20)
Financial Administration: $10,840,000 ($80.77)
Regular Highways: $10,114,000 ($75.36)
Judicial and Legal Services: $7,069,000 ($52.67)
Sewerage: $4,607,000 ($34.33)
Protective Inspection and Regulation - Other: $4,390,000 ($32.71)
- Electric Utilities - Interest on Debt: $8,293,000 ($61.79)
- General - Interest on Debt: $25,076,000 ($186.84)
- Other Capital Outlay - Protective Inspection and Regulation - Other: $933,000 ($6.95)
General - Other: $571,000 ($4.25)
Police Protection: $552,000 ($4.11)
Regular Highways: $428,000 ($3.19)
Local Fire Protection: $220,000 ($1.64)
Transit Utilities: $51,000 ($0.38)
- Water Utilities - Interest on Debt: $2,719,000 ($20.26)
Pasadena government finances - Revenue in 2021 (per resident):
- Charges - Other: $53,137,000 ($395.92)
Parking Facilities: $17,274,000 ($128.71)
Solid Waste Management: $17,225,000 ($128.34)
Sewerage: $7,321,000 ($54.55)
Regular Highways: $938,000 ($6.99)
Parks and Recreation: $353,000 ($2.63)
- Federal Intergovernmental - Other: $31,472,000 ($234.50)
Housing and Community Development: $1,206,000 ($8.99)
Water Utilities: $56,000 ($0.42)
- Local Intergovernmental - Other: $5,798,000 ($43.20)
- Miscellaneous - General Revenue - Other: $16,168,000 ($120.47)
Special Assessments: $4,634,000 ($34.53)
Interest Earnings: $4,067,000 ($30.30)
Fines and Forfeits: $3,491,000 ($26.01)
Rents: $3,252,000 ($24.23)
Donations From Private Sources: $1,266,000 ($9.43)
Sale of Property: $23,000 ($0.17)
- Revenue - Electric Utilities: $220,167,000 ($1640.45)
Water Utilities: $67,825,000 ($505.36)
Transit Utilities: $486,000 ($3.62)
- State Intergovernmental - Other: $13,878,000 ($103.40)
Highways: $5,894,000 ($43.92)
Electric Utilities: $2,252,000 ($16.78)
General Local Government Support: $285,000 ($2.12)
Water Utilities: $163,000 ($1.21)
- Tax - Property: $94,341,000 ($702.93)
General Sales and Gross Receipts: $48,080,000 ($358.24)
Other: $35,481,000 ($264.37)
Public Utilities Sales: $29,751,000 ($221.67)
Other License: $14,888,000 ($110.93)
Occupation and Business License - Other: $6,351,000 ($47.32)
Other Selective Sales: $6,308,000 ($47.00)
Documentary and Stock Transfer: $1,339,000 ($9.98)
Pasadena government finances - Debt in 2021 (per resident):
- Long Term Debt - Beginning Outstanding - Unspecified Public Purpose: $789,261,000 ($5880.75)
Outstanding Unspecified Public Purpose: $759,397,000 ($5658.23)
Retired Unspecified Public Purpose: $61,476,000 ($458.05)
Issue, Unspecified Public Purpose: $31,612,000 ($235.54)
Pasadena government finances - Cash and Securities in 2021 (per resident):
- Bond Funds - Cash and Securities: $36,351,000 ($270.85)
- Other Funds - Cash and Securities: $236,677,000 ($1763.47)
- Sinking Funds - Cash and Securities: $25,995,000 ($193.69)
2.98% of this county's 2021 resident taxpayers lived in other counties in 2020 ($81,235 average adjusted gross income)
| Here: | 2.98% |
| California average: | 5.19% |
0.01% of residents moved from foreign countries ($155 average AGI)
Los Angeles County: 0.01% California average: 0.03%
Top counties from which taxpayers relocated into this county between 2020 and 2021:
| from Orange County, CA | |
| from San Bernardino County, CA | |
| from Riverside County, CA |
4.68% of this county's 2020 resident taxpayers moved to other counties in 2021 ($97,324 average adjusted gross income)
| Here: | 4.68% |
| California average: | 6.14% |
0.01% of residents moved to foreign countries ($196 average AGI)
Los Angeles County: 0.01% California average: 0.02%
Top counties to which taxpayers relocated from this county between 2020 and 2021:
| to Orange County, CA | |
| to San Bernardino County, CA | |
| to Riverside County, CA |
| Businesses in Pasadena, CA | ||||
| Name | Count | Name | Count | |
|---|---|---|---|---|
| 24 Hour Fitness | 2 | Jones New York | 4 | |
| 7-Eleven | 4 | Juicy Couture | 1 | |
| 99 Cents Only Stores | 1 | Just Tires | 1 | |
| AT&T | 2 | KFC | 3 | |
| Abercrombie & Fitch | 1 | Kincaid | 1 | |
| Aerosoles | 1 | Kroger | 4 | |
| Albertsons | 1 | LA Fitness | 2 | |
| Ann Taylor | 2 | La-Z-Boy | 1 | |
| Apple Store | 1 | Lane Furniture | 1 | |
| Audi | 1 | LensCrafters | 1 | |
| AutoZone | 1 | Macy's | 2 | |
| Avenue | 1 | Marriott | 1 | |
| Baja Fresh Mexican Grill | 1 | Marshalls | 1 | |
| Bally Total Fitness | 1 | McDonald's | 3 | |
| Banana Republic | 1 | Men's Wearhouse | 1 | |
| Barnes & Noble | 1 | Motherhood Maternity | 3 | |
| Baskin-Robbins | 3 | New Balance | 3 | |
| Bath & Body Works | 1 | Nike | 8 | |
| Bed Bath & Beyond | 1 | Nordstrom | 1 | |
| Bentleymotors.Com | 1 | Office Depot | 1 | |
| Best Western | 2 | OfficeMax | 1 | |
| Big O Tires | 1 | Old Navy | 1 | |
| Blockbuster | 2 | Panda Express | 2 | |
| Brookstone | 1 | Panera Bread | 1 | |
| Budget Car Rental | 1 | Papa John's Pizza | 1 | |
| Burger King | 3 | Payless | 2 | |
| CVS | 5 | Penske | 1 | |
| Cache | 1 | PetSmart | 1 | |
| Carl\s Jr. | 3 | Pier 1 Imports | 1 | |
| Casual Male XL | 1 | Pizza Hut | 3 | |
| Catherines | 1 | Popeyes | 1 | |
| Chico's | 1 | Pottery Barn | 1 | |
| Chipotle | 2 | Pottery Barn Kids | 1 | |
| Chuck E. Cheese's | 1 | Quality | 1 | |
| Church's Chicken | 1 | Quiznos | 2 | |
| Circle K | 1 | RadioShack | 2 | |
| Cold Stone Creamery | 2 | Ramada | 1 | |
| Comfort Inn | 1 | Rite Aid | 3 | |
| Crate & Barrel | 1 | Rodeway Inn | 1 | |
| Curves | 4 | SAS Shoes | 1 | |
| DHL | 2 | Safeway | 5 | |
| Days Inn | 1 | Sears | 3 | |
| Dennys | 1 | Sephora | 1 | |
| Discount Tire | 1 | Sheraton | 1 | |
| Domino's Pizza | 3 | Sprint Nextel | 2 | |
| El Pollo Loco | 2 | Staples | 2 | |
| Ethan Allen | 1 | Starbucks | 18 | |
| Famous Footwear | 1 | Subway | 12 | |
| FedEx | 38 | Super 8 | 1 | |
| Firestone Complete Auto Care | 1 | Taco Bell | 3 | |
| Foot Locker | 1 | Talbots | 1 | |
| Forever 21 | 1 | Target | 2 | |
| GNC | 3 | The Cheesecake Factory | 1 | |
| GameStop | 2 | Toyota | 1 | |
| Gap | 1 | Trader Joe's | 3 | |
| Gymboree | 1 | Travelodge | 1 | |
| H&R Block | 6 | True Value | 1 | |
| Hilton | 2 | U-Haul | 4 | |
| Holiday Inn | 1 | UPS | 29 | |
| Honda | 1 | Urban Outfitters | 1 | |
| Howard Johnson | 1 | Vans | 1 | |
| IHOP | 1 | Verizon Wireless | 1 | |
| J. Jill | 1 | Volkswagen | 1 | |
| J.Crew | 1 | Vons | 5 | |
| Jack In The Box | 2 | Walgreens | 3 | |
| Jamba Juice | 3 | Westin | 1 | |
| JoS. A. Bank | 1 | Whole Foods Market | 2 | |
| Johnny Rockets | 2 | YMCA | 1 | |
Strongest AM radio stations in Pasadena:
- KLAC (570 AM; 50 kW; LOS ANGELES, CA; Owner: AMFM RADIO LICENSES, L.L.C.)
- KFWB (980 AM; 50 kW; LOS ANGELES, CA; Owner: INFINITY BROADCASTING OPERATIONS, INC.)
- KMPC (1540 AM; 50 kW; LOS ANGELES, CA; Owner: ROSE CITY RADIO CORPORATION)
- KRLA (870 AM; 20 kW; GLENDALE, CA; Owner: NEW INSPIRATION BROADCASTING COMPANY)
- KDIS (1110 AM; 50 kW; PASADENA, CA; Owner: ABC,INC.)
- KXMX (1190 AM; 25 kW; ANAHEIM, CA; Owner: NEW INSPIRATION BROADCASTING COMPANY)
- KBLA (1580 AM; 50 kW; SANTA MONICA, CA)
- KAZN (1300 AM; 5 kW; PASADENA, CA; Owner: MULTICULTURAL RADIO BROADCASTING, INC.)
- KTNQ (1020 AM; 50 kW; LOS ANGELES, CA; Owner: KTNQ-AM LICENSE CORP.)
- KXTA (1150 AM; 50 kW; LOS ANGELES, CA; Owner: CITICASTERS LICENSES, L.P.)
- KSPN (710 AM; 50 kW; LOS ANGELES, CA; Owner: KABC-AM RADIO, INC.)
- KMRB (1430 AM; 5 kW; SAN GABRIEL, CA; Owner: POLYETHNIC BROADCASTING, INC.)
- KFI (640 AM; 50 kW; LOS ANGELES, CA; Owner: CAPSTAR TX LIMITED PARTNERSHIP)
Strongest FM radio stations in Pasadena:
- KZLA-FM (93.9 FM; LOS ANGELES, CA; Owner: EMMIS RADIO LICENSE CORPORATION)
- KPWR (105.9 FM; LOS ANGELES, CA; Owner: EMMIS RADIO LICENSE CORPORATION)
- KLSX (97.1 FM; LOS ANGELES, CA; Owner: INFINITY BROADCASTING OPERATIONS, INC.)
- KUSC (91.5 FM; LOS ANGELES, CA; Owner: UNIVERSITY OF SOUTHERN CALIFORNIA)
- KKLA-FM (99.5 FM; LOS ANGELES, CA; Owner: NEW INSPIRATION BROADCASTING CO., INC.)
- KCBS-FM (93.1 FM; LOS ANGELES, CA; Owner: INFINITY BROADCASTING OPERATIONS, INC.)
- KSCA (101.9 FM; GLENDALE, CA; Owner: HBC LICENSE CORPORATION)
- K212FA (90.3 FM; TEMPLE CITY, CA; Owner: EDUCATIONAL MEDIA FOUNDATION)
- KLOS (95.5 FM; LOS ANGELES, CA; Owner: KLOS-FM RADIO, INC.)
- KOST (103.5 FM; LOS ANGELES, CA; Owner: CAPSTAR TX LIMITED PARTNERSHIP)
- KIIS-FM (102.7 FM; LOS ANGELES, CA; Owner: CITICASTERS LICENSES, L.P.)
- KLVE (107.5 FM; LOS ANGELES, CA; Owner: KLVE-FM LICENSE CORP.)
- KPCC (89.3 FM; PASADENA, CA; Owner: PASADENA AREA COMMUNITY COLLEGE DISTRICT)
- KBIG-FM (104.3 FM; LOS ANGELES, CA; Owner: AMFM RADIO LICENSES, L.L.C.)
- KHHT (92.3 FM; LOS ANGELES, CA; Owner: AMFM RADIO LICENSES, L.L.C.)
- KMZT-FM (105.1 FM; LOS ANGELES, CA; Owner: MOUNT WILSON FM BROADCASTERS, INC.)
- KTWV (94.7 FM; LOS ANGELES, CA; Owner: INFINITY BROADCASTING OPERATIONS, INC.)
- KPFK (90.7 FM; LOS ANGELES, CA; Owner: PACIFICA FOUNDATION, INC)
- K216EM (91.1 FM; ARCADIA, CA; Owner: LIFE ON THE WAY COMMUNICATIONS, INC.)
- KRTH-FM (101.1 FM; LOS ANGELES, CA; Owner: INFINITY BROADCASTING OPERATIONS, INC.)
TV broadcast stations around Pasadena:
- KCBS-TV (Channel 2; LOS ANGELES, CA; Owner: CBS BROADCASTING INC.)
- KTLA-TV (Channel 5; LOS ANGELES, CA; Owner: KTLA INC.)
- KABC-TV (Channel 7; LOS ANGELES, CA; Owner: ABC HOLDING COMPANY, INC.)
- KNBC (Channel 4; LOS ANGELES, CA; Owner: NBC SUBSIDIARY (KNBC-TV), INC.)
- KCAL-TV (Channel 9; LOS ANGELES, CA; Owner: VIACOM TELEVISION STATIONS GROUP OF LOS ANGELES LLC)
- KMEX-TV (Channel 34; LOS ANGELES, CA; Owner: KMEX LICENSE PARTNERSHIP, G.P.)
- KSCI (Channel 18; LONG BEACH, CA; Owner: KSLS, INC.)
- KAZA-TV (Channel 54; AVALON, CA; Owner: PAPPAS SOUTHERN CALIFORNIA LICENSE LLC)
- KDOC-TV (Channel 56; ANAHEIM, CA; Owner: GOLDEN ORANGE BROADCASTING CO., INC.)
- KOCE-TV (Channel 50; HUNTINGTON BEACH, CA; Owner: BD. OF TRUSTEES, COAST COMMUNITY COLLEGE DIST.)
- KXLA (Channel 44; RANCHO PALOS VERDES, CA; Owner: RANCHO PALOS VERDES BROADCASTERS, INC.)
- KTRO-LP (Channel 50; LANCASTER, CA; Owner: ROBERT D. ADELMAN)
- KCET (Channel 28; LOS ANGELES, CA; Owner: COMMUNITY TELEVISION OF SOUTHERN CALIFORNIA)
- KFTR (Channel 46; ONTARIO, CA; Owner: TELEFUTURA LOS ANGELES LLC)
- KTTV (Channel 11; LOS ANGELES, CA; Owner: FOX TELEVISION STATIONS, INC.)
- KWHY-TV (Channel 22; LOS ANGELES, CA; Owner: TELEMUNDO OF LOS ANGELES LICENSE CORPORATION)
- KVEA (Channel 52; CORONA, CA; Owner: ESTRELLA LICENSE CORPORATION)
- KCOP-TV (Channel 13; LOS ANGELES, CA; Owner: FOX TELEVISION STATIONS, INC.)
- KSFV-LP (Channel 26; SAN FERNANDO VALLEY, CA; Owner: VENTURE TECHNOLOGIES GROUP, LLC)
- KTBN-TV (Channel 40; SANTA ANA, CA; Owner: TRINITY BROADCASTING NETWORK, INC.)
- KLCS (Channel 58; LOS ANGELES, CA; Owner: LOS ANGELES UNIFIED SCHOOL DISTRICT)
- KHTV-LP (Channel 48; INLAND EMPIRE, CA; Owner: VENTURE TECHNOLOGIES GROUP, LLC)
- KHIZ (Channel 64; BARSTOW, CA; Owner: SUNBELT TELEVISION, INC.)
- KLAU-LP (Channel 66; REDLANDS, CA; Owner: GERALD BENAVIDES)
- KNET-LP (Channel 38; LOS ANGELES, CA; Owner: VENTURE TECHNOLOGIES GROUP, LLC)
- National Bridge Inventory (NBI) Statistics
- 232Number of bridges
- 3,068ft / 935mTotal length
- $10,758,000Total costs
- 13,865,314Total average daily traffic
- 685,839Total average daily truck traffic
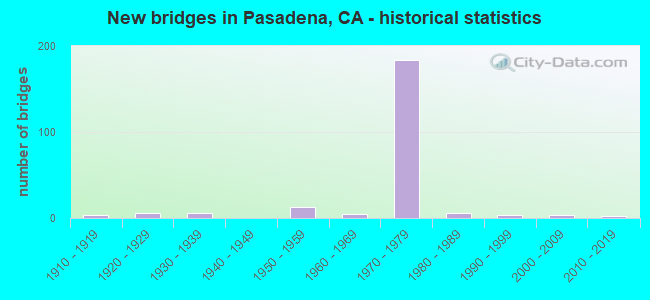
- New bridges - historical statistics
- 31910-1919
- 61920-1929
- 61930-1939
- 131950-1959
- 51960-1969
- 1841970-1979
- 61980-1989
- 41990-1999
- 32000-2009
- 22010-2019
FCC Registered Commercial Land Mobile Towers: 5 (See the full list of FCC Registered Commercial Land Mobile Towers in Pasadena, CA)
FCC Registered Private Land Mobile Towers: 7 (See the full list of FCC Registered Private Land Mobile Towers)
FCC Registered Broadcast Land Mobile Towers: 155 (See the full list of FCC Registered Broadcast Land Mobile Towers)
FCC Registered Microwave Towers: 152 (See the full list of FCC Registered Microwave Towers in this town)
FCC Registered Paging Towers: 10 (See the full list of FCC Registered Paging Towers)
FCC Registered Maritime Coast & Aviation Ground Towers: 1 (See the full list of FCC Registered Maritime Coast & Aviation Ground Towers)
FCC Registered Amateur Radio Licenses: 1,212 (See the full list of FCC Registered Amateur Radio Licenses in Pasadena)
FAA Registered Aircraft Manufacturers and Dealers: 2 (See the full list of FAA Registered Manufacturers and Dealers in Pasadena)
FAA Registered Aircraft: 96 (See the full list of FAA Registered Aircraft)
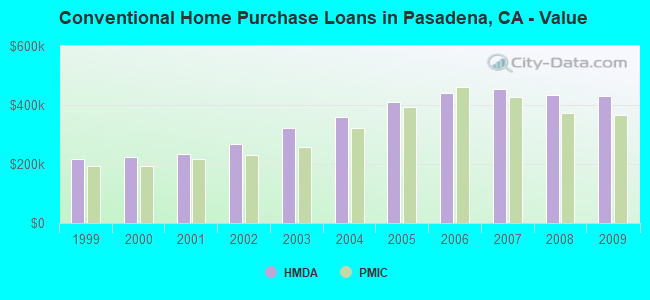
| Home Mortgage Disclosure Act Aggregated Statistics For Year 2009 (Based on 26 full and 3 partial tracts) | ||||||||||||||
| A) FHA, FSA/RHS & VA Home Purchase Loans | B) Conventional Home Purchase Loans | C) Refinancings | D) Home Improvement Loans | E) Loans on Dwellings For 5+ Families | F) Non-occupant Loans on < 5 Family Dwellings (A B C & D) | G) Loans On Manufactured Home Dwelling (A B C & D) | ||||||||
|---|---|---|---|---|---|---|---|---|---|---|---|---|---|---|
| Number | Average Value | Number | Average Value | Number | Average Value | Number | Average Value | Number | Average Value | Number | Average Value | Number | Average Value | |
| LOANS ORIGINATED | 209 | $398,007 | 872 | $430,109 | 2,795 | $368,307 | 126 | $319,207 | 18 | $1,771,321 | 261 | $308,876 | 2 | $381,500 |
| APPLICATIONS APPROVED, NOT ACCEPTED | 33 | $372,523 | 130 | $427,898 | 309 | $397,848 | 19 | $247,167 | 2 | $643,000 | 30 | $333,436 | 0 | $0 |
| APPLICATIONS DENIED | 67 | $381,128 | 197 | $405,818 | 855 | $411,291 | 57 | $166,018 | 5 | $1,168,912 | 134 | $344,507 | 0 | $0 |
| APPLICATIONS WITHDRAWN | 58 | $382,709 | 190 | $397,803 | 570 | $396,143 | 40 | $264,306 | 4 | $1,138,000 | 71 | $383,116 | 0 | $0 |
| FILES CLOSED FOR INCOMPLETENESS | 10 | $340,916 | 40 | $420,938 | 159 | $397,073 | 9 | $175,764 | 2 | $487,500 | 12 | $380,334 | 0 | $0 |
Detailed mortgage data for all 29 tracts in Pasadena, CA
| Private Mortgage Insurance Companies Aggregated Statistics For Year 2009 (Based on 24 full and 3 partial tracts) | ||||
| A) Conventional Home Purchase Loans | B) Refinancings | |||
|---|---|---|---|---|
| Number | Average Value | Number | Average Value | |
| LOANS ORIGINATED | 68 | $364,861 | 8 | $367,430 |
| APPLICATIONS APPROVED, NOT ACCEPTED | 37 | $403,454 | 7 | $447,990 |
| APPLICATIONS DENIED | 13 | $423,049 | 9 | $418,084 |
| APPLICATIONS WITHDRAWN | 5 | $367,600 | 1 | $417,000 |
| FILES CLOSED FOR INCOMPLETENESS | 2 | $599,825 | 0 | $0 |
2005 - 2018 National Fire Incident Reporting System (NFIRS) incidents
- Fire incident types reported to NFIRS in Pasadena, CA
- 1,89248.2%Structure Fires
- 95324.3%Outside Fires
- 87922.4%Mobile Property/Vehicle Fires
- 2055.2%Other
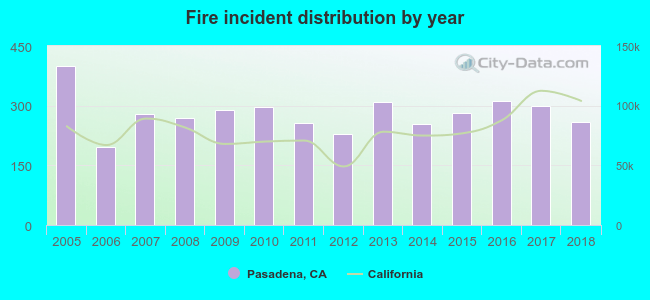 According to the data from the years 2005 - 2018 the average number of fire incidents per year is 281. The highest number of fires - 400 took place in 2005, and the least - 197 in 2006. The data has a declining trend.
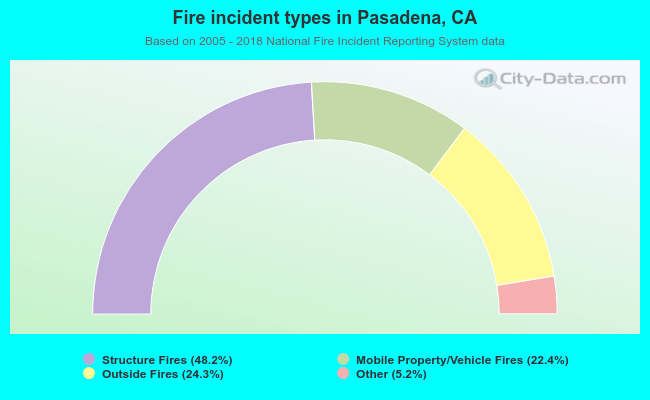 When looking into fire subcategories, the most incidents belonged to: Structure Fires (48.2%), and Outside Fires (24.3%).
Fire-safe hotels and motels in Pasadena, California:
- Pasadena Hilton, 168 S Los Robles Ave, Pasadena, California 91101 , Phone: (626) 577-1000, Fax: (626) 584-3132
- Best Western Pasadena Inn, 3570 E Colorado Blvd, Pasadena, California 91107 , Phone: (818) 796-9100, Fax: (626) 405-9948
- The Langham Huntington, Pasadena, 1401 S Oak Knl, Pasadena, California 91106 , Phone: (626) 568-3900, Fax: (626) 584-7864
- Ramada Inn Of Pasadena, 2156 E Colorado Blvd, Pasadena, California 91107 , Phone: (626) 793-9339, Fax: (626) 793-9449
- Econo Lodge, 2860 E Colorado Blvd, Pasadena, California 91107 , Phone: (626) 792-3700
- Holiday Inn Express Hotel And Suites, Pasadena, 3500 E Colorado Blvd, Pasadena, California 91107 , Phone: (626) 792-1363, Fax: (626) 792-9213
- Americas Best Value Inn, 3800 E Colorado Blvd, Pasadena, California 91107 , Phone: (626) 449-4743, Fax: (626) 449-5008
- Howard Johnson Inn, 1599 E Colorado Blvd, Pasadena, California 91106 , Phone: (626) 304-9678, Fax: (626) 449-3493
- 4 other hotels and motels
| Most common first names in Pasadena, CA among deceased individuals | ||
| Name | Count | Lived (average) |
|---|---|---|
| John | 1,033 | 76.2 years |
| Mary | 1,029 | 82.0 years |
| William | 832 | 77.3 years |
| Robert | 740 | 73.2 years |
| James | 658 | 74.2 years |
| George | 603 | 77.8 years |
| Helen | 555 | 82.0 years |
| Charles | 517 | 76.2 years |
| Margaret | 491 | 81.6 years |
| Ruth | 432 | 81.6 years |
| Most common last names in Pasadena, CA among deceased individuals | ||
| Last name | Count | Lived (average) |
|---|---|---|
| Smith | 386 | 78.7 years |
| Johnson | 360 | 76.7 years |
| Williams | 282 | 74.9 years |
| Jones | 240 | 76.7 years |
| Brown | 238 | 76.7 years |
| Miller | 223 | 79.9 years |
| Anderson | 194 | 78.9 years |
| Davis | 165 | 77.8 years |
| Wilson | 158 | 77.7 years |
| Clark | 139 | 78.9 years |
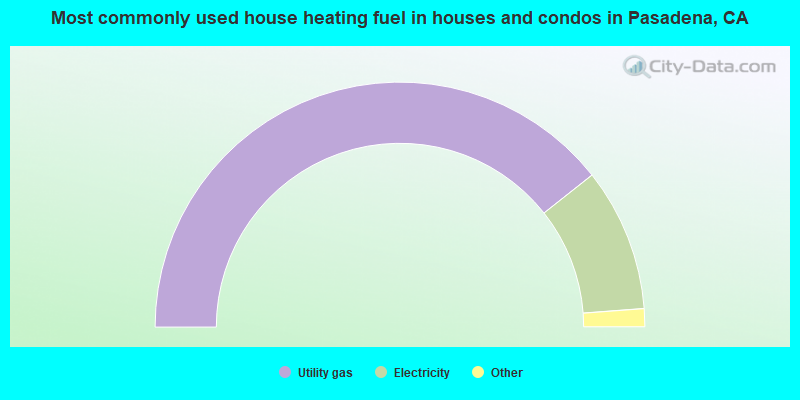
- 78.7%Utility gas
- 18.9%Electricity
- 1.1%Bottled, tank, or LP gas
- 0.5%Solar energy
- 0.4%No fuel used
- 0.2%Wood
- 0.1%Other fuel
- 61.6%Utility gas
- 34.0%Electricity
- 3.2%No fuel used
- 1.1%Bottled, tank, or LP gas
- 0.2%Other fuel
Pasadena compared to California state average:
- Median house value above state average.
- Unemployed percentage below state average.
- Black race population percentage above state average.
- Median age above state average.
- House age above state average.
- Percentage of population with a bachelor's degree or higher significantly above state average.
Pasadena, CA compared to other similar cities:
Pasadena on our top lists:
- #13 on the list of "Top 101 cities with largest percentage of males in occupations: arts, design, entertainment, sports, and media occupations (population 50,000+)"
- #24 on the list of "Top 101 cities with the most residents born in Armenia (population 500+)"
- #25 on the list of "Top 101 larger cities with the highest increase in house/condo value from 2000 (population 50,000+)"
- #28 on the list of "Top 101 cities with largest percentage of males in occupations: life, physical, and social science occupations (population 50,000+)"
- #29 on the list of "Top 101 cities with largest percentage of males in industries: information (population 50,000+)"
- #30 on the list of "Top 101 cities with the largest percentage of likely gay men couples (counted as self-reported male-male unmarried-partner households) (population 50,000+)"
- #31 on the list of "Top 101 cities with largest percentage of females in industries: other services, except public administration (population 50,000+)"
- #31 on the list of "Top 101 cities with the smallest sunshine amount differences during a year (population 50,000+)"
- #32 on the list of "Top 101 cities with largest percentage of females in occupations: architecture and engineering occupations (population 50,000+)"
- #32 on the list of "Top 101 cities with largest percentage of females in occupations: arts, design, entertainment, sports, and media occupations (population 50,000+)"
- #32 on the list of "Top 100 cities with highest ratio of median house value to median household income (pop. 50,000+)"
- #34 on the list of "Top 101 larger cities with the highest increase in household income from 2000 (population 50,000+)"
- #35 on the list of "Top 101 cities with the most local government spending on current operations of parking facilities per resident (population 10,000+)"
- #42 on the list of "Top 101 cities with the largest percentage of likely homosexual households (counted as self-reported same-sex unmarried-partner households) (population 50,000+)"
- #46 on the list of "Top 100 most racially diverse cities (pop. 50,000+)"
- #47 on the list of "Top 101 cities with the largest household incomes disparities (population 50,000+)"
- #49 on the list of "Top 101 cities with the largest percentage of elementary and middle school students in private schools (5,000+ students)"
- #54 on the list of "Top 101 cities with the most local government spending on current operations of libraries per resident (population 10,000+)"
- #55 on the list of "Top 100 cities with highest median house value (pop. 50,000+)"
- #58 on the list of "Top 101 cities with the most people having Doctorate degrees (population 50,000+)"
- #19 (91108) on the list of "Top 101 zip codes with the largest percentage of taxpayers reporting taxable interest in 2012 (pop 5,000+)"
- #51 (91101) on the list of "Top 101 zip codes with the most finance and insurance companies in 2005"
- #54 (91101) on the list of "Top 101 zip codes with the most offices of lawyers in 2005"
- #61 (91108) on the list of "Top 101 zip codes with the largest percentage of taxpayers reporting net capital gain/loss in 2012 (pop 5,000+)"
- #82 (91108) on the list of "Top 101 zip codes with the highest 2012 average reported profit/loss from business (pop 5,000+)"
- #87 (91101) on the list of "Top 101 zip codes with the most museums in 2005"
- #1 on the list of "Top 101 counties with the most Evangelical Protestant congregations"
- #1 on the list of "Top 101 counties with the most Mainline Protestant congregations"
- #1 on the list of "Top 101 counties with the most Orthodox adherents"
- #1 on the list of "Top 101 counties with the highest ground withdrawal of fresh water for public supply (pop. 50,000+)"
- #1 on the list of "Top 101 counties with the most Catholic adherents (pop. 50,000+)"

|
|
Total of 4936 patent applications in 2008-2024.