Long Beach and Pasadena, two cities located in sunny Southern California, offer unique benefits for both residents and tourists. From their respective crime rates and costs of living to various nuances like culture and local geographical conditions, every aspect contributes to the overall experience of living or visiting there. This evaluation seeks to provide an in-depth comparison between Long Beach and Pasadena under key areas.
Distance between
Long Beach, CA and
Pasadena, CA : 24.4 miles
Long Beach's population is larger by 236%. Its population has decreased by 5,460 people (1.2%) since 2000. The population of Pasadena has grown by 1,796 people (1.3%) during that time.
Pasadena is generally safer than Long Beach. Crime rate in Pasadena is significantly lower than in Long Beach, making it a safer choice for both those looking to relocate and tourists. Property crimes, such as burglary and motor vehicle theft, are common in both cities. However, Long Beach reports a higher number of violent crimes per capita than Pasadena. Hence, in terms of safety, Pasadena tends to offer a safer environment.
City-data.com crime index counts serious crimes and violent crime more heavily. It adjusts for the number of visitors and daily workers commuting into cities. (higher means more crime, U.S. average = 301.1)
City-data.com crime index counts serious crimes and violent crime more heavily. It adjusts for the number of visitors and daily workers commuting into cities. (higher means more crime, U.S. average = 301.1)
Sex Offenders
According to our data, there are 807 registered sex offenders living in Long Beach and 104 registered sex offenders living in . The ratio of residents to sex offenders in Long Beach is 583 to 1; the ratio in Pasadena is 1,366 to 1. The number of registered sex offenders compared to the number of residents is larger in Long Beach than in Pasadena.
Cost of Living
The cost of living in Pasadena is noticeably higher than in Long Beach. This can be attributed to Pasadena's higher housing costs and utility prices. Pasadena also boasts a more affluent community which can influence higher prices in local amenities such as restaurants, groceries and entertainment. Despite this, personal income in Pasadena is significantly higher in comparison to Long Beach.
Income Tax
Both Pasadena and Long Beach abide by California state income tax rates, which range from 1% to 13.3% depending on the income tier. As city-specific income taxes do not exist in California, residents of both cities face similar income tax bills.
Property Tax
Both cities use Los Angeles County's standard property tax rate of approximately 1.16% of the property's assessed value. However, due to higher property values in Pasadena, residents there generally pay higher property taxes.
Sales Tax
Long Beach and Pasadena have similar tax structures as they both reside within California. The state sales tax is 6%, but local taxes push the total sales tax up to 10.25% in both cities.
Income
Type
Long Beach
Pasadena
Estimated median household income
$73,905
$86,677
Estimated per capita income
$37,217
$55,847
Cost of living index (U.S. average is 100)
142
145.4
If you make $50,000 in Long Beach, you will have to make $51,197 in Pasadena to maintain the same standard of living.
Geographical Conditions
Pasadena is located near the San Gabriel Mountains, providing residents with easy access to hiking and nature. Long Beach, due to its coastal location, offers stunning beachfront views and a variety of water sports activities. Each city offers a contrasting but equally appealing geographical highlight.
Pasadena is home to several highly acclaimed institutions, including the California Institute of Technology and Pasadena City College. Long Beach, while not as internationally renowned for its educational facilities, hosts the well-respected California State University, Long Beach. Both cities provide good educational opportunities, but Pasadena holds a slight edge for those seeking prestigious educational institutions.
Both Long Beach and Pasadena offer a strong economy and employment opportunities but differ in their dominant industries. Long Beach has a vibrant maritime industry and is the second-busiest container port in the United States. Meanwhile, Pasadena's economy is anchored by sectors like education, healthcare, and technology, with some notable companies headquartered there.
Biggest Employers
The biggest employers in Long Beach include Long Beach Unified School District, the City of Long Beach, Long Beach Memorial Medical Center, and Boeing. Meanwhile, Pasadena's largest employers are the California Institute of Technology, Pasadena Unified School District, Huntington Hospital, and Jet Propulsion Laboratory.
There were 304 building permits issued in Long Beach in 2012 (238 more than in 2011) compared to 46 building permits issued in Pasadena in 2012 (25 more than in 2011).
Weather
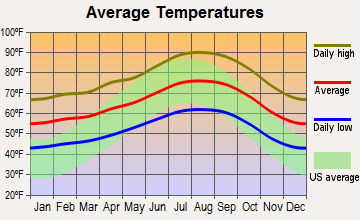
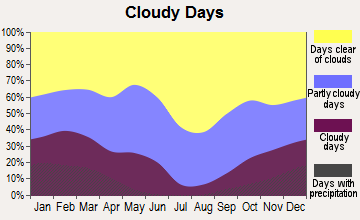
Climate-wise, both cities experience typical Southern California weather with slight variations. Long Beach, located directly on the Pacific coast, offers a more temperate and oceanic climate with cool breezes, while Pasadena, situated further inland, experiences hotter summers and slightly cooler winters. Despite these minor differences, it's safe to say both cities enjoy plenty of sunshine throughout the year.
Weather and climate
Type
Long Beach
Pasadena
Temperature - Average
65.3°F
65.1°F
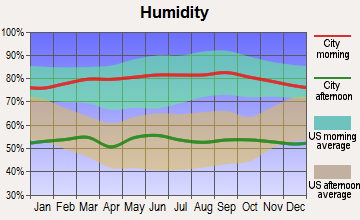
Humidity - Average morning or afternoon humidity
70.4%
62.2%
Humidity - Differences between morning and afternoon humidity
27%
17.3%
Humidity - Maximum monthly morning or afternoon humidity
79%
67%
Humidity - Minimum monthly morning or afternoon humidity
52%
49.7%
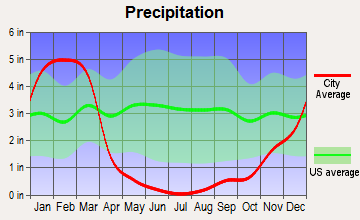
Precipitation - Yearly average
13.1 in
21.8 in
Snowfall - Yearly average
0 in
0 in
Clouds - Number of days clear of clouds
26.4%
28.5%
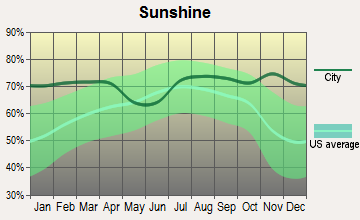
Sunshine amount - Average
78.4%
78.4%
Sunshine amount - Differences during a year
22%
22%
Sunshine amount - Maximum monthly
85%
85%
Sunshine amount - Minimum monthly
63%
63%
Wind speed - Average
6.1 mph
2.6 mph
Average climate in Long Beach, California
Average climate in Pasadena, California
Air pollution
Type
AQI
CO
NO2
OZONE
PB
PM10
PM25
SO2
Year
Long Beach
Pasadena
Long Beach
Pasadena
Long Beach
Pasadena
Long Beach
Pasadena
Long Beach
Pasadena
Long Beach
Pasadena
Long Beach
Pasadena
Long Beach
Pasadena
2018
124
138
0.37
0.37
17.2
14.5
22.1
27.3
0.008
0.008
27.5
28.1
13.5
15.4
0.7
0.4
2017
122
143
0.36
0.27
18.1
15.3
23.2
29.1
0.007
0.007
26.7
31.8
14.5
15.4
0.8
0.5
2016
115
128
0.36
0.27
18.5
15.4
21.9
26.8
0.007
0.007
24.1
30.3
11.6
14.6
0.9
0.4
2015
111
138
0.38
0.27
19.9
15.4
22.5
25.9
0.005
0.006
25.0
29.5
13.9
16.6
0.9
0.3
2014
127
138
0.50
0.27
20.3
16.3
22.0
27.4
0.007
0.007
26.7
31.6
14.3
17.9
1.3
0.4
2013
126
137
0.48
0.40
20.0
18.1
24.7
25.7
0.005
0.007
32.3
27.2
14.6
16.6
1.0
0.4
2012
132
143
0.48
0.46
19.3
17.4
24.4
26.1
0.004
0.007
30.8
26.4
14.1
17.9
0.6
0.5
2011
119
143
0.43
0.57
20.2
20.3
23.4
24.0
0.006
0.009
28.4
28.5
15.6
18.3
1.2
0.4
2010
115
131
0.38
0.55
20.8
19.4
22.7
23.6
0.011
0.017
24.1
28.4
11.9
16.4
0.7
0.5
2009
132
151
0.50
0.31
21.0
22.2
22.0
23.2
0.008
0.011
27.7
40.2
13.1
18.3
1.1
0.5
2008
124
150
0.53
0.64
20.8
23.5
23.2
22.7
0.008
0.014
27.2
38.1
21.6
18.0
1.0
0.7
2007
109
130
0.60
0.70
20.3
24.2
21.1
21.9
0.010
0.017
N/A
N/A
N/A
N/A
1.4
1.1
2006
119
125
0.76
0.73
21.4
24.6
19.9
22.1
0.005
0.010
N/A
N/A
N/A
N/A
1.7
1.5
2005
108
128
0.74
0.73
24.3
24.4
20.5
20.9
0.011
0.015
N/A
N/A
N/A
N/A
2.7
2.1
2004
125
138
0.56
0.87
28.0
27.0
22.9
24.7
0.012
0.019
N/A
N/A
N/A
N/A
2.0
2.4
2003
130
144
0.83
1.15
28.1
31.3
22.4
24.7
0.032
0.027
N/A
N/A
N/A
N/A
1.1
1.7
2002
120
143
0.90
1.08
29.6
33.2
22.2
23.0
0.011
0.024
N/A
N/A
N/A
N/A
2.8
2.2
2001
124
143
0.81
1.20
30.3
33.9
21.5
21.1
0.011
0.035
N/A
N/A
N/A
N/A
3.3
2.1
2000
142
147
0.71
1.23
31.5
29.2
19.6
22.3
0.018
0.031
N/A
N/A
N/A
N/A
2.0
1.2
Natural disasters
Type
Long Beach
Pasadena
Tornado activity compared to U.S. average
18.3%
17.2%
Earthquake activity compared to U.S. average
6,875.1%
7,265.9%
Natural disasters compared to U.S. average
57%
57%
Transportation
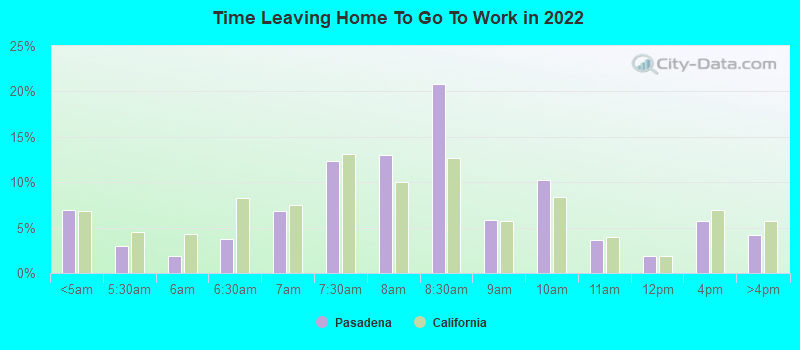
Public transportation is well developed in both cities, with extensive bus routes and access to the Los Angeles Metro Rail system. Long Beach also offers bike-friendly streets and bike-share programs while Pasadena boasts a more car-centric infrastructure. Traffic congestion is generally less severe in Pasadena than in Long Beach.
Transport
Type
Long Beach
Pasadena
Amtrak stations
1
1
Amtrak stations nearby
3
3
FAA registered aircraft
312
96
FAA registered aircraft manufacturers and dealers
29
2
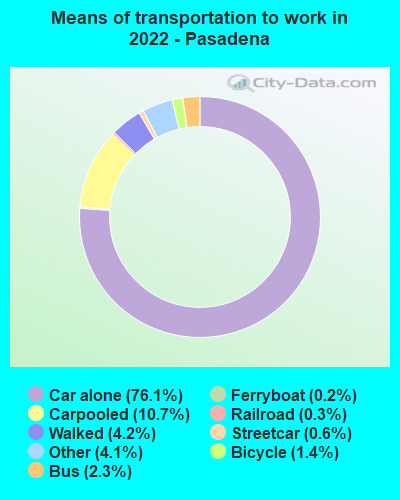
Means of transportation to work
Type
Long Beach
Pasadena
Bicycle
0.5%
0.9%
Bus
3.3%
2.3%
Carpooled
9.8%
8.6%
Car alone
81.8%
78.1%
Motorcycle
0.2%
0.1%
Railroad
0%
0.5%
Streetcar
0.1%
0.9%
Subway
0.5%
0.1%
Taxicab
0%
0.2%
Walked
2.8%
4.9%
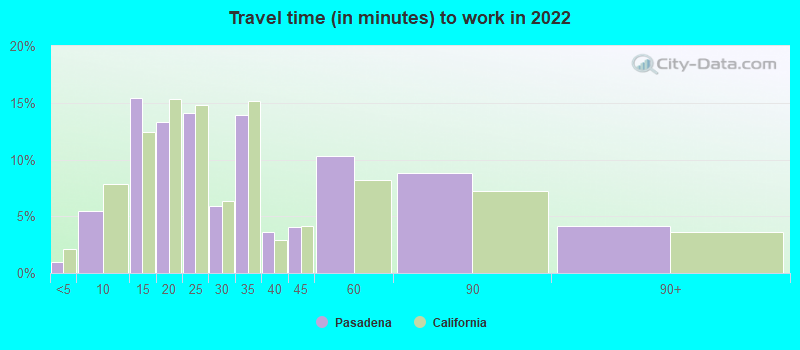
Average travel time to work
Type
Long Beach
Pasadena
Average
30.7 min
30.4 min
Other means
28.5 min
27.1 min
Public transportation
46.4 min
44.3 min
Private vehicle occupancy
Type
Long Beach
Pasadena
Average
1.1
1.1
Drove alone
89.7%
91.7%
In 2 person carpool
8.5%
6.3%
In 3 person carpool
1.4%
1%
In 4 person carpool
0.3%
0.3%
In 5-6 person carpool
0%
0.3%
In 7+ person carpool
0%
0.2%
How many people usually rode to work in the car, truck or van.
Real Estate
Real estate in Pasadena is more expensive than in Long Beach, reflecting its overall higher cost of living. This extends to both rental and homeownership. Properties in Pasadena often include Montecito Heights and the South Arroyo neighborhoods, offering a mix of suburban and urban feel. On the other hand, Long Beach offers more affordable housing options with a variety of choices from beachfront properties to more urban condos and apartments.
Neighborhoods
Both cities offer diverse neighborhoods to accommodate different lifestyles. Pasadena is famous for its charming, historic neighborhoods such as Bungalow Heaven and the Playhouse District. Long Beach, with its downtown condos, trendy Belmont Shore, and the quiet, beachfront Peninsula, has neighborhoods catering to nearly every resident's preferences.
Houses and residents
Type
Long Beach
Pasadena
Houses
179,856
64,644
Average household size (people)
2.8
2.4
Median year apartment built
1964
1971
Median year house/condo built
1954
1950
Length of stay in the house since moving in
15.7 years
14.7 years
Houses occupied
172,599 (96%)
56,992 (88.2%)
Houses occupied by owners
69,470 (40.2%)
24,481 (43%)
Houses occupied by renters
103,129 (59.8%)
32,511 (57%)
Median rent asked for vacant for-rent units
$1,057
$2,547
Median monthly housing costs
$1,692
$2,109
Median price asked for vacant for-sale houses and condos
$520,992
$1,005,903
Estimated median house or condo value
$693,600
$905,900
Median numbers of rooms
4.2
4.3
Median number of rooms in apartments
3.6
3.6
Median number of rooms in houses and condos
5.5
5.7
Median house price - detached houses
$900,658
Over $1,000,000
Median house price - in 2-unit structures
$823,515
$565,856
Median house price - in 3-to-4-unit structures
$495,928
$838,058
Median house price - in 5 or more unit structures
$488,399
$831,118
Median house price - mobile homes
$333,777
$115,327
Median house price - Townhouses or other attached units
$634,684
$886,230
Median house price - All housing units
$805,766
Over $1,000,000
Median house age
62
60
Renting percentage
58.4%
55%
Housing density (houses/condos per square mile)
3,565.7
2,798.7
House value disparities
21.3%
18.9%
Household income disparities
44.7%
45.1%
Median household income for houses/condes with a mortgage
$116,421
$156,770
Median household income for apartments without a mortgage
$79,392
$94,958
Housing units without a mortgage
394 (0.8%)
140 (0.8%)
Housing units with both a second mortgage and home equity loan
3,069 (6.2%)
1,730 (9.7%)
Housing units with a mortgage
49,321 (99.2%)
17,765 (99.2%)
Housing units with a home equity loan
48 (0.1%)
44 (0.2%)
Housing units with a second mortgage
3,709 (7.5%)
2,135 (11.9%)
House/condo owner moved in on average (years ago)
15
13
House/condo renter moved in on average (years ago)
3
3
Housing units lacking complete kitchen facilities
2.6%
3.2%
Housing units lacking complete plumbing facilities
0.4%
0.5%
Housing units in structures
Housing units in structures
Long Beach
Pasadena
One, detached
40.2%
41.9%
One, attached
4.9%
5.9%
Two
5.3%
2.6%
3 or 4
8.8%
3.0%
5 to 9
10.4%
9.1%
10 to 19
10.8%
8.9%
20 to 49
8.0%
10.7%
50 or more
10.6%
17.7%
Mobile homes
0.8%
0.1%
Boats, RVs, vans, etc.
0.2%
0.0%
Median real estate property taxes paid for housing units
Self-employed workers in own not incorporated business
18,532
10,106
State government workers
6,550
1,850
Unpaid family workers
178
80
Industries and Occupations
Major industries that employ most residents in Long Beach are healthcare, education, tourism, and maritime industry. In contrast, higher education and research, healthcare, and technology drive Pasadena's economy. However, the job market is healthy and evolving in both cities, offering abundant opportunities for professionals.
Health diagnosing and treating practitioners and other technical occupations
4.9%
7.3%
Community and social service occupations
4.4%
3.1%
Personal care and service occupations
3.6%
2.7%
Arts, design, entertainment, sports, and media occupations
3.0%
6.5%
Building and grounds cleaning and maintenance occupations
2.9%
4.0%
Health technologists and technicians
2.8%
1.6%
Material moving occupations
2.8%
0.6%
Production occupations
2.7%
1.7%
Computer and mathematical occupations
1.9%
3.5%
Transportation occupations
1.4%
0.5%
Life, physical, and social science occupations
1.3%
2.7%
Legal occupations
1.3%
3.6%
Architecture and engineering occupations
1.0%
1.8%
Health Care
Both Long Beach and Pasadena offer high-quality health care facilities. Long Beach Memorial Medical Center is one of the major healthcare providers in Long Beach, while Huntington Hospital provides excellent healthcare services in Pasadena. Numerous other clinics and specialty hospitals exist in both cities.
Pasadena boasts superior infrastructure compared to Long Beach, thanks to the city's long history and substantial investments. Several well-maintained public parks, a variety of historic places, world-famous sports venues and event centers enhance the city's appeal. On the other hand, Long Beach has extensive beachfront developments and a number of high-rise apartments and commercial buildings, all with superior views.
Infrastructure
Type
Long Beach
Pasadena
Hospitals
17
6
TV stations
5
26
Arenas or stadiums
2
1
Bank branches located here
67
50
Bank institutions located here
18
24
Main business address for public companies
11
9
Drinking water stations with no reported violations in the past
2
0
Drinking water stations with reported violations in the past
HMDA - Conventional home purchase loans - Applications denied
Year
Long Beach
Pasadena
1999
1,159
383
2000
710
440
2001
677
369
2002
708
378
2003
1,861
356
2004
2,162
474
2005
3,065
659
2006
3,591
751
2007
2,287
619
2008
887
248
2009
475
197
Culture and Food
Both cities have diverse cultures and dining experiences. Pasadena offers fine dining restaurants, art galleries, shopping areas, and the iconic Rose Parade. Long Beach has its own cultural attractions, with a more laid-back beach lifestyle. There’s a huge range of food options from Asian fusion to Mexican, Middle Eastern to organic vegan in both cities.
Sports Teams
Neither Long Beach nor Pasadena is home to major professional sports teams. However, Pasadena attracts football fans nationwide as the city hosts the famous Rose Bowl, a major venue that has hosted the Super Bowl and World Cup matches. Long Beach, meanwhile, hosts the annual Long Beach Grand Prix, a major draw for racing fans.


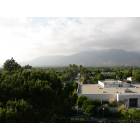
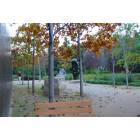
 Long Beach, CA
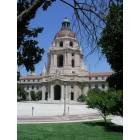
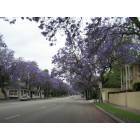
 Pasadena, CA