Estimated zip code population in 2022: 19,573 Zip code population in 2010: 20,460 Zip code population in 2000: 16,809
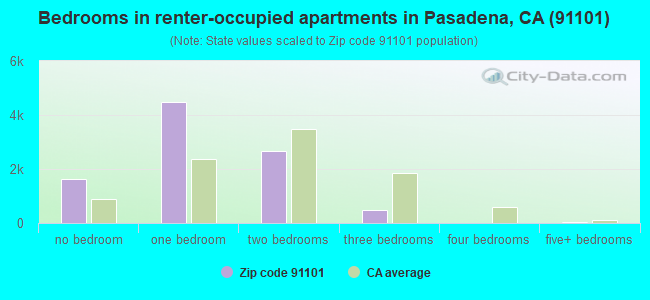
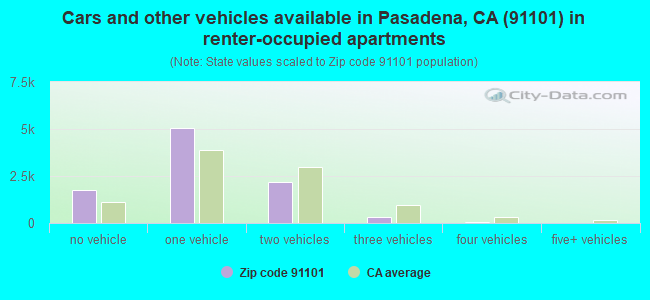
Houses and condos: 12,278 Renter-occupied apartments: 9,281
% of renters here:
85%
State:
44%
March 2022 cost of living index in zip code 91101: 135.3 (high, U.S. average is 100)
Land area: 1.3 sq. mi. Water area: 0.0 sq. mi.
Population density: 14,776 people per square mile
(very high).
OSM Map
General Map
Google Map
MSN Map
OSM Map
General Map
Google Map
MSN Map
OSM Map
General Map
Google Map
MSN Map
OSM Map
General Map
Google Map
MSN Map
Please wait while loading the map...
Real estate property taxes paid for housing units in 2022:
This zip code:
0.8% ($6,083)
California:
0.7% ($4,831)
Median real estate property taxes paid for housing units with mortgages in 2022: $6,164 (0.9%) Median real estate property taxes paid for housing units with no mortgage in 2022: $5,655 (0.8%)
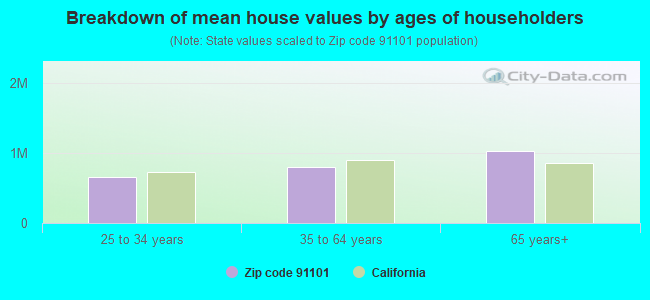
Estimated median house/condo value in 2022: $727,301
91101:
$727,301
California:
$715,900
According to our research of California and other state lists, there were 9 registered sex offenders living in 91101 zip code as of April 27, 2024. The ratio of all residents to sex offenders in zip code 91101 is 2,340 to 1. The ratio of registered sex offenders to all residents in this zip code is much lower than the state average.
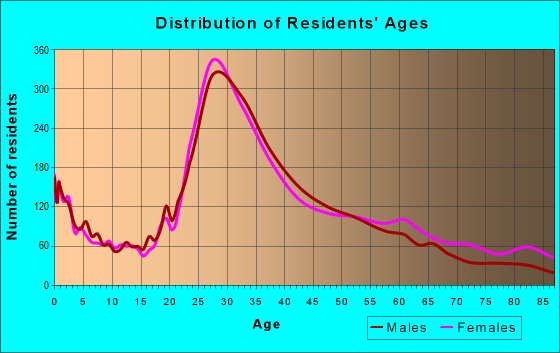
Median resident age:
This zip code:
37.6 years
California median age:
37.9 years
Average household size:
This zip code:
1.7 people
California:
2.8 people
Averages for the 2020 tax year for zip code 91101, filed in 2021:
Average Adjusted Gross Income (AGI) in 2020: $97,773 (Individual Income Tax Returns)
Here:
$97,773
State:
$95,910
Salary/wage: $80,102 (reported on 82.7% of returns)
Here:
$80,102
State:
$77,331
(% of AGI for various income ranges: 1208.5% for AGIs below $25k, 4108.3% for AGIs $25k-50k, 7907.0% for AGIs $50k-75k, 11772.9% for AGIs $75k-100k, 21486.0% for AGIs $100k-200k, 88590.0% for AGIs over 200k)
Taxable interest for individuals: $3,445 (reported on 36.2% of returns)
This zip code:
$3,445
California:
$2,294
(% of AGI for various income ranges: 22.1% for AGIs below $25k, 37.4% for AGIs $25k-50k, 45.4% for AGIs $50k-75k, 46.7% for AGIs $75k-100k, 148.5% for AGIs $100k-200k, 3954.4% for AGIs over 200k)
Ordinary dividends: $11,922 (reported on 27.4% of returns)
Here:
$11,922
State:
$10,949
(% of AGI for various income ranges: 36.2% for AGIs below $25k, 69.7% for AGIs $25k-50k, 122.4% for AGIs $50k-75k, 169.2% for AGIs $75k-100k, 535.0% for AGIs $100k-200k, 9900.8% for AGIs over 200k)
Net capital gain/loss in AGI: +$29,663 (reported on 26.3% of returns)
Here:
+$29,663
State:
+$49,306
(% of AGI for various income ranges: 16.4% for AGIs below $25k, 52.4% for AGIs $25k-50k, 139.5% for AGIs $50k-75k, 182.3% for AGIs $75k-100k, 677.9% for AGIs $100k-200k, 28635.2% for AGIs over 200k)
Profit/loss from business: +$16,833 (reported on 20.5% of returns)
Here:
+$16,833
State:
+$15,671
(% of AGI for various income ranges: 226.1% for AGIs below $25k, 265.7% for AGIs $25k-50k, 280.3% for AGIs $50k-75k, 360.8% for AGIs $75k-100k, 757.9% for AGIs $100k-200k, 6180.4% for AGIs over 200k)
Taxable individual retirement arrangement distribution: $29,003 (reported on 6.2% of returns)
91101:
$29,003
California:
$23,505
(% of AGI for various income ranges: 33.6% for AGIs below $25k, 80.1% for AGIs $25k-50k, 101.0% for AGIs $50k-75k, 242.0% for AGIs $75k-100k, 589.3% for AGIs $100k-200k, 3262.4% for AGIs over 200k)
Self-employed (Keogh) retirement plans: $24,250 (reported on 0.9% of returns)
91101:
$24,250
California:
$30,163
(% of AGI for various income ranges: 21.2% for AGIs $25k-50k, 56.0% for AGIs $100k-200k, 619.2% for AGIs over 200k)
Total itemized deductions: $43,313 (reported on 13.4% of returns)
Here:
$43,313
State:
$39,517
(% of AGI for various income ranges: 118.2% for AGIs below $25k, 157.8% for AGIs $25k-50k, 384.0% for AGIs $50k-75k, 655.9% for AGIs $75k-100k, 1623.2% for AGIs $100k-200k, 12585.6% for AGIs over 200k)
Charity contributions: $16,459 (reported on 11.0% of returns)
Here:
$16,459
State:
$12,598
(% of AGI for various income ranges: 3.2% for AGIs below $25k, 21.8% for AGIs $25k-50k, 44.7% for AGIs $50k-75k, 106.6% for AGIs $75k-100k, 318.0% for AGIs $100k-200k, 5666.8% for AGIs over 200k)
Taxes paid: $8,482 (reported on 13.4% of returns)
91101:
$8,482
State:
$8,807
(% of AGI for various income ranges: 15.1% for AGIs below $25k, 30.7% for AGIs $25k-50k, 83.3% for AGIs $50k-75k, 196.1% for AGIs $75k-100k, 482.2% for AGIs $100k-200k, 1602.4% for AGIs over 200k)
Earned income credit: $1,491 (reported on 9.5% of returns)
Here:
$1,491
State:
$2,074
(% of AGI for various income ranges: 65.7% for AGIs below $25k, 31.7% for AGIs $25k-50k)
Percentage of individuals using paid preparers for their 2020 taxes: 92.0%
Here:
92%
State:
92%
(% for various income ranges: 88.8% for AGIs below $25k, 92.2% for AGIs $25k-50k, 93.6% for AGIs $50k-75k, 92.2% for AGIs $75k-100k, 93.5% for AGIs $100k-200k, 94.3% for AGIs over 200k)
Averages for the 2012 tax year for zip code 91101, filed in 2013:
Average Adjusted Gross Income (AGI) in 2012: $83,322 (Individual Income Tax Returns)
Here:
$83,322
State:
$72,726
Salary/wage: $65,775 (reported on 83.4% of returns)
Here:
$65,775
State:
$59,079
(% of AGI for various income ranges: 81.1% for AGIs below $25k, 85.0% for AGIs $25k-50k, 86.1% for AGIs $50k-75k, 82.8% for AGIs $75k-100k, 81.6% for AGIs $100k-200k, 39.6% for AGIs over 200k)
Taxable interest for individuals: $2,822 (reported on 37.3% of returns)
This zip code:
$2,822
California:
$2,146
(% of AGI for various income ranges: 1.1% for AGIs below $25k, 0.7% for AGIs $25k-50k, 0.4% for AGIs $50k-75k, 0.6% for AGIs $75k-100k, 0.5% for AGIs $100k-200k, 2.3% for AGIs over 200k)
Ordinary dividends: $18,440 (reported on 22.6% of returns)
Here:
$18,440
State:
$9,308
(% of AGI for various income ranges: 2.4% for AGIs below $25k, 1.2% for AGIs $25k-50k, 1.5% for AGIs $50k-75k, 1.8% for AGIs $75k-100k, 2.4% for AGIs $100k-200k, 9.6% for AGIs over 200k)
Net capital gain/loss in AGI: +$17,513 (reported on 19.9% of returns)
Here:
+$17,513
State:
+$30,460
(% of AGI for various income ranges: 0.3% for AGIs $25k-50k, 0.4% for AGIs $50k-75k, 0.7% for AGIs $75k-100k, 1.5% for AGIs $100k-200k, 9.3% for AGIs over 200k)
Profit/loss from business: +$15,717 (reported on 18.7% of returns)
Here:
+$15,717
State:
+$17,064
(% of AGI for various income ranges: 8.4% for AGIs below $25k, 4.3% for AGIs $25k-50k, 2.3% for AGIs $50k-75k, 3.3% for AGIs $75k-100k, 3.3% for AGIs $100k-200k, 3.3% for AGIs over 200k)
Taxable individual retirement arrangement distribution: $20,670 (reported on 6.3% of returns)
91101:
$20,670
California:
$19,557
(% of AGI for various income ranges: 2.0% for AGIs below $25k, 1.2% for AGIs $25k-50k, 1.4% for AGIs $50k-75k, 1.5% for AGIs $75k-100k, 1.6% for AGIs $100k-200k, 1.6% for AGIs over 200k)
Self-employment retirement plans: $27,367 (reported on 0.9% of returns)
91101:
$27,367
California:
$24,530
(% of AGI for various income ranges: 0.4% for AGIs $50k-75k, 0.3% for AGIs $100k-200k, 0.5% for AGIs over 200k)
Total itemized deductions: $41,748 (25% of AGI, reported on 36.3% of returns)
Here:
$41,748
State:
$34,004
Here:
25.2% of AGI
State:
22.7% of AGI
(% of AGI for various income ranges: 14.6% for AGIs below $25k, 9.2% for AGIs $25k-50k, 11.1% for AGIs $50k-75k, 13.9% for AGIs $75k-100k, 15.6% for AGIs $100k-200k, 25.6% for AGIs over 200k)
Charity contributions: $7,530 (reported on 28.7% of returns)
Here:
$7,530
State:
$4,659
(% of AGI for various income ranges: 0.7% for AGIs below $25k, 1.0% for AGIs $25k-50k, 1.3% for AGIs $50k-75k, 1.6% for AGIs $75k-100k, 1.7% for AGIs $100k-200k, 4.4% for AGIs over 200k)
Taxes paid: $16,467 (reported on 36.0% of returns)
91101:
$16,467
State:
$14,448
(% of AGI for various income ranges: 2.6% for AGIs below $25k, 1.7% for AGIs $25k-50k, 3.1% for AGIs $50k-75k, 5.6% for AGIs $75k-100k, 7.1% for AGIs $100k-200k, 10.6% for AGIs over 200k)
Earned income credit: $1,671 (reported on 12.8% of returns)
Here:
$1,671
State:
$2,286
(% of AGI for various income ranges: 4.6% for AGIs below $25k, 0.4% for AGIs $25k-50k)
Percentage of individuals using paid preparers for their 2012 taxes: 56.4%
Here:
56%
State:
64%
(% for various income ranges: 55.6% for AGIs below $25k, 53.6% for AGIs $25k-50k, 51.0% for AGIs $50k-75k, 54.3% for AGIs $75k-100k, 62.6% for AGIs $100k-200k, 79.2% for AGIs over 200k)
Averages for the 2004 tax year for zip code 91101, filed in 2005:
Average Adjusted Gross Income (AGI) in 2004: $56,917 (Individual Income Tax Returns)
Here:
$56,917
State:
$58,600
Salary/wage: $51,694 (reported on 83.3% of returns)
Here:
$51,694
State:
$49,455
(% of AGI for various income ranges: 5033.6% for AGIs below $10k, 81.0% for AGIs $10k-25k, 87.5% for AGIs $25k-50k, 84.8% for AGIs $50k-75k, 83.5% for AGIs $75k-100k, 62.3% for AGIs over 100k)
Taxable interest for individuals: $2,402 (reported on 45.2% of returns)
This zip code:
$2,402
California:
$2,365
(% of AGI for various income ranges: 509.7% for AGIs below $10k, 1.9% for AGIs $10k-25k, 1.4% for AGIs $25k-50k, 1.3% for AGIs $50k-75k, 1.4% for AGIs $75k-100k, 2.2% for AGIs over 100k)
Taxable dividends: $7,590 (reported on 25.0% of returns)
Here:
$7,590
State:
$4,746
(% of AGI for various income ranges: 424.8% for AGIs below $10k, 2.2% for AGIs $10k-25k, 1.3% for AGIs $25k-50k, 1.5% for AGIs $50k-75k, 2.3% for AGIs $75k-100k, 5.1% for AGIs over 100k)
Net capital gain/loss: +$10,876 (reported on 22.4% of returns)
Here:
+$10,876
State:
+$23,418
(% of AGI for various income ranges: -211.5% for AGIs below $10k, 0.3% for AGIs $10k-25k, 0.1% for AGIs $25k-50k, 0.8% for AGIs $50k-75k, 1.5% for AGIs $75k-100k, 8.6% for AGIs over 100k)
Profit/loss from business: +$15,454 (reported on 18.4% of returns)
Here:
+$15,454
State:
+$16,826
(% of AGI for various income ranges: 451.3% for AGIs below $10k, 7.9% for AGIs $10k-25k, 3.9% for AGIs $25k-50k, 3.5% for AGIs $50k-75k, 3.1% for AGIs $75k-100k, 5.9% for AGIs over 100k)
IRA payment deduction: $2,761 (reported on 2.6% of returns)
91101:
$2,761
California:
$3,192
(% of AGI for various income ranges: 0.3% for AGIs $10k-25k, 0.3% for AGIs $25k-50k, 0.1% for AGIs $50k-75k, 0.1% for AGIs $75k-100k, 0.1% for AGIs over 100k)
Self-employed pension: $16,450 (reported on 1.4% of returns)
Here:
$16,450
California:
$17,688
(% of AGI for various income ranges: 32.7% for AGIs below $10k, 0.2% for AGIs $25k-50k, 0.3% for AGIs $50k-75k, 0.2% for AGIs $75k-100k, 0.6% for AGIs over 100k)
Total itemized deductions: $25,655 (25% of AGI, reported on 37.5% of returns)
Here:
$25,655
State:
$28,113
Here:
24.7% of AGI
State:
25.3% of AGI
(% of AGI for various income ranges: 1214.2% for AGIs below $10k, 11.6% for AGIs $10k-25k, 12.4% for AGIs $25k-50k, 15.6% for AGIs $50k-75k, 17.6% for AGIs $75k-100k, 19.0% for AGIs over 100k)
Charity contributions deductions: $4,313 (4% of AGI, reported on 31.9% of returns)
Here:
$4,313
State:
$3,923
Here:
4.0% of AGI
State:
3.3% of AGI
(% of AGI for various income ranges: 52.2% for AGIs below $10k, 1.0% for AGIs $10k-25k, 1.5% for AGIs $25k-50k, 2.1% for AGIs $50k-75k, 2.3% for AGIs $75k-100k, 3.1% for AGIs over 100k)
Total tax: $10,698 (reported on 80.2% of returns)
91101:
$10,698
State:
$10,761
(% of AGI for various income ranges: 245.1% for AGIs below $10k, 4.7% for AGIs $10k-25k, 8.6% for AGIs $25k-50k, 12.3% for AGIs $50k-75k, 14.1% for AGIs $75k-100k, 20.1% for AGIs over 100k)
Earned income credit: $1,492 (reported on 11.5% of returns)
Here:
$1,492
State:
$1,763
Percentage of individuals using paid preparers for their 2004 taxes: 58.8%
Here:
59%
State:
66%
(% for various income ranges: 53.5% for AGIs below $10k, 60.2% for AGIs $10k-25k, 56.0% for AGIs $25k-50k, 56.9% for AGIs $50k-75k, 60.1% for AGIs $75k-100k, 71.5% for AGIs over 100k)
Likely homosexual households (counted as self-reported same-sex unmarried-partner households)
Lesbian couples: 0.2% of all households
Gay men: 0.6% of all households
Household received Food Stamps/SNAP in the past 12 months: 1,037 Household did not receive Food Stamps/SNAP in the past 12 months: 9,852
Women who had a birth in the past 12 months: 161 (145 now married, 15 unmarried) Women who did not have a birth in the past 12 months: 5,583 (1,792 now married, 3,808 unmarried)
Housing units in zip code 91101 with a mortgage: 1,225 (89 second mortgage, 92 both second mortgage and home equity loan) Median monthly owner costs for units with a mortgage: $2,864 Median monthly owner costs for units without a mortgage: $1,092
Residents with income below the poverty level in 2022:
This zip code:
19.3%
Whole state:
12.2%
Residents with income below 50% of the poverty level in 2022:
This zip code:
8.9%
Whole state:
6.2%
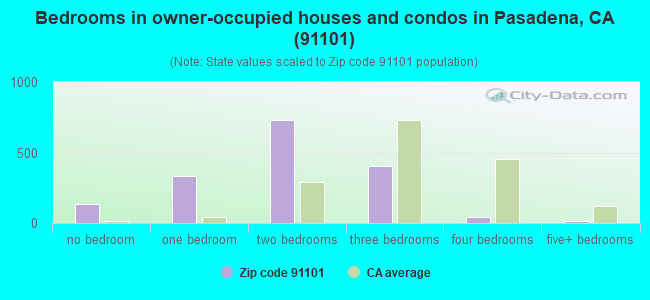
Median number of rooms in houses and condos:
Here:
4.3
State:
6.0
Median number of rooms in apartments:
Here:
3.1
State:
3.9
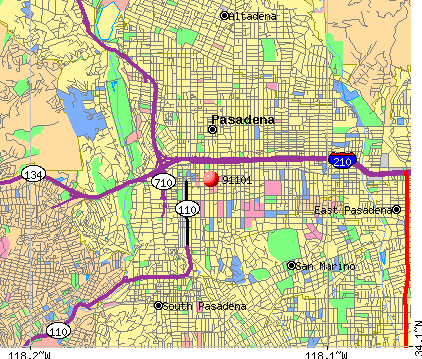
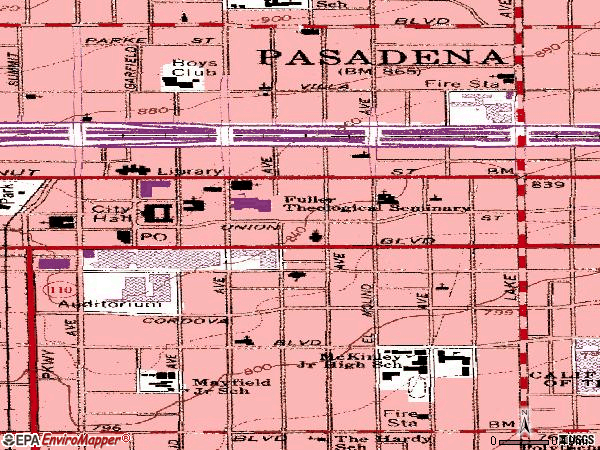
Notable locations in this zip code not listed on our city pages
Notable locations in zip code 91101: Pasadena Playhouse (A), Pasadena Civic Auditorium (B), Pacific Asia Museum (C), Pasadena Public Library (D), Pasadena City Hall (E), Grace Nicholson Art Gallery (F), Pasadena Fire Department Station 33 (G), City of Pasadena Paramedics (H), Pasadena Museum of California Art (I). Display/hide their locations on the map
Churches in zip code 91101 include: First Church of Christ Scientist (A), First Congregational Church of Pasadena (B), First United Methodist Church of Pasadena (C), Lake Avenue Congregational Church (D), All Saints Episcopal Church (E), Iglesia Nueva Vida (F), Marengo Avenue Community Church (G). Display/hide their locations on the map
1,229 married couples with children.
594 single-parent households (257 men, 337 women).
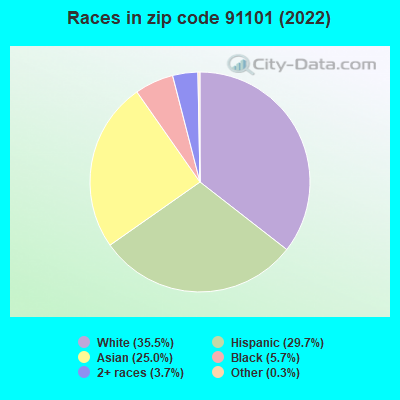
58.2% of residents of 91101 zip code speak English at home.
19.5% of residents speak Spanish at home (71% very well, 15% well, 10% not well, 4% not at all).
6.1% of residents speak other Indo-European language at home (78% very well, 8% well, 11% not well, 3% not at all).
15.4% of residents speak Asian or Pacific Island language at home (47% very well, 21% well, 29% not well, 4% not at all).
0.7% of residents speak other language at home (89% very well, 11% not at all).
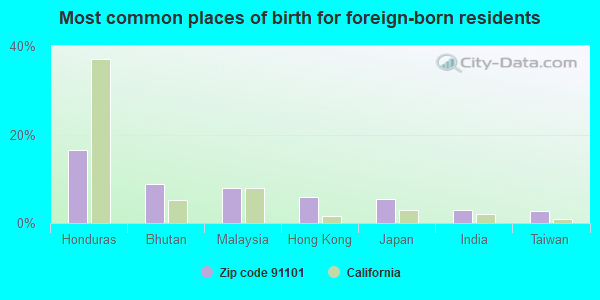
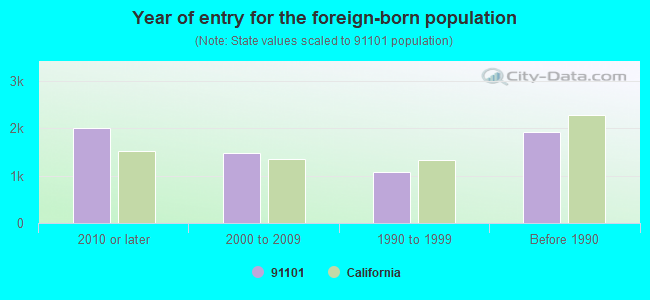
Foreign born population: 6,163 (31.5%) (53.7% of them are naturalized citizens)
Major facilities with environmental interests located in this zip code:
FASHION CLEANERS (140 N LAKE AVE in PASADENA, CA)
STATE MASTER (California - Hazardous Waste Tracking) - HAZARDOU WASTE PROGRAM Small Quantity Generators, between 100 kg and 1000 kg of hazardous waste/month (Resource Conservation and Recovery Act (tracking hazardous waste)) - notification Organizations: MEGREDICH ARAMIAN (CONTACT/OWNER)
MAGIC CLEANERS (89 N LAKE AVE in PASADENA, CA)
STATE MASTER (California - Hazardous Waste Tracking) - HAZARDOU WASTE PROGRAM Small Quantity Generators, between 100 kg and 1000 kg of hazardous waste/month (Resource Conservation and Recovery Act (tracking hazardous waste)) - notification Organizations: DANIEL KERTENIAN (CONTACT/OWNER)
CHEVRON STATION NO 93248 (666 N LAKE AVE in PASADENA, CA)
STATE MASTER (California - Hazardous Waste Tracking) - HAZARDOU WASTE PROGRAM Small Quantity Generators, between 100 kg and 1000 kg of hazardous waste/month (Resource Conservation and Recovery Act (tracking hazardous waste)) - notification Organizations: CHEVRON PRODUCTS CO (CONTACT/OWNER)
MCKINLEY (325 SOUTH OAK KNOLL AVE. in PASADENA, CA)
(National Center for Education Statistics) - STATE ID-6120265 Organizations: PASADENA UNIFIED (SCHOOL DISTRICT)
HERTZ RENT A CAR (980 EAST COLORADO in PASADENA, CA)
EXXON MOBIL OIL CORP (392 N LAKE AVE in PASADENA, CA)
HAZARDOUS WASTE BIENNIAL REPORTER (Resource Conservation and Recovery Act (tracking hazardous waste)) Large Quantity Generators, more that 1000 kg of hazardous waste/month (Resource Conservation and Recovery Act (tracking hazardous waste))
INDEPENDENT BMW SERVICE (1475 NORTH LAKE AVE in PASADENA, CA)
Small Quantity Generators, between 100 kg and 1000 kg of hazardous waste/month (Resource Conservation and Recovery Act (tracking hazardous waste)) - notification Business NAICS classification: GENERAL AUTOMOTIVE REPAIR. Organizations: JUAN C CIUFFO (CONTACT/OWNER)
LA DEPT OF WATER POWER WATER QUALITY LAB (555 E WALNUT ST in PASADENA, CA)
Small Quantity Generators, between 100 kg and 1000 kg of hazardous waste/month (Resource Conservation and Recovery Act (tracking hazardous waste)) - notification Organizations: LA DEPT OF WATER AND POWER (CONTACT/OPERATOR)
Alternative names: M W H LABORATORIES A DIVISION OF M W H A
CHETS AUTO SVC (767 E GREEN ST in PASADENA, CA)
Small Quantity Generators, between 100 kg and 1000 kg of hazardous waste/month (Resource Conservation and Recovery Act (tracking hazardous waste)) - notification Business NAICS classification: GENERAL AUTOMOTIVE REPAIR. Organizations: CHESTER S YASHUR (CONTACT/OWNER)
KEUFFEL & ESSER CO PASADENA PLT (35 N. DELACEY AVENUE in PASADENA, CA)
Small Quantity Generators, between 100 kg and 1000 kg of hazardous waste/month (Resource Conservation and Recovery Act (tracking hazardous waste))
LEXES CLEANERS (3703 HUNTINGTON DR in PASADENA, CA)
Small Quantity Generators, between 100 kg and 1000 kg of hazardous waste/month (Resource Conservation and Recovery Act (tracking hazardous waste)) - notification Organizations: JAKE CANCIK (CONTACT/OWNER)
LITTLE ENGINE SHOP THE (767 E GREEN ST UNIT B in PASADENA, CA)
Small Quantity Generators, between 100 kg and 1000 kg of hazardous waste/month (Resource Conservation and Recovery Act (tracking hazardous waste)) - notification Business NAICS classification: GENERAL AUTOMOTIVE REPAIR. Organizations: STEVEN LAKATOS (CONTACT/OWNER)
LIVE WIRE CLEANERS (635 E COLORADO BLVD in PASADENA, CA)
Small Quantity Generators, between 100 kg and 1000 kg of hazardous waste/month (Resource Conservation and Recovery Act (tracking hazardous waste)) - notification Organizations: LAN CHU OR LYLE WANG (CONTACT/OWNER)
Housing units lacking complete plumbing facilities: 0.8% Housing units lacking complete kitchen facilities: 3.6%
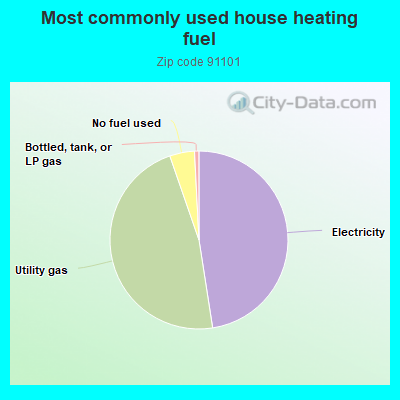
47.5%Electricity
47.1%Utility gas
4.5%No fuel used
0.8%Bottled, tank, or LP gas
Population in 1990: 16,045. Population change in the 1990s: +764 (+4.8%).
Place of birth for U.S.-born residents:
This state: 8,683
Northeast: 1,228
Midwest: 1,301
South: 1,308
West: 617
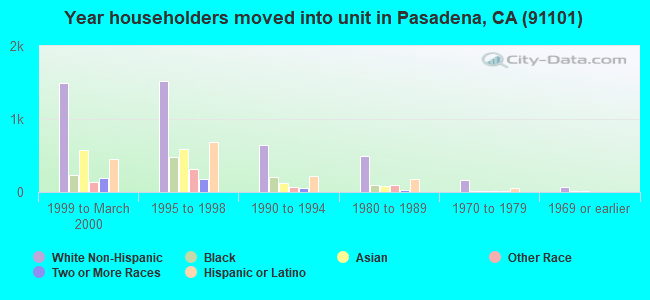
37% of the 91101 zip code residents lived in the same house 5 years ago. Out of people who lived in different houses, 68% lived in this county. Out of people who lived in different counties, 50% lived in California.
80% of the 91101 zip code residents lived in the same house 1 year ago. Out of people who lived in different houses, 63% moved from this county. Out of people who lived in different houses, 9% moved from different county within same state. Out of people who lived in different houses, 20% moved from different state. Out of people who lived in different houses, 6% moved from abroad.
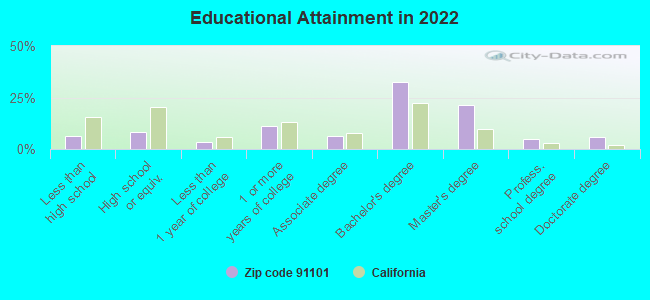
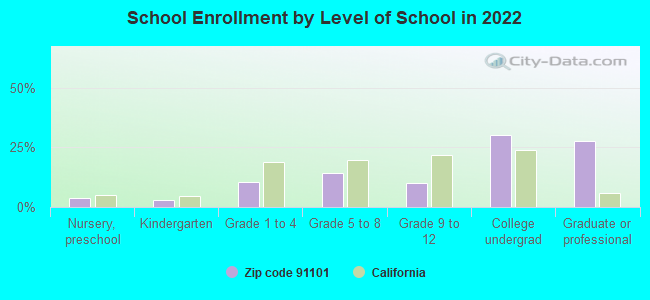
Private vs. public school enrollment:
Students in private schools in grades 1 to 8 (elementary and middle school): 34
Here:
4.1%
California:
10.5%
Students in private schools in grades 9 to 12 (high school): 94
Here:
27.7%
California:
8.5%
Students in private undergraduate colleges: 313
Here:
30.2%
California:
15.9%
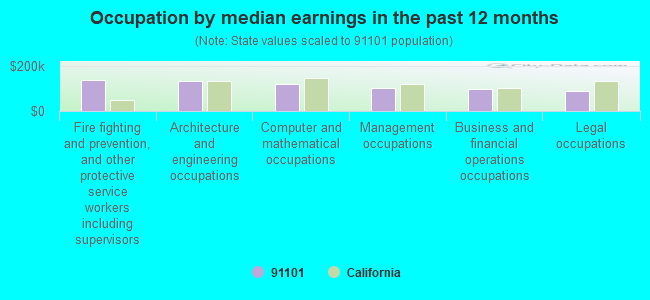
Occupation by median earnings in the past 12 months ($)
138,368Fire fighting and prevention, and other protective service workers including supervisors
133,775Architecture and engineering occupations
116,762Computer and mathematical occupations
99,499Management occupations
97,403Business and financial operations occupations
89,471Legal occupations
Companies with biggest federal contracts located in this zip code:
COGNITECH, INC (225 S LAKE AVE STE 601 in PASADENA, CA; small business) : $6,337,389 in 23 contractsfrom 2000 to 2006
Contracts for Physical Sciences -- Basic Research (R&D), Other Defense -- Applied Research and Exploratory Development (R&D), Other Defense -- Basic Research (R&D), Physical Sciences -- Applied Research and Exploratory Development (R&D), and moreby Department of Defense, Army, National Geospatial-Intelligence Agency, Air Force, and others Signed by year:2000: $824,338; 2001: $510,000; 2002: $909,608; 2003: $1,277,034; 2004: $982,943; 2005: $1,310,525; 2006: $522,941.
Biggest contracts:
$1,044,000 with Department of Defense for Physical Sciences -- Basic Research (R&D). Signed on 2005-03-24. Completion date: 2006-11-24.
$533,028 with Army for Other Defense -- Applied Research and Exploratory Development (R&D). Signed on 2004-02-26. Completion date: 2005-11-15.
$522,941 with National Geospatial-Intelligence Agency for Other Defense -- Basic Research (R&D). Signed on 2006-05-24. Completion date: 2008-08-22.
$474,338 with Air Force for Physical Sciences -- Applied Research and Exploratory Development (R&D). Signed on 2000-03-30. Completion date: 2001-02-28.
DIVERSIFIED CAPITAL INC (99 S LK AVE SUOTE 210 in PASADENA, CA; small business) 30 employees, $866420 revenue. Small Disadvantaged Business: $4,616,897 in 19 contractsfrom 1999 to 2003
Contracts for Program Management/Support Services, Accounting/Financial Management Studies, Accounting Services (NOTE: New code created for Financial Services See R710 below), Other Professional Services, and moreby Federal Transit Administration, Small Business Administration, HOUSING AND URBAN DEVELOPMENT, Department of, Office of the Chief People Officer, and others Signed by year:2000: $1,956,000; 2001: $683,000; 2002: $399,000; 2003: $1,528,897; 2004: $0; 2005: $0; 2006: $0.
Biggest contracts:
$1,440,590 with Federal Transit Administration for Program Management/Support Services. Signed on 2003-06-15. Completion date: 2004-12-15.
$940,000 with Federal Transit Administration for Accounting/Financial Management Studies. Signed on 2000-05-15. Completion date: 2002-06-15.
$525,000, same as above.Signed on 2001-03-15. Completion date: 2003-04-15.
$496,000 with Small Business Administration for Accounting Services (NOTE: New code created for Financial Services See R710 below). Taking place in DC. Signed on 2000-06-15. Completion date: 2001-06-15.
PHOTOBIT CORPORATION (135 N LOS ROBLES AVE in PASADENA, CA; small business) : $4,409,368 in 32 contractsfrom 1999 to 2004
Contracts for Other Research and Development -- Basic Research (R&D), Other Defense -- Applied Research and Exploratory Development (R&D), Defense Electronics and Communication Equipment -- Management and Support (R&D), Environmental Sciences -- Applied Research and Exploratory Development (R&D), and moreby Army, Air Force, NASA Signed by year:2000: $2,631,586; 2001: $1,421,399; 2002: $15,000; 2003: $47,812; 2004: $153,578; 2005: $0; 2006: $0.
Biggest contracts:
$730,614 with Army for Other Research and Development -- Basic Research (R&D). Signed on 2000-10-19. Completion date: 2000-11-19.
$601,102, same as above.Signed on 2000-09-28. Completion date: 2000-09-28.
$367,782 with Army for Other Defense -- Applied Research and Exploratory Development (R&D). Signed on 2000-01-10. Completion date: 2000-12-11.
$364,643, same as above.Signed on 2001-05-18. Completion date: 2003-04-13.
MITSUI FUDOSAN USA INC (P O BOX 31001 1605 in PASADENA, CA) 7 employees, $200000 revenue: $2,859,594 in 21 contractsfrom 2003 to 2005
Contracts for Lease or Rental of Facilities -- Office Buildings, Maintenance, Repair or Alteration of Real Property -- Office Buildings by Public Buildings Service Signed by year:2000: $0; 2001: $0; 2002: $0; 2003: $1,708,548; 2004: $439,151; 2005: $711,895; 2006: $0.
Biggest contracts:
$142,379 with Public Buildings Service for Lease or Rental of Facilities -- Office Buildings. Signed on 2005-01-01. Completion date: 2005-04-19.
$142,379, same as above.Signed on 2005-01-01. Completion date: 2005-04-19.
$142,379, same as above.Signed on 2005-01-01. Completion date: 2005-03-19.
$142,379, same as above.Signed on 2005-01-01. Completion date: 2005-02-19.
WALKERS ELECTRONICS, INC (609 E WALNUT ST STE 202 in PASADENA, CA; small business) : $771,112 in 18 contractsfrom 2002 to 2006
Contracts for Maintenance, Repair or Alteration of Real Property -- Highways, Roads, Streets, Bridges, and Railways (includes resurfacing), Transformers: Distribution and Power Station, Maintenance, Repair or Alteration of Real Property -- Other Non-Building Facilities, Electrical and Electronic Properties Measuring and Testing Instruments, and moreby National Park Service, ENERGY, Department of, Air Force, Internal Revenue Service, and others Signed by year:2000: $0; 2001: $0; 2002: $442,000; 2003: $311,278; 2004: $65,861; 2005: -$52,152; 2006: $4,125.
Biggest contracts:
$369,000 with National Park Service for Maintenance, Repair or Alteration of Real Property -- Highways, Roads, Streets, Bridges, and Railways (includes resurfacing). Signed on 2002-08-15. Completion date: 2003-02-15.
$331,887 with ENERGY, Department of for Transformers: Distribution and Power Station. Signed on 2003-09-15. Completion date: 2004-03-15.
$73,000 with National Park Service for Maintenance, Repair or Alteration of Real Property -- Other Non-Building Facilities. Taking place in ND. Signed on 2002-09-15. Completion date: 2002-11-15.
$69,836 with National Park Service for Maintenance, Repair or Alteration of Real Property -- Highways, Roads, Streets, Bridges, and Railways (includes resurfacing). Signed on 2003-06-15. Completion date: 2003-02-15.
MWH AMERICAS, INC (250 N MADISON AVE in PASADENA, CA)
$245,432 with Air Force for Other Education and Training Services. Signed on 2001-08-10. Completion date: 2002-08-07.
OPERATIONAL CONSUTLING INTERN (599 E COLO BLVD ST 304 in PASADENA, CA; small business) 2 employees, $130000 revenue: $238,666 in 3 contractsfrom 2003 to 2005
$128,000 with Federal Bureau of Investigation for Psychiatry Services. Signed on 2004-05-28. Completion date: 2005-06-30.
$78,000, same as above.Signed on 2003-06-15. Completion date: 2004-06-15.
$32,666, same as above.Signed on 2005-05-31. Completion date: 2006-06-30.
JO-ELLAN DIMITRIUS (201 S. LAKE AVENUE in PASADANA, CA) : $115,000 in 2 contractsin 2004
$65,000 with Offices, Boards and Divisions (includes Attorney General, Deputy Attorney General, etc.) for Legal Services. Signed on 2004-09-09. Completion date: 2005-12-31.
$50,000 with Offices, Boards and Divisions (includes Attorney General, Deputy Attorney General, etc.) for Legal Services. Taking place in DC. Signed on 2004-10-30. Completion date: 2005-12-30.
MWH AMERICAS, INC (301 N LAKE AVE in PASADENA, CA)
$64,800 with Army for Architect - Engineer Services (including landscaping, interior layout, and designing). Signed on 2004-03-18. Completion date: 2004-04-30.
MWH SOFT, INC (300 N LAKE AVE in PASADENA, CA; small business) : $42,075 in 5 contractsfrom 2003 to 2005
Contracts for ADP Software, ADP Components, ADP Input/Output and Storage Devices by Public Health Service, Navy, Army, U.S. Army Corps of Engineers - civil program financing only, and others Signed by year:2000: $0; 2001: $0; 2002: $0; 2003: $2,015; 2004: $6,020; 2005: $34,040; 2006: $0.
Biggest contracts:
$17,000 with Public Health Service for ADP Software. Taking place in AZ. Signed on 2005-04-06. Completion date: 2005-09-30.
$9,025 with Navy for ADP Components. Signed on 2005-07-21. Completion date: 2005-08-12.
$8,015 with Navy for ADP Input/Output and Storage Devices. Signed on 2005-11-01. Completion date: 2006-07-25.
$6,020 with Army for ADP Software. Taking place in AK. Signed on 2004-09-24. Completion date: 2004-10-08.
Top industries in this zip code by the number of employees in 2005:
Administrative and Support and Waste Management and Remediation Services: Temporary Help Services (250-499: 1, 100-249: 5, 50-99: 4, 20-49: 4, 10-19: 1, 1-4: 3)
Finance and Insurance: Real Estate Credit (500-999: 1, 100-249: 2, 50-99: 2, 20-49: 2, 10-19: 4, 5-9: 3, 1-4: 17)
Professional, Scientific, and Technical Services: Offices of Lawyers (50-99: 1, 20-49: 8, 10-19: 14, 5-9: 43, 1-4: 191)
2005 - 2018 National Fire Incident Reporting System (NFIRS) incidents
Based on the data from the years 2005 - 2018 the average number of fires per year is 70. The highest number of reported fire incidents - 125 took place in 2005, and the least - 45 in 2018. The data has a dropping trend.
When looking into fire subcategories, the most incidents belonged to: Structure Fires (53.8%), and Mobile Property/Vehicle Fires (20.5%).
Fire incident types reported to NFIRS in Zip Code 91101


 Nearest zip codes: 91106, 91104, 91105, 91103, 91108, 91030.
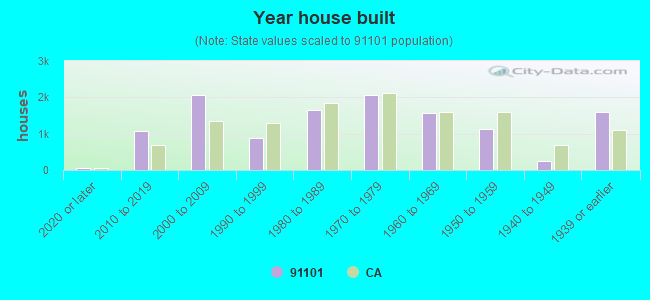


 Based on the data from the years 2005 - 2018 the average number of fires per year is 70. The highest number of reported fire incidents - 125 took place in 2005, and the least - 45 in 2018. The data has a dropping trend.
 When looking into fire subcategories, the most incidents belonged to: Structure Fires (53.8%), and Mobile Property/Vehicle Fires (20.5%).