Estimated zip code population in 2022: 35,619 Zip code population in 2010: 36,751 Zip code population in 2000: 38,449
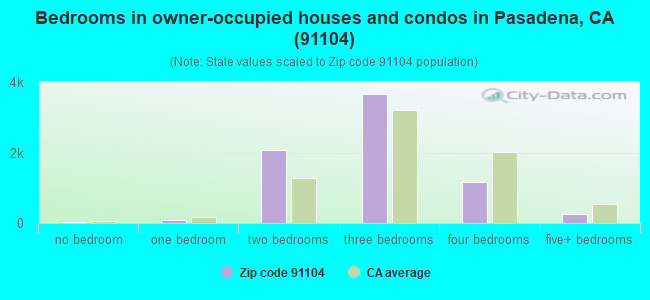
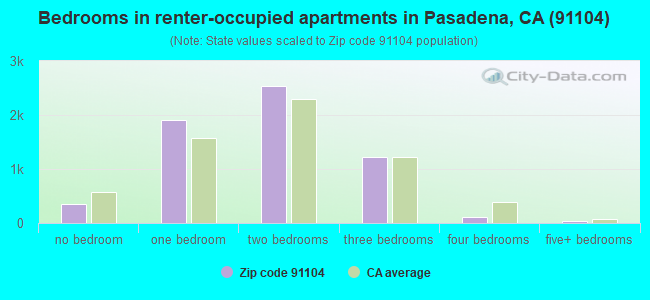
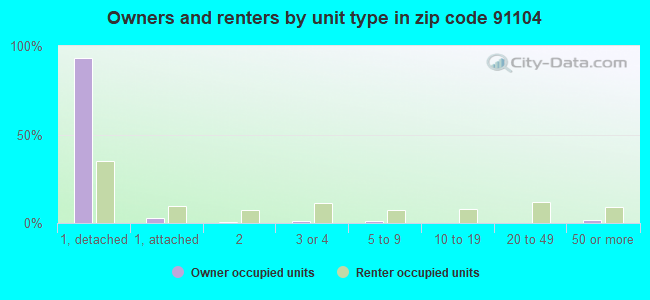
Houses and condos: 14,362 Renter-occupied apartments: 6,178
% of renters here:
46%
State:
44%
March 2022 cost of living index in zip code 91104: 138.7 (high, U.S. average is 100)
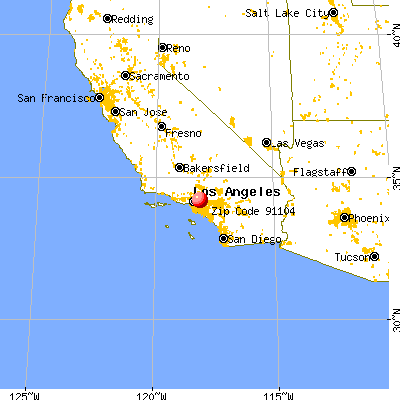
Land area: 3.8 sq. mi. Water area: 0.0 sq. mi.
Population density: 9,366 people per square mile
(high).
OSM Map
General Map
Google Map
MSN Map
OSM Map
General Map
Google Map
MSN Map
OSM Map
General Map
Google Map
MSN Map
OSM Map
General Map
Google Map
MSN Map
Please wait while loading the map...
Real estate property taxes paid for housing units in 2022:
This zip code:
0.5% ($5,390)
California:
0.7% ($4,831)
Median real estate property taxes paid for housing units with mortgages in 2022: $6,410 (0.6%) Median real estate property taxes paid for housing units with no mortgage in 2022: $3,580 (0.4%)
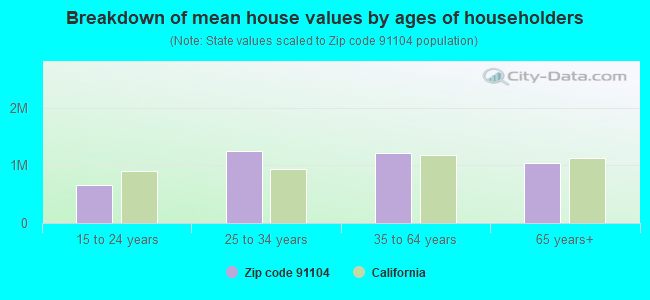
Estimated median house/condo value in 2022: $1,037,420
91104:
$1,037,420
California:
$715,900
According to our research of California and other state lists, there were 22 registered sex offenders living in 91104 zip code as of April 27, 2024. The ratio of all residents to sex offenders in zip code 91104 is 1,785 to 1. The ratio of registered sex offenders to all residents in this zip code is lower than the state average.
Median resident age:
This zip code:
41.9 years
California median age:
37.9 years
Average household size:
This zip code:
2.6 people
California:
2.8 people
Averages for the 2020 tax year for zip code 91104, filed in 2021:
Average Adjusted Gross Income (AGI) in 2020: $86,400 (Individual Income Tax Returns)
Here:
$86,400
State:
$95,910
Salary/wage: $77,796 (reported on 79.4% of returns)
Here:
$77,796
State:
$77,331
(% of AGI for various income ranges: 1222.3% for AGIs below $25k, 3980.8% for AGIs $25k-50k, 7407.6% for AGIs $50k-75k, 11110.5% for AGIs $75k-100k, 20905.2% for AGIs $100k-200k, 84266.4% for AGIs over 200k)
Taxable interest for individuals: $1,265 (reported on 38.3% of returns)
This zip code:
$1,265
California:
$2,294
(% of AGI for various income ranges: 17.7% for AGIs below $25k, 23.7% for AGIs $25k-50k, 49.5% for AGIs $50k-75k, 82.5% for AGIs $75k-100k, 163.8% for AGIs $100k-200k, 686.8% for AGIs over 200k)
Ordinary dividends: $6,436 (reported on 23.3% of returns)
Here:
$6,436
State:
$10,949
(% of AGI for various income ranges: 29.2% for AGIs below $25k, 42.9% for AGIs $25k-50k, 138.5% for AGIs $50k-75k, 229.7% for AGIs $75k-100k, 423.2% for AGIs $100k-200k, 2754.2% for AGIs over 200k)
Net capital gain/loss in AGI: +$16,929 (reported on 22.5% of returns)
Here:
+$16,929
State:
+$49,306
(% of AGI for various income ranges: 16.1% for AGIs below $25k, 37.1% for AGIs $25k-50k, 111.6% for AGIs $50k-75k, 278.7% for AGIs $75k-100k, 570.1% for AGIs $100k-200k, 10300.8% for AGIs over 200k)
Profit/loss from business: +$13,275 (reported on 24.2% of returns)
Here:
+$13,275
State:
+$15,671
(% of AGI for various income ranges: 260.9% for AGIs below $25k, 287.1% for AGIs $25k-50k, 375.5% for AGIs $50k-75k, 540.6% for AGIs $75k-100k, 1080.5% for AGIs $100k-200k, 2933.2% for AGIs over 200k)
Taxable individual retirement arrangement distribution: $20,113 (reported on 6.7% of returns)
91104:
$20,113
California:
$23,505
(% of AGI for various income ranges: 39.5% for AGIs below $25k, 78.8% for AGIs $25k-50k, 172.5% for AGIs $50k-75k, 380.7% for AGIs $75k-100k, 623.1% for AGIs $100k-200k, 1072.0% for AGIs over 200k)
Self-employed (Keogh) retirement plans: $25,610 (reported on 1.2% of returns)
91104:
$25,610
California:
$30,163
(% of AGI for various income ranges: 12.6% for AGIs $25k-50k, 29.7% for AGIs $75k-100k, 55.9% for AGIs $100k-200k, 804.0% for AGIs over 200k)
Total itemized deductions: $34,279 (reported on 20.3% of returns)
Here:
$34,279
State:
$39,517
(% of AGI for various income ranges: 139.6% for AGIs below $25k, 279.3% for AGIs $25k-50k, 669.6% for AGIs $50k-75k, 1408.3% for AGIs $75k-100k, 2841.7% for AGIs $100k-200k, 9242.4% for AGIs over 200k)
Charity contributions: $6,780 (reported on 17.6% of returns)
Here:
$6,780
State:
$12,598
(% of AGI for various income ranges: 6.5% for AGIs below $25k, 28.0% for AGIs $25k-50k, 87.2% for AGIs $50k-75k, 175.3% for AGIs $75k-100k, 403.8% for AGIs $100k-200k, 2214.8% for AGIs over 200k)
Taxes paid: $9,014 (reported on 20.3% of returns)
91104:
$9,014
State:
$8,807
(% of AGI for various income ranges: 24.8% for AGIs below $25k, 53.9% for AGIs $25k-50k, 163.4% for AGIs $50k-75k, 395.9% for AGIs $75k-100k, 846.6% for AGIs $100k-200k, 2297.2% for AGIs over 200k)
Earned income credit: $1,841 (reported on 12.3% of returns)
Here:
$1,841
State:
$2,074
(% of AGI for various income ranges: 79.2% for AGIs below $25k, 59.8% for AGIs $25k-50k)
Percentage of individuals using paid preparers for their 2020 taxes: 91.8%
Here:
92%
State:
92%
(% for various income ranges: 89.0% for AGIs below $25k, 91.9% for AGIs $25k-50k, 92.0% for AGIs $50k-75k, 92.9% for AGIs $75k-100k, 93.9% for AGIs $100k-200k, 94.7% for AGIs over 200k)
Averages for the 2012 tax year for zip code 91104, filed in 2013:
Average Adjusted Gross Income (AGI) in 2012: $64,093 (Individual Income Tax Returns)
Here:
$64,093
State:
$72,726
Salary/wage: $59,089 (reported on 83.5% of returns)
Here:
$59,089
State:
$59,079
(% of AGI for various income ranges: 73.8% for AGIs below $25k, 81.4% for AGIs $25k-50k, 78.9% for AGIs $50k-75k, 77.3% for AGIs $75k-100k, 80.7% for AGIs $100k-200k, 70.2% for AGIs over 200k)
Taxable interest for individuals: $1,007 (reported on 36.1% of returns)
This zip code:
$1,007
California:
$2,146
(% of AGI for various income ranges: 0.7% for AGIs below $25k, 0.6% for AGIs $25k-50k, 0.5% for AGIs $50k-75k, 0.5% for AGIs $75k-100k, 0.5% for AGIs $100k-200k, 0.7% for AGIs over 200k)
Ordinary dividends: $4,131 (reported on 18.9% of returns)
Here:
$4,131
State:
$9,308
(% of AGI for various income ranges: 1.2% for AGIs below $25k, 0.9% for AGIs $25k-50k, 1.1% for AGIs $50k-75k, 1.3% for AGIs $75k-100k, 1.1% for AGIs $100k-200k, 1.5% for AGIs over 200k)
Net capital gain/loss in AGI: +$8,588 (reported on 15.9% of returns)
Here:
+$8,588
State:
+$30,460
(% of AGI for various income ranges: 0.3% for AGIs $50k-75k, 0.4% for AGIs $75k-100k, 0.9% for AGIs $100k-200k, 6.9% for AGIs over 200k)
Profit/loss from business: +$13,945 (reported on 23.4% of returns)
Here:
+$13,945
State:
+$17,064
(% of AGI for various income ranges: 15.6% for AGIs below $25k, 5.4% for AGIs $25k-50k, 4.0% for AGIs $50k-75k, 4.2% for AGIs $75k-100k, 4.1% for AGIs $100k-200k, 4.0% for AGIs over 200k)
Taxable individual retirement arrangement distribution: $15,250 (reported on 7.0% of returns)
91104:
$15,250
California:
$19,557
(% of AGI for various income ranges: 1.8% for AGIs below $25k, 2.0% for AGIs $25k-50k, 1.8% for AGIs $50k-75k, 2.1% for AGIs $75k-100k, 1.6% for AGIs $100k-200k, 1.3% for AGIs over 200k)
Self-employment retirement plans: $18,335 (reported on 1.2% of returns)
91104:
$18,335
California:
$24,530
(% of AGI for various income ranges: 0.2% for AGIs $25k-50k, 0.2% for AGIs $75k-100k, 0.3% for AGIs $100k-200k, 0.8% for AGIs over 200k)
Total itemized deductions: $29,855 (25% of AGI, reported on 39.1% of returns)
Here:
$29,855
State:
$34,004
Here:
25.2% of AGI
State:
22.7% of AGI
(% of AGI for various income ranges: 10.3% for AGIs below $25k, 13.0% for AGIs $25k-50k, 18.1% for AGIs $50k-75k, 19.9% for AGIs $75k-100k, 21.5% for AGIs $100k-200k, 18.4% for AGIs over 200k)
Charity contributions: $3,542 (reported on 33.6% of returns)
Here:
$3,542
State:
$4,659
(% of AGI for various income ranges: 0.7% for AGIs below $25k, 1.2% for AGIs $25k-50k, 1.8% for AGIs $50k-75k, 2.2% for AGIs $75k-100k, 2.2% for AGIs $100k-200k, 2.0% for AGIs over 200k)
Taxes paid: $11,178 (reported on 38.9% of returns)
91104:
$11,178
State:
$14,448
(% of AGI for various income ranges: 2.0% for AGIs below $25k, 2.7% for AGIs $25k-50k, 4.8% for AGIs $50k-75k, 6.5% for AGIs $75k-100k, 8.4% for AGIs $100k-200k, 9.3% for AGIs over 200k)
Earned income credit: $2,178 (reported on 18.3% of returns)
Here:
$2,178
State:
$2,286
(% of AGI for various income ranges: 6.7% for AGIs below $25k, 1.0% for AGIs $25k-50k)
Percentage of individuals using paid preparers for their 2012 taxes: 66.6%
Here:
67%
State:
64%
(% for various income ranges: 64.4% for AGIs below $25k, 67.2% for AGIs $25k-50k, 67.9% for AGIs $50k-75k, 67.2% for AGIs $75k-100k, 67.7% for AGIs $100k-200k, 72.5% for AGIs over 200k)
Averages for the 2004 tax year for zip code 91104, filed in 2005:
Average Adjusted Gross Income (AGI) in 2004: $50,370 (Individual Income Tax Returns)
Here:
$50,370
State:
$58,600
Salary/wage: $47,906 (reported on 85.0% of returns)
Here:
$47,906
State:
$49,455
(% of AGI for various income ranges: 114.1% for AGIs below $10k, 79.2% for AGIs $10k-25k, 84.7% for AGIs $25k-50k, 83.5% for AGIs $50k-75k, 84.7% for AGIs $75k-100k, 76.7% for AGIs over 100k)
Taxable interest for individuals: $1,139 (reported on 43.6% of returns)
This zip code:
$1,139
California:
$2,365
(% of AGI for various income ranges: 4.2% for AGIs below $10k, 1.2% for AGIs $10k-25k, 1.0% for AGIs $25k-50k, 1.0% for AGIs $50k-75k, 0.8% for AGIs $75k-100k, 0.9% for AGIs over 100k)
Taxable dividends: $2,985 (reported on 21.3% of returns)
Here:
$2,985
State:
$4,746
(% of AGI for various income ranges: 3.7% for AGIs below $10k, 0.9% for AGIs $10k-25k, 0.8% for AGIs $25k-50k, 0.9% for AGIs $50k-75k, 0.7% for AGIs $75k-100k, 1.7% for AGIs over 100k)
Net capital gain/loss: +$10,230 (reported on 17.1% of returns)
Here:
+$10,230
State:
+$23,418
(% of AGI for various income ranges: -3.0% for AGIs below $10k, -0.3% for AGIs $10k-25k, 0.4% for AGIs $25k-50k, 0.7% for AGIs $50k-75k, 1.0% for AGIs $75k-100k, 7.4% for AGIs over 100k)
Profit/loss from business: +$12,498 (reported on 21.5% of returns)
Here:
+$12,498
State:
+$16,826
(% of AGI for various income ranges: 20.5% for AGIs below $10k, 9.9% for AGIs $10k-25k, 5.4% for AGIs $25k-50k, 4.1% for AGIs $50k-75k, 4.4% for AGIs $75k-100k, 4.7% for AGIs over 100k)
IRA payment deduction: $2,954 (reported on 2.9% of returns)
91104:
$2,954
California:
$3,192
(% of AGI for various income ranges: 0.3% for AGIs below $10k, 0.2% for AGIs $10k-25k, 0.3% for AGIs $25k-50k, 0.2% for AGIs $50k-75k, 0.2% for AGIs $75k-100k, 0.1% for AGIs over 100k)
Self-employed pension: $12,769 (reported on 1.4% of returns)
Here:
$12,769
California:
$17,688
(% of AGI for various income ranges: 0.1% for AGIs $10k-25k, 0.1% for AGIs $25k-50k, 0.2% for AGIs $50k-75k, 0.3% for AGIs $75k-100k, 0.6% for AGIs over 100k)
Total itemized deductions: $24,959 (27% of AGI, reported on 40.4% of returns)
Here:
$24,959
State:
$28,113
Here:
27.4% of AGI
State:
25.3% of AGI
(% of AGI for various income ranges: 19.2% for AGIs below $10k, 11.4% for AGIs $10k-25k, 16.5% for AGIs $25k-50k, 22.8% for AGIs $50k-75k, 24.1% for AGIs $75k-100k, 20.8% for AGIs over 100k)
Charity contributions deductions: $3,268 (3% of AGI, reported on 36.5% of returns)
Here:
$3,268
State:
$3,923
Here:
3.5% of AGI
State:
3.3% of AGI
(% of AGI for various income ranges: 1.2% for AGIs below $10k, 1.0% for AGIs $10k-25k, 1.8% for AGIs $25k-50k, 2.8% for AGIs $50k-75k, 2.8% for AGIs $75k-100k, 2.6% for AGIs over 100k)
Total tax: $7,887 (reported on 75.7% of returns)
91104:
$7,887
State:
$10,761
(% of AGI for various income ranges: 5.9% for AGIs below $10k, 4.4% for AGIs $10k-25k, 6.9% for AGIs $25k-50k, 9.3% for AGIs $50k-75k, 10.6% for AGIs $75k-100k, 16.7% for AGIs over 100k)
Earned income credit: $1,792 (reported on 17.4% of returns)
Here:
$1,792
State:
$1,763
Percentage of individuals using paid preparers for their 2004 taxes: 67.0%
Here:
67%
State:
66%
(% for various income ranges: 59.7% for AGIs below $10k, 69.8% for AGIs $10k-25k, 68.0% for AGIs $25k-50k, 68.3% for AGIs $50k-75k, 65.5% for AGIs $75k-100k, 69.0% for AGIs over 100k)
Likely homosexual households (counted as self-reported same-sex unmarried-partner households)
Lesbian couples: 0.3% of all households
Gay men: 0.4% of all households
Household received Food Stamps/SNAP in the past 12 months: 1,479 Household did not receive Food Stamps/SNAP in the past 12 months: 11,963
Women who had a birth in the past 12 months: 227 (198 now married, 28 unmarried) Women who did not have a birth in the past 12 months: 7,988 (2,962 now married, 5,034 unmarried)
Housing units in zip code 91104 with a mortgage: 5,287 (589 second mortgage, 3 home equity loan, 494 both second mortgage and home equity loan) Houses without a mortgage: 123
Median monthly owner costs for units with a mortgage: $3,208 Median monthly owner costs for units without a mortgage: $745
Residents with income below the poverty level in 2022:
This zip code:
12.2%
Whole state:
12.2%
Residents with income below 50% of the poverty level in 2022:
This zip code:
6.1%
Whole state:
6.2%
Median number of rooms in houses and condos:
Here:
5.9
State:
6.0
Median number of rooms in apartments:
Here:
3.9
State:
3.9
Notable locations in this zip code not listed on our city pages
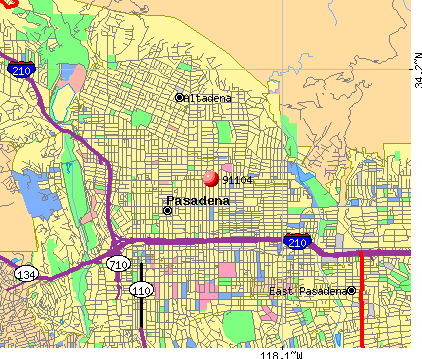
Notable locations in zip code 91104: Santa Catalina Branch Pasedena Public Library (A), United States Forest Service Headquarters (B). Display/hide their locations on the map
Churches in zip code 91104 include: Armenian Church of the Nazarene (A), Mount Olive Lutheran Church (B), Pasadena Christian Church (C), Pasadena Mennonite Church (D), Victory Bible Church of Pasadena (E), Armenian Evangelical Brethren Church (F), First Southern Baptist Church of Pasadena (G), Latin American Methodist Church (H), Morning Star Baptist Church (I). Display/hide their locations on the map
4,061 married couples with children.
1,733 single-parent households (541 men, 1,192 women).
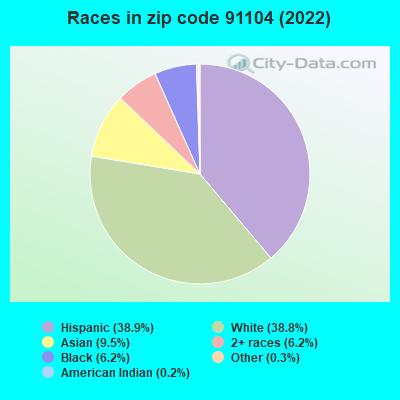
52.1% of residents of 91104 zip code speak English at home.
30.2% of residents speak Spanish at home (60% very well, 16% well, 20% not well, 5% not at all).
9.9% of residents speak other Indo-European language at home (56% very well, 19% well, 23% not well, 2% not at all).
5.9% of residents speak Asian or Pacific Island language at home (67% very well, 27% well, 5% not well, 1% not at all).
2.0% of residents speak other language at home (84% very well, 2% well, 14% not well).
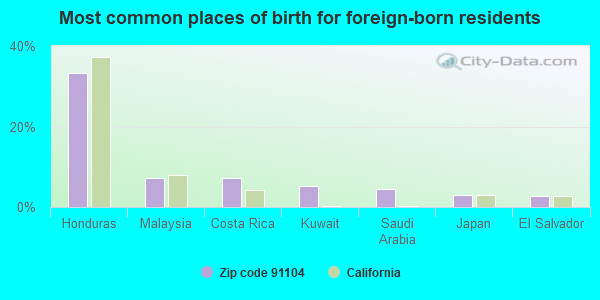
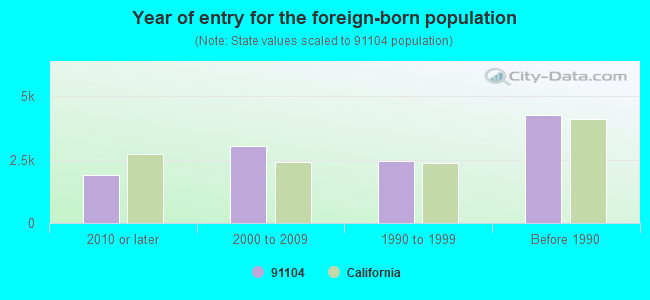
Foreign born population: 11,265 (31.6%) (57.3% of them are naturalized citizens)
Major facilities with environmental interests located in this zip code:
MADISON ELEMENTARY SCHOOL (515 ASHTABULA ST in PASADENA, CA)
STATE MASTER (California - Hazardous Waste Tracking) - HAZARDOU WASTE PROGRAM (National Center for Education Statistics) - STATE ID-6021687 Organizations: PASADENA UNIFIED (SCHOOL DISTRICT)
LONGFELLOW ELEMENTARY SCHOOL (1065 E WASHINGTON BLVD in PASADENA, CA)
(National Center for Education Statistics) - STATE ID-6021679 Small Quantity Generators, between 100 kg and 1000 kg of hazardous waste/month (Resource Conservation and Recovery Act (tracking hazardous waste)) - notification TRANSPORTER (Resource Conservation and Recovery Act (tracking hazardous waste)) - notification Organizations: PASADENA UNIFIED SCHOOL DIST (CONTACT/OWNER)
, PASADENA UNIFIED (SCHOOL DISTRICT)
MIRACLE CLEANERS (1277 N LAKE in PASADENA, CA)
STATE MASTER (California - Hazardous Waste Tracking) - HAZARDOU WASTE PROGRAM Small Quantity Generators, between 100 kg and 1000 kg of hazardous waste/month (Resource Conservation and Recovery Act (tracking hazardous waste)) - notification Organizations: AVEDIS MARKARIAN (CONTACT/OWNER)
NEW METHOD TERMITE CONTROL INC (787 E WASHINGTON BLVD in PASADENA, CA)
STATE MASTER (California - Hazardous Waste Tracking) - HAZARDOU WASTE PROGRAM Small Quantity Generators, between 100 kg and 1000 kg of hazardous waste/month (Resource Conservation and Recovery Act (tracking hazardous waste)) - notification Organizations: NEW METHOD TERMITE INC (CONTACT/OWNER)
JACKS CLEANERS (2465 E WASHINGTON in PASADENA, CA)
STATE MASTER (California - Hazardous Waste Tracking) - HAZARDOU WASTE PROGRAM Small Quantity Generators, between 100 kg and 1000 kg of hazardous waste/month (Resource Conservation and Recovery Act (tracking hazardous waste))
MARTINS TRUCKING (2130 E WASHINGTON BLVD in PASADENA, CA)
STATE MASTER (California - Hazardous Waste Tracking) - HAZARDOU WASTE PROGRAM TRANSPORTER (Resource Conservation and Recovery Act (tracking hazardous waste)) Organizations: MARTIROS KOSTIKYAN (CONTACT/OWNER)
MARSHALL FUNDAMENTAL (990 N. ALLEN AVE. in PASADENA, CA)
(National Center for Education Statistics) - STATE ID-1931674 Organizations: PASADENA UNIFIED (SCHOOL DISTRICT)
NEW ALLIED AUTO DISMANTLING (1090 WESLEY AVENUE in PASADENA, CA)
(Integrated Compliance Information System) - ICIS-09-2002-0085, FORMAL ENFORCEMENT ACTION Business SIC classification: MOTOR VEHICLE PARTS, USED
1 HOUR PHOTO MART (1287 N LAKE AVE in PASADENA, CA)
Small Quantity Generators, between 100 kg and 1000 kg of hazardous waste/month (Resource Conservation and Recovery Act (tracking hazardous waste)) - notification Organizations: SE YOUNG KIM (CONTACT/OWNER)
99 CLEANERS (708 N LAKE AVE in PASADENA, CA)
Small Quantity Generators, between 100 kg and 1000 kg of hazardous waste/month (Resource Conservation and Recovery Act (tracking hazardous waste)) - notification Organizations: CAM PHAM (CONTACT/OWNER)
ANGELO S FICHERA (1759 E MOUNTAIN ST in PASADENA, CA)
TRANSPORTER (Resource Conservation and Recovery Act (tracking hazardous waste))
ENTERPRISE CLEANERS (316 E ORANGEGROVE in PASADENA, CA)
Small Quantity Generators, between 100 kg and 1000 kg of hazardous waste/month (Resource Conservation and Recovery Act (tracking hazardous waste)) Organizations: ALBERT C MOOREFEELD (CONTACT/OWNER)
HILLCREST AUTOMOTIVE (1899 WASHINGTON BLVD in PASADENA, CA)
Small Quantity Generators, between 100 kg and 1000 kg of hazardous waste/month (Resource Conservation and Recovery Act (tracking hazardous waste)) - notification Business NAICS classification: ALL OTHER AUTOMOTIVE REPAIR AND MAINTENANCE. Organizations: STEVEN MILICIC (CONTACT/OWNER)
Housing units lacking complete plumbing facilities: 0.5% Housing units lacking complete kitchen facilities: 2.7%
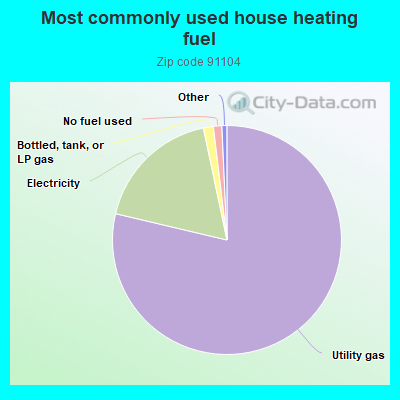
78.7%Utility gas
18.0%Electricity
1.4%Bottled, tank, or LP gas
1.2%No fuel used
Population in 1990: 37,973. Population change in the 1990s: +476 (+1.3%).
Place of birth for U.S.-born residents:
This state: 18,359
Northeast: 1,540
Midwest: 1,418
South: 1,717
West: 811
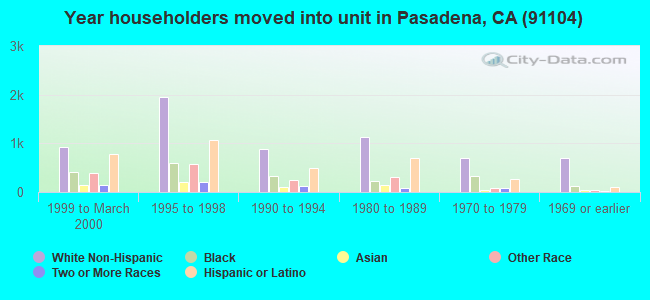
57% of the 91104 zip code residents lived in the same house 5 years ago. Out of people who lived in different houses, 84% lived in this county. Out of people who lived in different counties, 50% lived in California.
93% of the 91104 zip code residents lived in the same house 1 year ago. Out of people who lived in different houses, 80% moved from this county. Out of people who lived in different houses, 7% moved from different county within same state. Out of people who lived in different houses, 9% moved from different state. Out of people who lived in different houses, 5% moved from abroad.
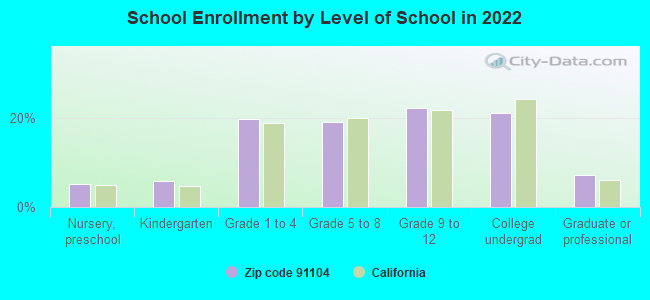
Private vs. public school enrollment:
Students in private schools in grades 1 to 8 (elementary and middle school): 730
Here:
23.3%
California:
10.5%
Students in private schools in grades 9 to 12 (high school): 486
Here:
27.3%
California:
8.5%
Students in private undergraduate colleges: 229
Here:
13.6%
California:
15.9%
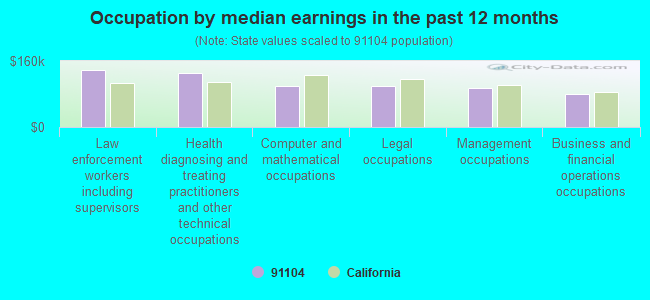
Occupation by median earnings in the past 12 months ($)
139,004Law enforcement workers including supervisors
131,911Health diagnosing and treating practitioners and other technical occupations
100,593Computer and mathematical occupations
99,588Legal occupations
93,385Management occupations
79,735Business and financial operations occupations
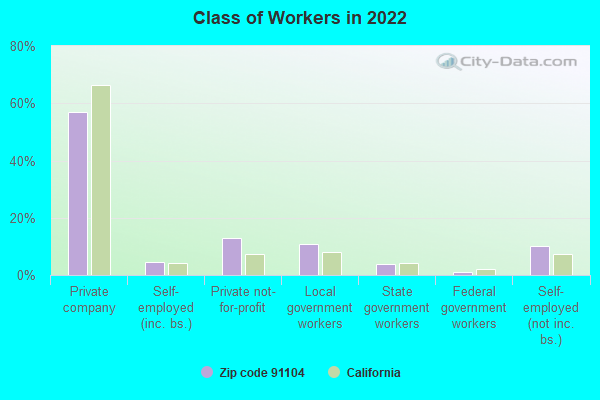
Companies with federal contracts located in this zip code:
SYSTEMS MANAGEMENT, INC (1635 N LAKE AVE in PASADENA, CA; small business) : $41,596 in 5 contractsfrom 2003 to 2005
Contracts for Custodial Janitorial Services, Landscaping/Groundskeeping Services by Army, U.S. Army Corps of Engineers - civil program financing only Signed by year:2000: $0; 2001: $0; 2002: $0; 2003: $42,186; 2004: $0; 2005: -$590; 2006: $0.
Biggest contracts:
$14,163 with Army for Custodial Janitorial Services. Signed on 2003-11-05. Completion date: 2004-09-23.
$14,163 with U.S. Army Corps of Engineers - civil program financing only for Custodial Janitorial Services. Signed on 2003-11-05. Completion date: 2004-09-23.
$6,930 with Army for Landscaping/Groundskeeping Services. Signed on 2003-11-03. Completion date: 2004-09-25.
$6,930 with U.S. Army Corps of Engineers - civil program financing only for Landscaping/Groundskeeping Services. Signed on 2003-11-03. Completion date: 2004-09-25.
JEWELGEMS BY JAY ODAY INCORPORATED (787 E WASHINGTON BLVD STE 5 in PASADENA, CA; small business) 4 employees, $600000 revenue. : $16,635 in 3 contractsfrom 2005 to 2006
$8,230 with Bureau of Prisoners/Federal Prison System for Games, Toys and Wheeled Goods. Signed on 2006-09-18. Completion date: 2006-10-30.
$4,857, same as above.Signed on 2005-07-27. Completion date: 2005-08-16.
$3,548 with Bureau of Prisoners/Federal Prison System for . Signed on 2006-08-11. Completion date: 2006-09-30.
Top industries in this zip code by the number of employees in 2005:
Other Services (except Public Administration): Religious Organizations (100-249 employees: 2 establishments, 20-49 employees: 2 establishments, 10-19 employees: 3 establishments, 5-9 employees: 6 establishments, 1-4 employees: 17 establishments)
2005 - 2018 National Fire Incident Reporting System (NFIRS) incidents
Based on the data from the years 2005 - 2018 the average number of fires per year is 29. The highest number of reported fires - 53 took place in 2005, and the least - 15 in 2006. The data has a dropping trend.
When looking into fire subcategories, the most reports belonged to: Structure Fires (49.4%), and Outside Fires (24.8%).
Fire incident types reported to NFIRS in Zip Code 91104


 Nearest zip codes: 91101, 91106, 91001, 91107, 91103, 91108.


 Based on the data from the years 2005 - 2018 the average number of fires per year is 29. The highest number of reported fires - 53 took place in 2005, and the least - 15 in 2006. The data has a dropping trend.
 When looking into fire subcategories, the most reports belonged to: Structure Fires (49.4%), and Outside Fires (24.8%).