Estimated zip code population in 2022: 32,310 Zip code population in 2010: 32,940 Zip code population in 2000: 32,360
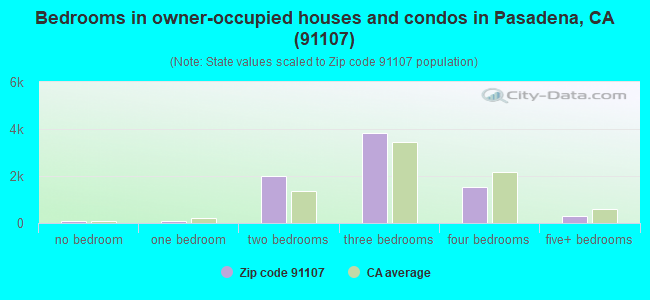
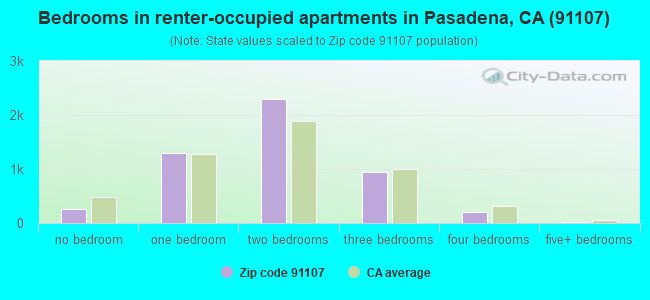
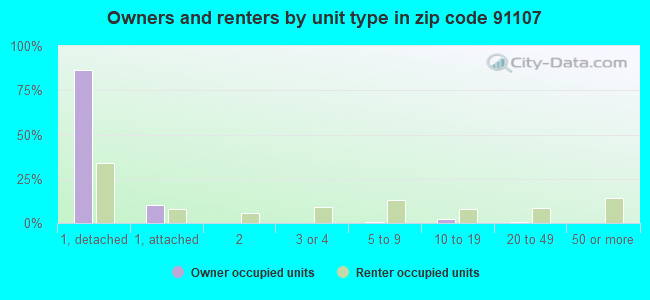
Houses and condos: 13,933 Renter-occupied apartments: 5,047
% of renters here:
39%
State:
44%
March 2022 cost of living index in zip code 91107: 137.1 (high, U.S. average is 100)
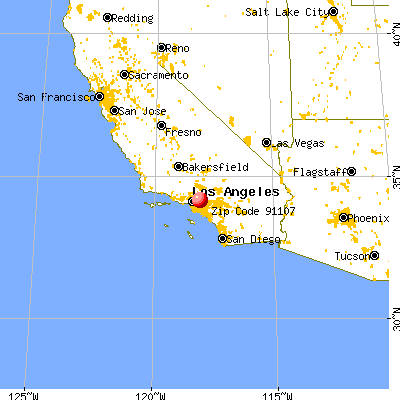
Land area: 8.2 sq. mi. Water area: 0.1 sq. mi.
Population density: 3,925 people per square mile
(average).
OSM Map
General Map
Google Map
MSN Map
OSM Map
General Map
Google Map
MSN Map
OSM Map
General Map
Google Map
MSN Map
OSM Map
General Map
Google Map
MSN Map
Please wait while loading the map...
Real estate property taxes paid for housing units in 2022:
This zip code:
0.6% ($6,958)
California:
0.7% ($4,831)
Median real estate property taxes paid for housing units with mortgages in 2022: $7,700 (0.7%) Median real estate property taxes paid for housing units with no mortgage in 2022: $5,347 (0.5%)
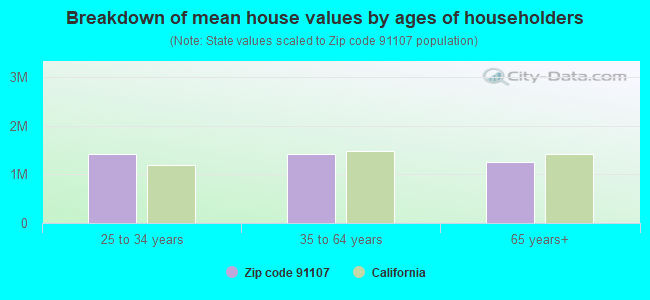
Estimated median house/condo value in 2022: $1,135,038
91107:
$1,135,038
California:
$715,900
According to our research of California and other state lists, there were 20 registered sex offenders living in 91107 zip code as of April 27, 2024. The ratio of all residents to sex offenders in zip code 91107 is 1,624 to 1. The ratio of registered sex offenders to all residents in this zip code is lower than the state average.
Median resident age:
This zip code:
43.5 years
California median age:
37.9 years
Average household size:
This zip code:
2.5 people
California:
2.8 people
Averages for the 2020 tax year for zip code 91107, filed in 2021:
Average Adjusted Gross Income (AGI) in 2020: $122,281 (Individual Income Tax Returns)
Here:
$122,281
State:
$95,910
Salary/wage: $96,229 (reported on 75.9% of returns)
Here:
$96,229
State:
$77,331
(% of AGI for various income ranges: 1213.1% for AGIs below $25k, 4100.7% for AGIs $25k-50k, 7482.6% for AGIs $50k-75k, 10803.7% for AGIs $75k-100k, 20495.9% for AGIs $100k-200k, 97651.1% for AGIs over 200k)
Taxable interest for individuals: $2,857 (reported on 47.4% of returns)
This zip code:
$2,857
California:
$2,294
(% of AGI for various income ranges: 41.1% for AGIs below $25k, 57.7% for AGIs $25k-50k, 110.5% for AGIs $50k-75k, 157.8% for AGIs $75k-100k, 334.4% for AGIs $100k-200k, 2028.1% for AGIs over 200k)
Ordinary dividends: $10,137 (reported on 32.4% of returns)
Here:
$10,137
State:
$10,949
(% of AGI for various income ranges: 62.7% for AGIs below $25k, 89.7% for AGIs $25k-50k, 222.4% for AGIs $50k-75k, 356.2% for AGIs $75k-100k, 682.2% for AGIs $100k-200k, 5682.1% for AGIs over 200k)
Net capital gain/loss in AGI: +$35,810 (reported on 31.2% of returns)
Here:
+$35,810
State:
+$49,306
(% of AGI for various income ranges: 38.0% for AGIs below $25k, 93.8% for AGIs $25k-50k, 211.7% for AGIs $50k-75k, 366.6% for AGIs $75k-100k, 981.7% for AGIs $100k-200k, 26295.1% for AGIs over 200k)
Profit/loss from business: +$20,952 (reported on 22.7% of returns)
Here:
+$20,952
State:
+$15,671
(% of AGI for various income ranges: 251.9% for AGIs below $25k, 330.9% for AGIs $25k-50k, 397.1% for AGIs $50k-75k, 593.3% for AGIs $75k-100k, 930.0% for AGIs $100k-200k, 6812.7% for AGIs over 200k)
Taxable individual retirement arrangement distribution: $27,601 (reported on 9.0% of returns)
91107:
$27,601
California:
$23,505
(% of AGI for various income ranges: 65.5% for AGIs below $25k, 109.4% for AGIs $25k-50k, 188.2% for AGIs $50k-75k, 446.2% for AGIs $75k-100k, 843.2% for AGIs $100k-200k, 2987.6% for AGIs over 200k)
Self-employed (Keogh) retirement plans: $37,243 (reported on 1.6% of returns)
91107:
$37,243
California:
$30,163
(% of AGI for various income ranges: 61.5% for AGIs $50k-75k, 90.8% for AGIs $100k-200k, 1305.9% for AGIs over 200k)
Total itemized deductions: $40,606 (reported on 23.5% of returns)
Here:
$40,606
State:
$39,517
(% of AGI for various income ranges: 192.2% for AGIs below $25k, 331.4% for AGIs $25k-50k, 768.3% for AGIs $50k-75k, 1517.7% for AGIs $75k-100k, 2891.0% for AGIs $100k-200k, 13007.0% for AGIs over 200k)
Charity contributions: $12,601 (reported on 20.0% of returns)
Here:
$12,601
State:
$12,598
(% of AGI for various income ranges: 8.8% for AGIs below $25k, 30.5% for AGIs $25k-50k, 107.5% for AGIs $50k-75k, 211.6% for AGIs $75k-100k, 496.8% for AGIs $100k-200k, 4916.3% for AGIs over 200k)
Taxes paid: $9,081 (reported on 23.4% of returns)
91107:
$9,081
State:
$8,807
(% of AGI for various income ranges: 39.7% for AGIs below $25k, 74.2% for AGIs $25k-50k, 189.9% for AGIs $50k-75k, 403.2% for AGIs $75k-100k, 818.6% for AGIs $100k-200k, 2352.5% for AGIs over 200k)
Earned income credit: $1,470 (reported on 8.3% of returns)
Here:
$1,470
State:
$2,074
(% of AGI for various income ranges: 53.3% for AGIs below $25k, 38.9% for AGIs $25k-50k)
Percentage of individuals using paid preparers for their 2020 taxes: 91.9%
Here:
92%
State:
92%
(% for various income ranges: 90.5% for AGIs below $25k, 91.8% for AGIs $25k-50k, 93.0% for AGIs $50k-75k, 91.6% for AGIs $75k-100k, 92.4% for AGIs $100k-200k, 93.4% for AGIs over 200k)
Averages for the 2012 tax year for zip code 91107, filed in 2013:
Average Adjusted Gross Income (AGI) in 2012: $100,033 (Individual Income Tax Returns)
Here:
$100,033
State:
$72,726
Salary/wage: $80,296 (reported on 78.8% of returns)
Here:
$80,296
State:
$59,079
(% of AGI for various income ranges: 68.5% for AGIs below $25k, 76.2% for AGIs $25k-50k, 76.4% for AGIs $50k-75k, 72.7% for AGIs $75k-100k, 73.9% for AGIs $100k-200k, 51.7% for AGIs over 200k)
Taxable interest for individuals: $2,581 (reported on 47.7% of returns)
This zip code:
$2,581
California:
$2,146
(% of AGI for various income ranges: 1.8% for AGIs below $25k, 1.3% for AGIs $25k-50k, 0.9% for AGIs $50k-75k, 1.0% for AGIs $75k-100k, 0.9% for AGIs $100k-200k, 1.5% for AGIs over 200k)
Ordinary dividends: $9,734 (reported on 29.3% of returns)
Here:
$9,734
State:
$9,308
(% of AGI for various income ranges: 2.6% for AGIs below $25k, 1.9% for AGIs $25k-50k, 1.6% for AGIs $50k-75k, 1.7% for AGIs $75k-100k, 2.1% for AGIs $100k-200k, 3.8% for AGIs over 200k)
Net capital gain/loss in AGI: +$20,866 (reported on 26.1% of returns)
Here:
+$20,866
State:
+$30,460
(% of AGI for various income ranges: 1.5% for AGIs below $25k, 0.2% for AGIs $50k-75k, 0.9% for AGIs $75k-100k, 0.9% for AGIs $100k-200k, 10.7% for AGIs over 200k)
Profit/loss from business: +$19,815 (reported on 21.7% of returns)
Here:
+$19,815
State:
+$17,064
(% of AGI for various income ranges: 14.2% for AGIs below $25k, 6.0% for AGIs $25k-50k, 3.8% for AGIs $50k-75k, 5.3% for AGIs $75k-100k, 4.0% for AGIs $100k-200k, 3.4% for AGIs over 200k)
Taxable individual retirement arrangement distribution: $25,252 (reported on 10.3% of returns)
91107:
$25,252
California:
$19,557
(% of AGI for various income ranges: 3.7% for AGIs below $25k, 2.5% for AGIs $25k-50k, 2.3% for AGIs $50k-75k, 2.6% for AGIs $75k-100k, 3.0% for AGIs $100k-200k, 2.4% for AGIs over 200k)
Self-employment retirement plans: $24,968 (reported on 1.7% of returns)
91107:
$24,968
California:
$24,530
(% of AGI for various income ranges: 0.3% for AGIs $25k-50k, 0.3% for AGIs $75k-100k, 0.4% for AGIs $100k-200k, 0.6% for AGIs over 200k)
Total itemized deductions: $39,666 (23% of AGI, reported on 47.8% of returns)
Here:
$39,666
State:
$34,004
Here:
22.9% of AGI
State:
22.7% of AGI
(% of AGI for various income ranges: 18.0% for AGIs below $25k, 16.2% for AGIs $25k-50k, 17.4% for AGIs $50k-75k, 20.6% for AGIs $75k-100k, 21.7% for AGIs $100k-200k, 18.0% for AGIs over 200k)
Charity contributions: $5,205 (reported on 40.9% of returns)
Here:
$5,205
State:
$4,659
(% of AGI for various income ranges: 1.1% for AGIs below $25k, 1.6% for AGIs $25k-50k, 1.8% for AGIs $50k-75k, 2.4% for AGIs $75k-100k, 2.3% for AGIs $100k-200k, 2.2% for AGIs over 200k)
Taxes paid: $17,772 (reported on 47.7% of returns)
91107:
$17,772
State:
$14,448
(% of AGI for various income ranges: 3.6% for AGIs below $25k, 3.9% for AGIs $25k-50k, 5.2% for AGIs $50k-75k, 7.0% for AGIs $75k-100k, 8.6% for AGIs $100k-200k, 10.3% for AGIs over 200k)
Earned income credit: $1,795 (reported on 11.5% of returns)
Here:
$1,795
State:
$2,286
(% of AGI for various income ranges: 4.3% for AGIs below $25k, 0.7% for AGIs $25k-50k)
Percentage of individuals using paid preparers for their 2012 taxes: 65.0%
Here:
65%
State:
64%
(% for various income ranges: 61.1% for AGIs below $25k, 63.4% for AGIs $25k-50k, 63.4% for AGIs $50k-75k, 66.2% for AGIs $75k-100k, 68.6% for AGIs $100k-200k, 75.0% for AGIs over 200k)
Averages for the 2004 tax year for zip code 91107, filed in 2005:
Average Adjusted Gross Income (AGI) in 2004: $78,132 (Individual Income Tax Returns)
Here:
$78,132
State:
$58,600
Salary/wage: $64,569 (reported on 78.7% of returns)
Here:
$64,569
State:
$49,455
(% of AGI for various income ranges: 69.9% for AGIs $10k-25k, 76.5% for AGIs $25k-50k, 79.1% for AGIs $50k-75k, 76.7% for AGIs $75k-100k, 55.9% for AGIs over 100k)
Taxable interest for individuals: $2,632 (reported on 56.9% of returns)
This zip code:
$2,632
California:
$2,365
(% of AGI for various income ranges: 3.1% for AGIs $10k-25k, 2.0% for AGIs $25k-50k, 1.7% for AGIs $50k-75k, 1.6% for AGIs $75k-100k, 1.6% for AGIs over 100k)
Taxable dividends: $5,680 (reported on 33.0% of returns)
Here:
$5,680
State:
$4,746
(% of AGI for various income ranges: 2.3% for AGIs $10k-25k, 1.8% for AGIs $25k-50k, 1.7% for AGIs $50k-75k, 1.6% for AGIs $75k-100k, 2.6% for AGIs over 100k)
Net capital gain/loss: +$34,713 (reported on 28.6% of returns)
Here:
+$34,713
State:
+$23,418
(% of AGI for various income ranges: -0.1% for AGIs $10k-25k, 0.7% for AGIs $25k-50k, 1.0% for AGIs $50k-75k, 1.6% for AGIs $75k-100k, 18.6% for AGIs over 100k)
Profit/loss from business: +$18,824 (reported on 21.9% of returns)
Here:
+$18,824
State:
+$16,826
(% of AGI for various income ranges: 10.2% for AGIs $10k-25k, 6.6% for AGIs $25k-50k, 4.6% for AGIs $50k-75k, 4.5% for AGIs $75k-100k, 4.8% for AGIs over 100k)
IRA payment deduction: $3,530 (reported on 3.8% of returns)
91107:
$3,530
California:
$3,192
(% of AGI for various income ranges: 0.3% for AGIs $10k-25k, 0.3% for AGIs $25k-50k, 0.3% for AGIs $50k-75k, 0.2% for AGIs $75k-100k, 0.1% for AGIs over 100k)
Self-employed pension: $20,403 (reported on 2.3% of returns)
Here:
$20,403
California:
$17,688
(% of AGI for various income ranges: 0.2% for AGIs $10k-25k, 0.3% for AGIs $25k-50k, 0.2% for AGIs $50k-75k, 0.3% for AGIs $75k-100k, 0.8% for AGIs over 100k)
Total itemized deductions: $33,498 (24% of AGI, reported on 48.0% of returns)
Here:
$33,498
State:
$28,113
Here:
24.3% of AGI
State:
25.3% of AGI
(% of AGI for various income ranges: 16.1% for AGIs $10k-25k, 19.0% for AGIs $25k-50k, 28.1% for AGIs $50k-75k, 23.6% for AGIs $75k-100k, 18.6% for AGIs over 100k)
Charity contributions deductions: $6,077 (4% of AGI, reported on 43.4% of returns)
Here:
$6,077
State:
$3,923
Here:
4.2% of AGI
State:
3.3% of AGI
(% of AGI for various income ranges: 1.6% for AGIs $10k-25k, 2.2% for AGIs $25k-50k, 2.6% for AGIs $50k-75k, 2.6% for AGIs $75k-100k, 3.8% for AGIs over 100k)
Total tax: $15,201 (reported on 81.4% of returns)
91107:
$15,201
State:
$10,761
(% of AGI for various income ranges: 5.1% for AGIs $10k-25k, 7.8% for AGIs $25k-50k, 10.0% for AGIs $50k-75k, 11.0% for AGIs $75k-100k, 19.0% for AGIs over 100k)
Earned income credit: $1,480 (reported on 10.0% of returns)
Here:
$1,480
State:
$1,763
Percentage of individuals using paid preparers for their 2004 taxes: 66.8%
Here:
67%
State:
66%
(% for various income ranges: 60.5% for AGIs below $10k, 67.2% for AGIs $10k-25k, 65.1% for AGIs $25k-50k, 67.0% for AGIs $50k-75k, 69.4% for AGIs $75k-100k, 72.5% for AGIs over 100k)
Likely homosexual households (counted as self-reported same-sex unmarried-partner households)
Lesbian couples: 0.1% of all households
Gay men: 0.1% of all households
Household received Food Stamps/SNAP in the past 12 months: 793 Household did not receive Food Stamps/SNAP in the past 12 months: 11,923
Women who had a birth in the past 12 months: 418 (365 now married, 52 unmarried) Women who did not have a birth in the past 12 months: 6,744 (2,984 now married, 3,746 unmarried)
Housing units in zip code 91107 with a mortgage: 4,908 (664 second mortgage, 15 home equity loan, 638 both second mortgage and home equity loan) Houses without a mortgage: 62
Median monthly owner costs for units with a mortgage: $3,551 Median monthly owner costs for units without a mortgage: $886
Residents with income below the poverty level in 2022:
This zip code:
5.8%
Whole state:
12.2%
Residents with income below 50% of the poverty level in 2022:
This zip code:
2.9%
Whole state:
6.2%
Median number of rooms in houses and condos:
Here:
6.1
State:
6.0
Median number of rooms in apartments:
Here:
4.1
State:
3.9
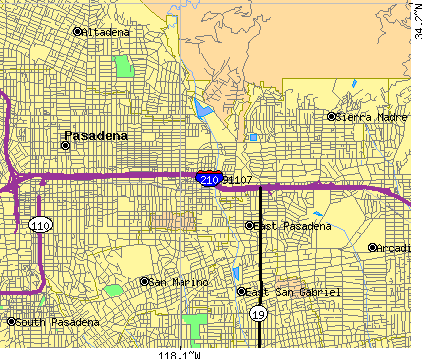
Notable locations in this zip code not listed on our city pages
Notable locations in zip code 91107: Henninger Flats Non-Forest Service Campground (A), Kinneloa Ranch (B), Eaton Substation (C), Eaton Canyon Park Golf Course (D), Lamanda Park Branch Pasadena Public Library (E), Hastings Branch Pasadena Public Library (F), Guardian Ambulance Service (G), Pasadena Fire Department Station 37 (H), Pasadena Fire Department Station 32 (I), Altadena Lodge (J), Los Angeles County Fire Department Station 66 (K). Display/hide their locations on the map
Shopping Centers: El Nido Plaza Shopping Center (1), Hastings Village Shopping Center (2), Hastings Ranch Shopping Center (3), Hastings Ranch Plaza Shopping Center (4). Display/hide their locations on the map
Churches in zip code 91107 include: Apostolic Christian Church (A), Armenian Cilcia Congregational Church (B), Church of Jesus Christ of Latter Day Saints (C), First Church of the Nazarene (D), Foothills Community Church (E), Iglesia Del Nazareno (F), Light of Love Mission Church (G), Pasadena Alliance Church (H), Pasadena Jewish Center (I). Display/hide their locations on the map
Parks in zip code 91107 include: Besse Park (1), Eaton Blanche Park (2), Eaton Canyon Park (3), Hamilton Park (4), Michillinda Park (5), Victory Park (6), Gwinn Park (7), Robert M McCurdy Nature Center (8). Display/hide their locations on the map
4,393 married couples with children.
900 single-parent households (250 men, 650 women).
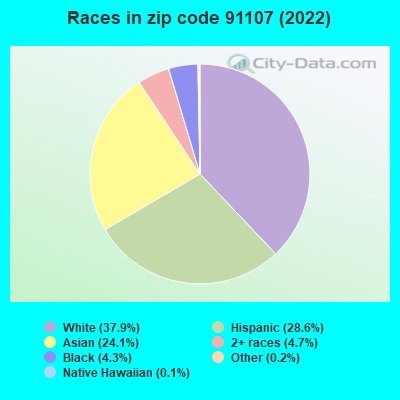
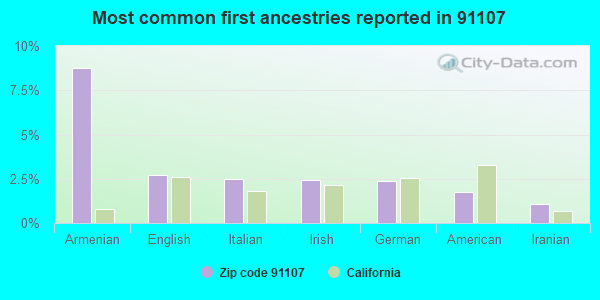
55.6% of residents of 91107 zip code speak English at home.
18.9% of residents speak Spanish at home (67% very well, 14% well, 16% not well, 3% not at all).
8.8% of residents speak other Indo-European language at home (71% very well, 18% well, 12% not well).
15.7% of residents speak Asian or Pacific Island language at home (51% very well, 31% well, 12% not well, 6% not at all).
1.6% of residents speak other language at home (73% very well, 23% well, 4% not well).
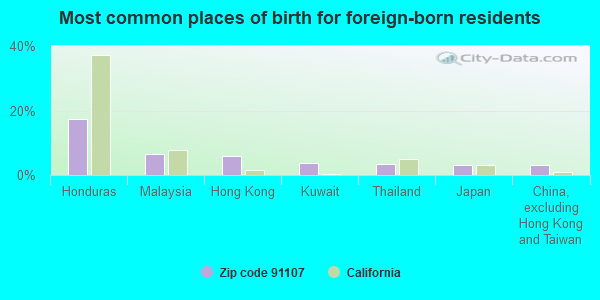
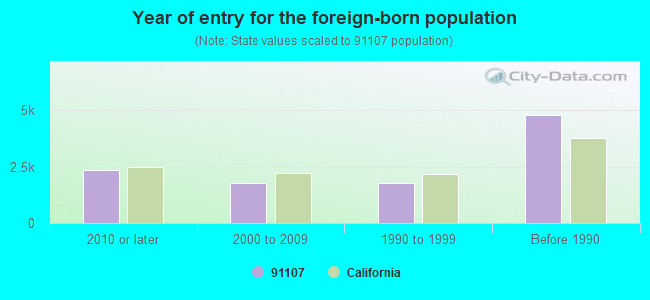
Foreign born population: 10,081 (31.2%) (65.9% of them are naturalized citizens)
Major facilities with environmental interests located in this zip code:
K C PHOTOENGRAVING COMPANY (2666 E. NINA ST. in PASADENA, CA)
STATE MASTER (California - Hazardous Waste Tracking) - HAZARDOU WASTE PROGRAM Small Quantity Generators, between 100 kg and 1000 kg of hazardous waste/month (Resource Conservation and Recovery Act (tracking hazardous waste)) - notification Small Quantity Generators, between 100 kg and 1000 kg of hazardous waste/month (Resource Conservation and Recovery Act (tracking hazardous waste)) - notification TRI REPORTER (Tracking of toxic chemicals releasing facilities) Business SIC classification: PLATEMAKING AND RELATED SERVICES Business NAICS classification: PRINTING MACHINERY AND EQUIPMENT MANUFACTURING. Organizations: K C PHOTO ENGRAVING (CONTACT/OWNER)
Alternative names: K C PHOTO ENGRAVERS
HONDA OF PASADENA (1965 E FOOTHILL BLVD in PASADENA, CA)
STATE MASTER (California - Hazardous Waste Tracking) - HAZARDOU WASTE PROGRAM Large Quantity Generators, more that 1000 kg of hazardous waste/month (Resource Conservation and Recovery Act (tracking hazardous waste)) Alternative names: HOP LLC HONDA OF PASADENA
HAMILTON ELEMENTARY (2089 ROSE VILLA ST. in PASADENA, CA)
(National Center for Education Statistics) - STATE ID-6021612 Small Quantity Generators, between 100 kg and 1000 kg of hazardous waste/month (Resource Conservation and Recovery Act (tracking hazardous waste)) - notification TRANSPORTER (Resource Conservation and Recovery Act (tracking hazardous waste)) - notification Organizations: PASADENA UNIFIED SCHOOL DIST (CONTACT/OWNER)
, PASADENA UNIFIED (SCHOOL DISTRICT)
Alternative names: HAMILTON ELEMENTARY SCHOOL
ADVANCED TECHNOLOGY CO, INC (2858 E WALNUT ST in PASADENA, CA)
STATE MASTER (California - Hazardous Waste Tracking) - HAZARDOU WASTE PROGRAM Small Quantity Generators, between 100 kg and 1000 kg of hazardous waste/month (Resource Conservation and Recovery Act (tracking hazardous waste)) - notification Organizations: JEAN L DESILVESTRI (CONTACT/OWNER)
K AND S MOBIL (1813 E COLORADO BLVD in PASADENA, CA)
STATE MASTER (California - Hazardous Waste Tracking) - HAZARDOU WASTE PROGRAM Small Quantity Generators, between 100 kg and 1000 kg of hazardous waste/month (Resource Conservation and Recovery Act (tracking hazardous waste)) - notification Organizations: MOBIL OIL CORP (CONTACT/OWNER)
HUTCHINS MGF COMPANY INC (49 N LOTUS AVE in PASADENA, CA)
STATE MASTER (California - Hazardous Waste Tracking) - HAZARDOU WASTE PROGRAM Small Quantity Generators, between 100 kg and 1000 kg of hazardous waste/month (Resource Conservation and Recovery Act (tracking hazardous waste)) - notification Organizations: HUTCHINS ALME (CONTACT/OWNER)
HARMONS CLEANER (3575 E FOOTHILL in PASADENA, CA)
STATE MASTER (California - Hazardous Waste Tracking) - HAZARDOU WASTE PROGRAM Small Quantity Generators, between 100 kg and 1000 kg of hazardous waste/month (Resource Conservation and Recovery Act (tracking hazardous waste))
MATERIA INC (2531 NINA ST in PASADENA, CA)
STATE MASTER (California - Hazardous Waste Tracking) - HAZARDOU WASTE PROGRAM Small Quantity Generators, between 100 kg and 1000 kg of hazardous waste/month (Resource Conservation and Recovery Act (tracking hazardous waste)) - notification
CHEVRON STATION NO 97762 (233 N ALTADENA DR in PASADENA, CA)
STATE MASTER (California - Hazardous Waste Tracking) - HAZARDOU WASTE PROGRAM Small Quantity Generators, between 100 kg and 1000 kg of hazardous waste/month (Resource Conservation and Recovery Act (tracking hazardous waste)) - notification Organizations: CHEVRON PRODUCTS CO (CONTACT/OWNER)
NORMANDY REFINISHERS (355 S ROSEMEAD BLVD in PASADENA, CA)
STATE MASTER (California - Hazardous Waste Tracking) - HAZARDOU WASTE PROGRAM Small Quantity Generators, between 100 kg and 1000 kg of hazardous waste/month (Resource Conservation and Recovery Act (tracking hazardous waste)) Business NAICS classification: ELECTROPLATING, PLATING, POLISHING, ANODIZING, AND COLORING.
FIELD ELEMENTARY (3600 SIERRA MADRE BLVD. in PASADENA, CA)
(National Center for Education Statistics) - STATE ID-6021570 Organizations: PASADENA UNIFIED (SCHOOL DISTRICT)
ALL TUNE AND LUBE (2655 E COLORADO BLVD in PASADENA, CA)
Small Quantity Generators, between 100 kg and 1000 kg of hazardous waste/month (Resource Conservation and Recovery Act (tracking hazardous waste)) - notification Small Quantity Generators, between 100 kg and 1000 kg of hazardous waste/month (Resource Conservation and Recovery Act (tracking hazardous waste)) - notification Organizations: DONALD NEGRI (CONTACT/OWNER)
, MANSOOR GOODARZI (CONTACT/OWNER)
Alternative names: DJS AUTO CARE
LORAL ELECTRO OPTICAL SYSTEMS (300 NORTH HALSTEAD STREET in PASADENA, CA)
CRITERIA AND HAZARDOUS AIR POLLUTANT INVENTORY (Inventory of air pollution sources) Large Quantity Generators, more that 1000 kg of hazardous waste/month (Resource Conservation and Recovery Act (tracking hazardous waste)) - notification Business SIC classification: ELECTRONIC COMPONENTS Organizations: TEACHERS INS AND ANNUITY ASSOC (CONTACT/OWNER)
Housing units lacking complete plumbing facilities: 0.4% Housing units lacking complete kitchen facilities: 1.2%
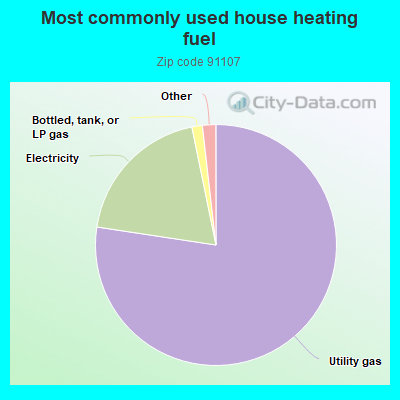
77.4%Utility gas
19.4%Electricity
1.4%Bottled, tank, or LP gas
0.8%Solar energy
0.7%No fuel used
Population in 1990: 31,390. Population change in the 1990s: +970 (+3.1%).
Place of birth for U.S.-born residents:
This state: 16,008
Northeast: 1,851
Midwest: 1,819
South: 1,269
West: 628
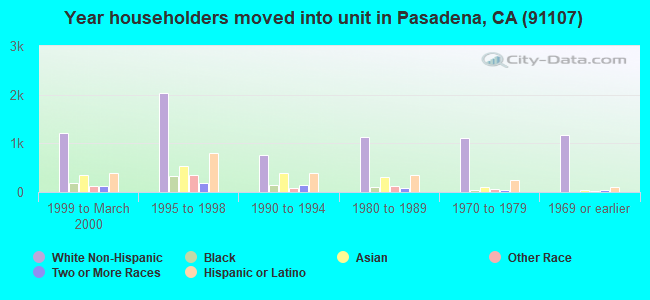
58% of the 91107 zip code residents lived in the same house 5 years ago. Out of people who lived in different houses, 81% lived in this county. Out of people who lived in different counties, 50% lived in California.
90% of the 91107 zip code residents lived in the same house 1 year ago. Out of people who lived in different houses, 77% moved from this county. Out of people who lived in different houses, 6% moved from different county within same state. Out of people who lived in different houses, 10% moved from different state. Out of people who lived in different houses, 5% moved from abroad.
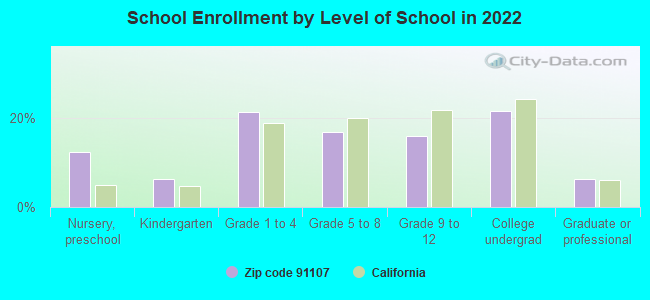
Private vs. public school enrollment:
Students in private schools in grades 1 to 8 (elementary and middle school): 829
Here:
33.1%
California:
10.5%
Students in private schools in grades 9 to 12 (high school): 409
Here:
40.0%
California:
8.5%
Students in private undergraduate colleges: 80
Here:
5.9%
California:
15.9%
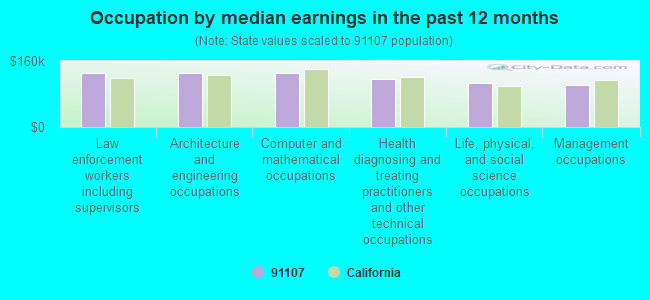
Occupation by median earnings in the past 12 months ($)
131,720Law enforcement workers including supervisors
131,465Architecture and engineering occupations
130,595Computer and mathematical occupations
115,239Health diagnosing and treating practitioners and other technical occupations
107,421Life, physical, and social science occupations
102,663Management occupations
Companies with federal contracts located in this zip code (PASADENA, CA):
TANNER RESEARCH, INC (2650 EAST FOOTHILL BLVD; small business) : $15,348,728 in 106 contractsfrom 1999 to 2006
Contracts for Defense Electronics and Communication Equipment -- Applied Research and Exploratory Development (R&D), Defense Missile and Space Systems -- Basic Research (R&D), Other Defense -- Applied Research and Exploratory Development (R&D), Weapons -- Basic Research (R&D), and moreby Air Force, Missile Defense Agency, Army, Navy, and others Signed by year:2000: $586,839; 2001: $1,750,667; 2002: $3,327,471; 2003: $2,046,985; 2004: $3,312,748; 2005: $1,606,924; 2006: $2,647,099.
Biggest contracts:
$859,313 with Air Force for Defense Electronics and Communication Equipment -- Applied Research and Exploratory Development (R&D). Signed on 2003-05-19. Completion date: 2004-04-30.
$775,146, same as above.Signed on 2002-03-14. Completion date: 2003-04-04.
$749,996 with Missile Defense Agency for Defense Missile and Space Systems -- Basic Research (R&D). Signed on 2006-03-27. Completion date: 2008-04-15.
$700,000 with Air Force for Defense Electronics and Communication Equipment -- Applied Research and Exploratory Development (R&D). Signed on 2004-06-17. Completion date: 2005-09-30.
CYRANO SCIENCES INC (73 N VINEDO AVE) : $11,874,060 in 20 contractsfrom 2002 to 2005
Contracts for Other Research and Development -- Basic Research (R&D), Other Defense -- Applied Research and Exploratory Development (R&D), Defense Electronics and Communication Equipment -- Applied Research and Exploratory Development (R&D), Defense Ships -- Applied Research and Exploratory Development (R&D), and moreby Navy, Army, Centers for Disease Control and Prevention, Air Force, and others Signed by year:2000: $0; 2001: $0; 2002: $510,850; 2003: $3,760,561; 2004: $4,412,405; 2005: $3,190,244; 2006: $0.
Biggest contracts:
$2,999,366 with Navy for Other Research and Development -- Basic Research (R&D). Signed on 2003-09-26. Completion date: 2004-09-07.
$2,853,418, same as above.Signed on 2004-09-02. Completion date: 2004-09-07.
$1,742,000, same as above.Signed on 2005-09-28. Completion date: 2004-09-07.
$1,230,305 with Army for Other Defense -- Applied Research and Exploratory Development (R&D). Signed on 2005-09-29. Completion date: 2007-01-30.
SYSTINE INC (2265 E FOOTHILL BOULEVARD; small business) : $1,293,782 in 4 contractsfrom 1999 to 2001
$727,870 with Army for Other Research and Development -- Basic Research (R&D). Signed on 2001-02-06. Completion date: 2001-12-31.
$365,956, same as above.Signed on 1999-12-07. Completion date: 2001-12-31.
$100,000 with Air Force for Physical Sciences -- Management and Support (R&D). Signed on 1999-12-27. Completion date: 2000-09-30.
$99,956 with Army for Other Research and Development -- Basic Research (R&D). Signed on 2001-12-03. Completion date: 2002-03-31.
EUREKA AEROSPACE (3452 EAST FOOTHILL BLVD #5; small business) : $1,118,530 in 8 contractsfrom 2001 to 2006
Contracts for Weapons -- Basic Research (R&D), Other Research and Development -- Basic Research (R&D), Engineering and Technical Services, Defense Missile and Space Systems -- Operational Systems Development (R&D), and moreby Navy, Air Force, Army Signed by year:2000: $0; 2001: $69,871; 2002: $198,674; 2003: $600,000; 2004: $0; 2005: $149,985; 2006: $100,000.
Biggest contracts:
$300,000 with Navy for Weapons -- Basic Research (R&D). Signed on 2003-12-18. Completion date: 2005-12-17.
$300,000 with Navy for Other Research and Development -- Basic Research (R&D). Signed on 2003-05-29. Completion date: 2005-05-28.
$149,985 with Navy for Engineering and Technical Services. Signed on 2005-01-10. Completion date: 2005-05-28.
$100,000 with Air Force for Defense Missile and Space Systems -- Operational Systems Development (R&D). Signed on 2006-02-15. Completion date: 2006-11-15.
TRANSMEMBRANE BIOSCIENCES (145 N SIERRA MADRE, SUITE; small business) : $298,000 in 3 contractsfrom 2001 to 2005
$100,000 with Army for Other Research and Development -- Basic Research (R&D). Signed on 2001-11-15. Completion date: 2002-05-14.
$99,000 with Army for Other Defense -- Basic Research (R&D). Signed on 2005-10-21. Completion date: 2006-06-21.
$99,000 with Army for Other Defense -- Applied Research and Exploratory Development (R&D). Signed on 2003-11-24. Completion date: 2004-08-06.
STERLING SOFTWARE (U S) INC (40 N ALTADENA DR 200) : $97,649 in 2 contractsin 2000
$120,649 with Department of Defense for Other ADP and Telecommunications Services (includes data storage on tapes, compact disks, etc.). Signed on 2000-10-01. Completion date: 2000-10-03.
-$23,000 with NASA for Other Research and Development -- Basic Research (R&D). Signed on 2000-03-15. Completion date: 1999-11-15.
CHAD GRILLS (175 S SIERRA MADRE BLVD; small business) : $90,000 in 2 contractsfrom 2003 to 2004
$45,000 with Army for Dependent Medicare Services. Taking place in HI. Signed on 2004-09-21. Completion date: 2005-08-31.
$45,000, same as above.Signed on 2003-08-30. Completion date: 2005-08-31.
CORE SOFTWARE TECHNOLOGY (133 N ALTADENA DRIVE, SUI; small business) : $44,902 in 2 contractsfrom 2004 to 2005
$36,751 with National Geospatial-Intelligence Agency for ADP Software. Taking place in VA. Signed on 2004-09-21. Completion date: 2005-08-31.
$8,151 with Department of Defense for ADP Software. Taking place in VA. Signed on 2005-09-13. Completion date: 2006-09-07.
MCKESSON WATER PRODUCTS COMPAN (3280 E FOOTHILL BLVD)
$29,061 with Department of Defense for Food Items For Resale. Signed on 2000-09-30. Completion date: 2000-09-30.
KHATRI INTERNATIONAL INC (3452 E FOOTHILL #340; small business)
$14,500 with Air Force for Engineering and Technical Services. Signed on 2006-04-24. Completion date: 2006-05-31.
Top industries in this zip code by the number of employees in 2005:
Administrative and Support and Waste Management and Remediation Services: Temporary Help Services (250-499 employees: 1 establishment, 100-249 employees: 3 establishments, 20-49 employees: 6 establishments)
2005 - 2018 National Fire Incident Reporting System (NFIRS) incidents
Based on the data from the years 2005 - 2018 the average number of fires per year is 51. The highest number of reported fire incidents - 69 took place in 2005, and the least - 25 in 2006. The data has a dropping trend.
When looking into fire subcategories, the most incidents belonged to: Structure Fires (39.7%), and Outside Fires (29.5%).
Fire incident types reported to NFIRS in Zip Code 91107


 Nearest zip codes: 91024, 91104, 91775, 91108, 91106, 91007.
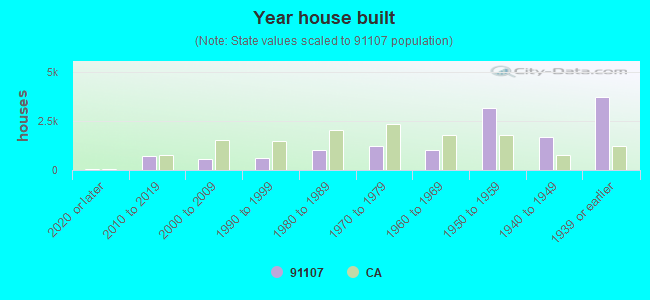


 Based on the data from the years 2005 - 2018 the average number of fires per year is 51. The highest number of reported fire incidents - 69 took place in 2005, and the least - 25 in 2006. The data has a dropping trend.
 When looking into fire subcategories, the most incidents belonged to: Structure Fires (39.7%), and Outside Fires (29.5%).