Estimated zip code population in 2022: 33,089 Zip code population in 2010: 34,095 Zip code population in 2000: 30,925
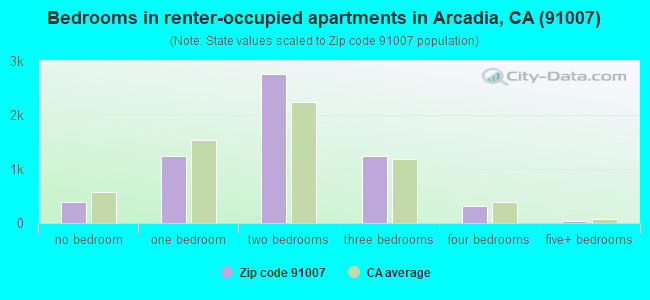
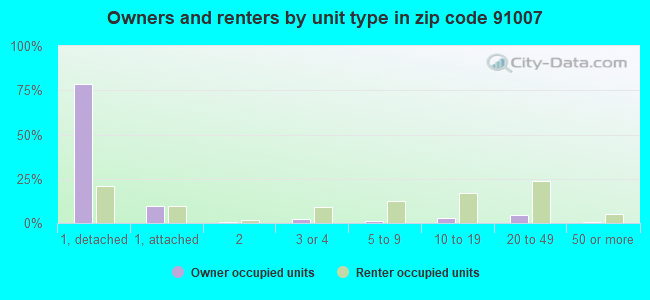
Houses and condos: 13,162 Renter-occupied apartments: 6,000
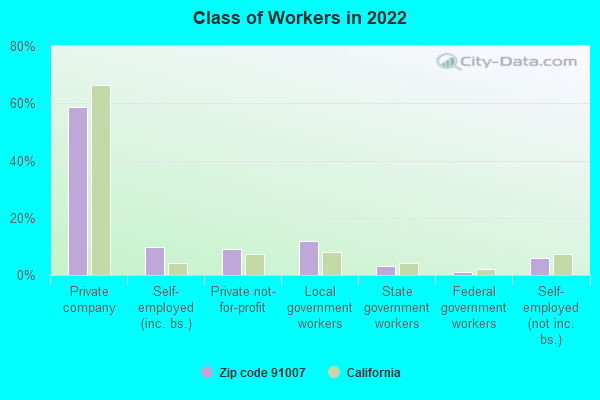
% of renters here:
50%
State:
44%
March 2022 cost of living index in zip code 91007: 144.2 (very high, U.S. average is 100)
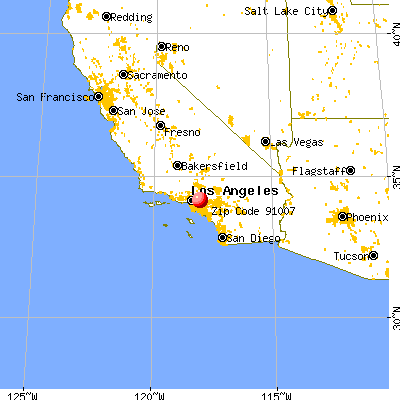
Land area: 5.6 sq. mi. Water area: 0.0 sq. mi.
Population density: 5,952 people per square mile
(average).
OSM Map
General Map
Google Map
MSN Map
OSM Map
General Map
Google Map
MSN Map
OSM Map
General Map
Google Map
MSN Map
OSM Map
General Map
Google Map
MSN Map
Please wait while loading the map...
Real estate property taxes paid for housing units in 2022:
This zip code:
0.6% ($8,566)
California:
0.7% ($4,831)
Median real estate property taxes paid for housing units with mortgages in 2022: $10,244 (0.7%) Median real estate property taxes paid for housing units with no mortgage in 2022: $6,865 (0.5%)
Estimated median house/condo value in 2022: $1,334,834
91007:
$1,334,834
California:
$715,900
According to our research of California and other state lists, there were 15 registered sex offenders living in 91007 zip code as of April 27, 2024. The ratio of all residents to sex offenders in zip code 91007 is 2,341 to 1. The ratio of registered sex offenders to all residents in this zip code is much lower than the state average.
Median resident age:
This zip code:
45.4 years
California median age:
37.9 years
Average household size:
This zip code:
2.6 people
California:
2.8 people
Averages for the 2020 tax year for zip code 91007, filed in 2021:
Average Adjusted Gross Income (AGI) in 2020: $107,133 (Individual Income Tax Returns)
Here:
$107,133
State:
$95,910
Salary/wage: $81,283 (reported on 73.9% of returns)
Here:
$81,283
State:
$77,331
(% of AGI for various income ranges: 1222.4% for AGIs below $25k, 3936.3% for AGIs $25k-50k, 7693.7% for AGIs $50k-75k, 10981.9% for AGIs $75k-100k, 21741.4% for AGIs $100k-200k, 105758.1% for AGIs over 200k)
Taxable interest for individuals: $4,343 (reported on 47.5% of returns)
This zip code:
$4,343
California:
$2,294
(% of AGI for various income ranges: 83.8% for AGIs below $25k, 157.0% for AGIs $25k-50k, 261.0% for AGIs $50k-75k, 319.8% for AGIs $75k-100k, 551.9% for AGIs $100k-200k, 3969.5% for AGIs over 200k)
Ordinary dividends: $11,798 (reported on 33.1% of returns)
Here:
$11,798
State:
$10,949
(% of AGI for various income ranges: 58.2% for AGIs below $25k, 120.8% for AGIs $25k-50k, 212.3% for AGIs $50k-75k, 291.6% for AGIs $75k-100k, 799.9% for AGIs $100k-200k, 11541.9% for AGIs over 200k)
Net capital gain/loss in AGI: +$24,220 (reported on 33.7% of returns)
Here:
+$24,220
State:
+$49,306
(% of AGI for various income ranges: 43.8% for AGIs below $25k, 130.3% for AGIs $25k-50k, 257.7% for AGIs $50k-75k, 446.2% for AGIs $75k-100k, 1710.4% for AGIs $100k-200k, 26133.5% for AGIs over 200k)
Profit/loss from business: +$15,824 (reported on 22.5% of returns)
Here:
+$15,824
State:
+$15,671
(% of AGI for various income ranges: 281.1% for AGIs below $25k, 438.5% for AGIs $25k-50k, 362.2% for AGIs $50k-75k, 290.8% for AGIs $75k-100k, 851.3% for AGIs $100k-200k, 6205.7% for AGIs over 200k)
Taxable individual retirement arrangement distribution: $25,382 (reported on 7.1% of returns)
91007:
$25,382
California:
$23,505
(% of AGI for various income ranges: 55.3% for AGIs below $25k, 92.0% for AGIs $25k-50k, 181.0% for AGIs $50k-75k, 289.2% for AGIs $75k-100k, 670.3% for AGIs $100k-200k, 3319.7% for AGIs over 200k)
Self-employed (Keogh) retirement plans: $35,967 (reported on 1.2% of returns)
91007:
$35,967
California:
$30,163
(% of AGI for various income ranges: 27.0% for AGIs $50k-75k, 65.0% for AGIs $100k-200k, 1460.0% for AGIs over 200k)
Total itemized deductions: $41,432 (reported on 15.3% of returns)
Here:
$41,432
State:
$39,517
(% of AGI for various income ranges: 140.0% for AGIs below $25k, 290.8% for AGIs $25k-50k, 501.4% for AGIs $50k-75k, 942.6% for AGIs $75k-100k, 2129.6% for AGIs $100k-200k, 13661.9% for AGIs over 200k)
Charity contributions: $10,466 (reported on 11.8% of returns)
Here:
$10,466
State:
$12,598
(% of AGI for various income ranges: 5.6% for AGIs below $25k, 22.5% for AGIs $25k-50k, 47.7% for AGIs $50k-75k, 125.8% for AGIs $75k-100k, 361.5% for AGIs $100k-200k, 3465.4% for AGIs over 200k)
Taxes paid: $9,005 (reported on 15.2% of returns)
91007:
$9,005
State:
$8,807
(% of AGI for various income ranges: 31.4% for AGIs below $25k, 75.6% for AGIs $25k-50k, 138.3% for AGIs $50k-75k, 252.6% for AGIs $75k-100k, 601.1% for AGIs $100k-200k, 2234.6% for AGIs over 200k)
Earned income credit: $1,704 (reported on 11.2% of returns)
Here:
$1,704
State:
$2,074
(% of AGI for various income ranges: 65.8% for AGIs below $25k, 62.8% for AGIs $25k-50k, 1.0% for AGIs $50k-75k)
Percentage of individuals using paid preparers for their 2020 taxes: 91.3%
Here:
91%
State:
92%
(% for various income ranges: 90.0% for AGIs below $25k, 91.7% for AGIs $25k-50k, 91.8% for AGIs $50k-75k, 92.5% for AGIs $75k-100k, 91.6% for AGIs $100k-200k, 92.0% for AGIs over 200k)
Averages for the 2012 tax year for zip code 91007, filed in 2013:
Average Adjusted Gross Income (AGI) in 2012: $82,092 (Individual Income Tax Returns)
Here:
$82,092
State:
$72,726
Salary/wage: $68,521 (reported on 76.4% of returns)
Here:
$68,521
State:
$59,079
(% of AGI for various income ranges: 70.3% for AGIs below $25k, 77.0% for AGIs $25k-50k, 74.5% for AGIs $50k-75k, 75.5% for AGIs $75k-100k, 71.9% for AGIs $100k-200k, 49.1% for AGIs over 200k)
Taxable interest for individuals: $2,424 (reported on 52.0% of returns)
This zip code:
$2,424
California:
$2,146
(% of AGI for various income ranges: 3.3% for AGIs below $25k, 1.6% for AGIs $25k-50k, 1.6% for AGIs $50k-75k, 1.4% for AGIs $75k-100k, 1.2% for AGIs $100k-200k, 1.6% for AGIs over 200k)
Ordinary dividends: $6,749 (reported on 31.5% of returns)
Here:
$6,749
State:
$9,308
(% of AGI for various income ranges: 3.4% for AGIs below $25k, 1.7% for AGIs $25k-50k, 2.0% for AGIs $50k-75k, 2.3% for AGIs $75k-100k, 2.0% for AGIs $100k-200k, 3.3% for AGIs over 200k)
Net capital gain/loss in AGI: +$12,835 (reported on 29.5% of returns)
Here:
+$12,835
State:
+$30,460
(% of AGI for various income ranges: 0.2% for AGIs $25k-50k, 0.6% for AGIs $50k-75k, 0.5% for AGIs $75k-100k, 1.5% for AGIs $100k-200k, 10.4% for AGIs over 200k)
Profit/loss from business: +$19,530 (reported on 20.8% of returns)
Here:
+$19,530
State:
+$17,064
(% of AGI for various income ranges: 17.5% for AGIs below $25k, 7.0% for AGIs $25k-50k, 4.4% for AGIs $50k-75k, 3.8% for AGIs $75k-100k, 4.1% for AGIs $100k-200k, 4.0% for AGIs over 200k)
Taxable individual retirement arrangement distribution: $18,531 (reported on 9.0% of returns)
91007:
$18,531
California:
$19,557
(% of AGI for various income ranges: 3.3% for AGIs below $25k, 1.9% for AGIs $25k-50k, 2.4% for AGIs $50k-75k, 2.2% for AGIs $75k-100k, 2.1% for AGIs $100k-200k, 1.7% for AGIs over 200k)
Self-employment retirement plans: $26,126 (reported on 1.3% of returns)
91007:
$26,126
California:
$24,530
(% of AGI for various income ranges: 0.4% for AGIs $50k-75k, 0.3% for AGIs $100k-200k, 0.7% for AGIs over 200k)
Total itemized deductions: $35,471 (24% of AGI, reported on 41.5% of returns)
Here:
$35,471
State:
$34,004
Here:
23.5% of AGI
State:
22.7% of AGI
(% of AGI for various income ranges: 16.9% for AGIs below $25k, 14.2% for AGIs $25k-50k, 15.8% for AGIs $50k-75k, 18.1% for AGIs $75k-100k, 19.9% for AGIs $100k-200k, 18.1% for AGIs over 200k)
Charity contributions: $4,301 (reported on 33.5% of returns)
Here:
$4,301
State:
$4,659
(% of AGI for various income ranges: 0.7% for AGIs below $25k, 1.1% for AGIs $25k-50k, 1.5% for AGIs $50k-75k, 1.9% for AGIs $75k-100k, 2.1% for AGIs $100k-200k, 1.8% for AGIs over 200k)
Taxes paid: $16,128 (reported on 41.4% of returns)
91007:
$16,128
State:
$14,448
(% of AGI for various income ranges: 4.9% for AGIs below $25k, 4.5% for AGIs $25k-50k, 5.3% for AGIs $50k-75k, 6.9% for AGIs $75k-100k, 8.7% for AGIs $100k-200k, 10.0% for AGIs over 200k)
Earned income credit: $1,880 (reported on 13.3% of returns)
Here:
$1,880
State:
$2,286
(% of AGI for various income ranges: 4.8% for AGIs below $25k, 0.8% for AGIs $25k-50k)
Percentage of individuals using paid preparers for their 2012 taxes: 67.6%
Here:
68%
State:
64%
(% for various income ranges: 66.5% for AGIs below $25k, 67.3% for AGIs $25k-50k, 66.7% for AGIs $50k-75k, 67.2% for AGIs $75k-100k, 67.6% for AGIs $100k-200k, 75.9% for AGIs over 200k)
Averages for the 2004 tax year for zip code 91007, filed in 2005:
Average Adjusted Gross Income (AGI) in 2004: $62,542 (Individual Income Tax Returns)
Here:
$62,542
State:
$58,600
Salary/wage: $55,591 (reported on 75.4% of returns)
Here:
$55,591
State:
$49,455
(% of AGI for various income ranges: 66.2% for AGIs $10k-25k, 75.9% for AGIs $25k-50k, 74.7% for AGIs $50k-75k, 71.8% for AGIs $75k-100k, 57.9% for AGIs over 100k)
Taxable interest for individuals: $2,802 (reported on 62.5% of returns)
This zip code:
$2,802
California:
$2,365
(% of AGI for various income ranges: 5.5% for AGIs $10k-25k, 3.1% for AGIs $25k-50k, 2.5% for AGIs $50k-75k, 2.5% for AGIs $75k-100k, 2.2% for AGIs over 100k)
Taxable dividends: $4,018 (reported on 35.3% of returns)
Here:
$4,018
State:
$4,746
(% of AGI for various income ranges: 2.9% for AGIs $10k-25k, 2.0% for AGIs $25k-50k, 2.0% for AGIs $50k-75k, 1.9% for AGIs $75k-100k, 2.2% for AGIs over 100k)
Net capital gain/loss: +$14,490 (reported on 32.9% of returns)
Here:
+$14,490
State:
+$23,418
(% of AGI for various income ranges: 0.1% for AGIs $10k-25k, 0.8% for AGIs $25k-50k, 1.1% for AGIs $50k-75k, 2.0% for AGIs $75k-100k, 12.3% for AGIs over 100k)
Profit/loss from business: +$18,455 (reported on 20.6% of returns)
Here:
+$18,455
State:
+$16,826
(% of AGI for various income ranges: 13.1% for AGIs $10k-25k, 6.2% for AGIs $25k-50k, 5.1% for AGIs $50k-75k, 5.0% for AGIs $75k-100k, 5.3% for AGIs over 100k)
IRA payment deduction: $3,973 (reported on 6.5% of returns)
91007:
$3,973
California:
$3,192
(% of AGI for various income ranges: 0.6% for AGIs $10k-25k, 0.8% for AGIs $25k-50k, 0.6% for AGIs $50k-75k, 0.5% for AGIs $75k-100k, 0.2% for AGIs over 100k)
Self-employed pension: $21,731 (reported on 1.8% of returns)
Here:
$21,731
California:
$17,688
(% of AGI for various income ranges: 0.2% for AGIs $10k-25k, 0.2% for AGIs $25k-50k, 0.2% for AGIs $50k-75k, 0.4% for AGIs $75k-100k, 0.9% for AGIs over 100k)
Total itemized deductions: $28,201 (24% of AGI, reported on 42.2% of returns)
Here:
$28,201
State:
$28,113
Here:
24.5% of AGI
State:
25.3% of AGI
(% of AGI for various income ranges: 15.3% for AGIs $10k-25k, 15.8% for AGIs $25k-50k, 19.3% for AGIs $50k-75k, 20.2% for AGIs $75k-100k, 18.7% for AGIs over 100k)
Charity contributions deductions: $3,992 (3% of AGI, reported on 35.9% of returns)
Here:
$3,992
State:
$3,923
Here:
3.2% of AGI
State:
3.3% of AGI
(% of AGI for various income ranges: 1.2% for AGIs $10k-25k, 1.4% for AGIs $25k-50k, 2.1% for AGIs $50k-75k, 2.5% for AGIs $75k-100k, 2.5% for AGIs over 100k)
Total tax: $11,540 (reported on 78.2% of returns)
91007:
$11,540
State:
$10,761
(% of AGI for various income ranges: 5.0% for AGIs $10k-25k, 7.4% for AGIs $25k-50k, 9.7% for AGIs $50k-75k, 10.6% for AGIs $75k-100k, 18.1% for AGIs over 100k)
Earned income credit: $1,479 (reported on 11.0% of returns)
Here:
$1,479
State:
$1,763
Percentage of individuals using paid preparers for their 2004 taxes: 68.3%
Here:
68%
State:
66%
(% for various income ranges: 65.3% for AGIs below $10k, 70.4% for AGIs $10k-25k, 65.8% for AGIs $25k-50k, 67.7% for AGIs $50k-75k, 69.4% for AGIs $75k-100k, 72.7% for AGIs over 100k)
Likely homosexual households (counted as self-reported same-sex unmarried-partner households)
Lesbian couples: 0.0% of all households
Gay men: 0.1% of all households
Household received Food Stamps/SNAP in the past 12 months: 761 Household did not receive Food Stamps/SNAP in the past 12 months: 11,142
Women who had a birth in the past 12 months: 257 (222 now married, 34 unmarried) Women who did not have a birth in the past 12 months: 6,668 (3,067 now married, 3,583 unmarried)
Housing units in zip code 91007 with a mortgage: 3,253 (206 second mortgage, 16 home equity loan, 197 both second mortgage and home equity loan) Houses without a mortgage: 79
Median monthly owner costs for units with a mortgage: $3,652 Median monthly owner costs for units without a mortgage: $1,016
Residents with income below the poverty level in 2022:
This zip code:
9.6%
Whole state:
12.2%
Residents with income below 50% of the poverty level in 2022:
This zip code:
3.6%
Whole state:
6.2%
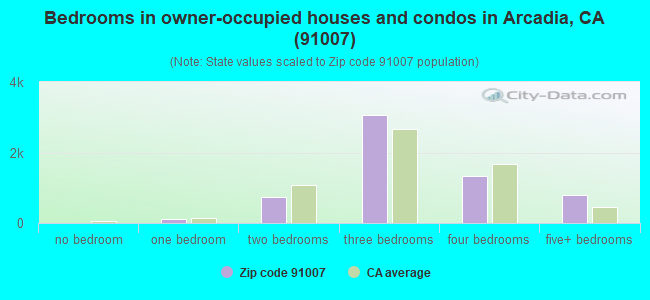
Median number of rooms in houses and condos:
Here:
6.2
State:
6.0
Median number of rooms in apartments:
Here:
4.1
State:
3.9
Notable locations in this zip code not listed on our city pages
Notable locations in zip code 91007: Santa Anita Golf Course (A), Arcadia Public Library (B), Arcadia City Hall (C), City of Arcadia Fire Department Station 106 Headquarters (D), United States Forest Service Center (E). Display/hide their locations on the map
Churches in zip code 91007 include: Church of the Good Shepherd (A), Arcadia Congregational Church (B), Bread of Life Church (C), Serbian Orthodox Church of Christ (D), Holy Angels Roman Catholic Church (E). Display/hide their locations on the map
Parks in zip code 91007 include: Arcadia County Park (1), Hugo Reid Park (2), Santa Anita Park (3), Baldwin Stocker Park (4), Holly Avenue Park (5), Los Angeles County and State Arboretum (6), Newcastle Park (7), Tripolis Park (8), Arcadia High School Recreation Park (9). Display/hide their locations on the map
In group quarters: 1,299 (-1 institutionalized population)
Size of family households: 3,591 2-persons, 2,495 3-persons, 1,870 4-persons, 510 5-persons, 205 6-persons, 131 7-or-more-persons
Size of nonfamily households: 2,625 1-person, 552 2-persons, 76 3-persons
4,438 married couples with children.
1,518 single-parent households (141 men, 1,377 women).
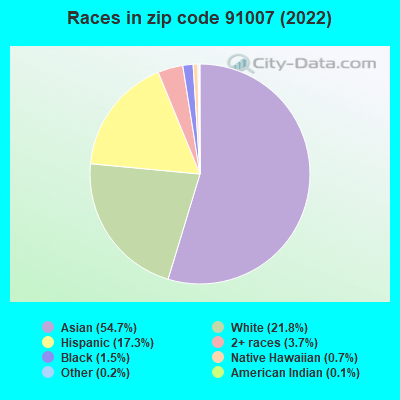
42.3% of residents of 91007 zip code speak English at home.
7.9% of residents speak Spanish at home (83% very well, 10% well, 6% not well, 1% not at all).
4.5% of residents speak other Indo-European language at home (73% very well, 24% well, 3% not well).
45.4% of residents speak Asian or Pacific Island language at home (44% very well, 29% well, 18% not well, 9% not at all).
0.4% of residents speak other language at home (53% very well, 18% well, 29% not at all).
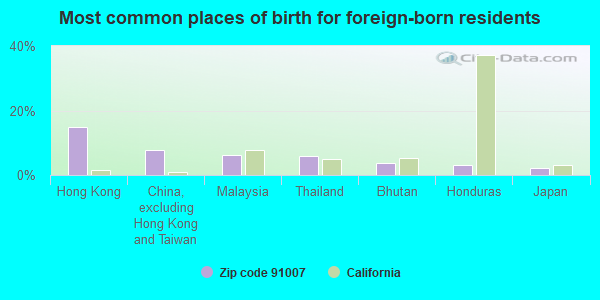
Foreign born population: 14,997 (45.3%) (65.1% of them are naturalized citizens)
Major facilities with environmental interests located in this zip code:
ARCADIA HIGH (180 CAMPUS DR. in ARCADIA, CA)
(National Center for Education Statistics) - STATE ID-1930288 Organizations: ARCADIA UNIFIED (SCHOOL DISTRICT)
HOLLY AVENUE ELEMENTARY (360 W. DUARTE ROAD in ARCADIA, CA)
(National Center for Education Statistics) - STATE ID-6011175 Organizations: ARCADIA UNIFIED (SCHOOL DISTRICT)
HUGO REID ELEMENTARY (1000 HUGO REID DR. in ARCADIA, CA)
(National Center for Education Statistics) - STATE ID-6011183 Organizations: ARCADIA UNIFIED (SCHOOL DISTRICT)
LONGLEY WAY ELEMENTARY (2601 LONGLEY WAY in ARCADIA, CA)
(National Center for Education Statistics) - STATE ID-6011191 Organizations: ARCADIA UNIFIED (SCHOOL DISTRICT)
LOS ANGELES TURF CLUB INC (285 W HUNTINGTON DR in ARCADIA, CA)
STATE MASTER (California - Hazardous Waste Tracking) - HAZARDOU WASTE PROGRAM Small Quantity Generators, between 100 kg and 1000 kg of hazardous waste/month (Resource Conservation and Recovery Act (tracking hazardous waste)) Business NAICS classification: RACETRACKS.
BALDWIN STOCKER ELEMENTARY (422 W. LEMON AVE. in ARCADIA, CA)
(National Center for Education Statistics) - STATE ID-6011134 Organizations: ARCADIA UNIFIED (SCHOOL DISTRICT)
CAMINO GROVE ELEMENTARY (700 CAMINO GROVE AVE. in ARCADIA, CA)
(National Center for Education Statistics) - STATE ID-6011159 Organizations: ARCADIA UNIFIED (SCHOOL DISTRICT)
EXXONMOBIL OIL CORP. (679 W DUARTE RD in ARCADIA, CA)
HAZARDOUS WASTE BIENNIAL REPORTER (Resource Conservation and Recovery Act (tracking hazardous waste)) Large Quantity Generators, more that 1000 kg of hazardous waste/month (Resource Conservation and Recovery Act (tracking hazardous waste)) Organizations: EXXONMOBIL OIL CORPORATION (CONTACT/OWNER)
ARCADIA AUTO CTR (154 W LIVE OAK AVE in ARCADIA, CA)
Small Quantity Generators, between 100 kg and 1000 kg of hazardous waste/month (Resource Conservation and Recovery Act (tracking hazardous waste)) - notification Organizations: ELIAS FARRAJ (CONTACT/OWNER)
ARCADIA MEDICAL CLINIC (1108 S BALDWIN AVE in ARCADIA, CA)
Small Quantity Generators, between 100 kg and 1000 kg of hazardous waste/month (Resource Conservation and Recovery Act (tracking hazardous waste)) - notification
EL RANCHO (1149 W HUNTINGTON DR in ARCADIA, CA)
Small Quantity Generators, between 100 kg and 1000 kg of hazardous waste/month (Resource Conservation and Recovery Act (tracking hazardous waste)) - notification Organizations: YE JASON (CONTACT/OWNER)
EXPRESSLY PORTRAITS (400 S BALDWIN UNIT 204 in ARCADIA, CA)
Small Quantity Generators, between 100 kg and 1000 kg of hazardous waste/month (Resource Conservation and Recovery Act (tracking hazardous waste)) - notification Organizations: EXPRESSLY PORTRAITS INC (CONTACT/OWNER)
JOHN T QUIGLEY M D PROF CORP (612 W DUARTE RD STE 401 in ARCADIA, CA)
Small Quantity Generators, between 100 kg and 1000 kg of hazardous waste/month (Resource Conservation and Recovery Act (tracking hazardous waste)) - notification
Housing units lacking complete plumbing facilities: 0.7% Housing units lacking complete kitchen facilities: 5.5%
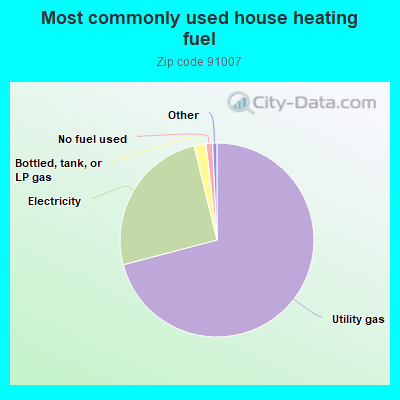
70.9%Utility gas
25.3%Electricity
2.0%Bottled, tank, or LP gas
1.1%No fuel used
Population in 1990: 25,675. Population change in the 1990s: +5,250 (+20.4%).
Place of birth for U.S.-born residents:
This state: 14,829
Northeast: 1,033
Midwest: 737
South: 726
West: 557
58% of the 91007 zip code residents lived in the same house 5 years ago. Out of people who lived in different houses, 82% lived in this county. Out of people who lived in different counties, 50% lived in California.
90% of the 91007 zip code residents lived in the same house 1 year ago. Out of people who lived in different houses, 70% moved from this county. Out of people who lived in different houses, 11% moved from different county within same state. Out of people who lived in different houses, 5% moved from different state. Out of people who lived in different houses, 14% moved from abroad.
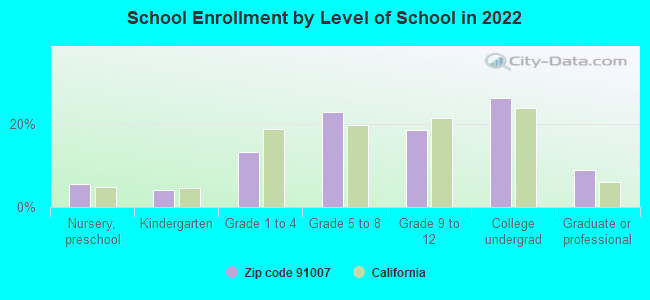
Private vs. public school enrollment:
Students in private schools in grades 1 to 8 (elementary and middle school): 342
Here:
11.4%
California:
10.5%
Students in private schools in grades 9 to 12 (high school): 124
Here:
8.1%
California:
8.5%
Students in private undergraduate colleges: 405
Here:
18.7%
California:
15.9%
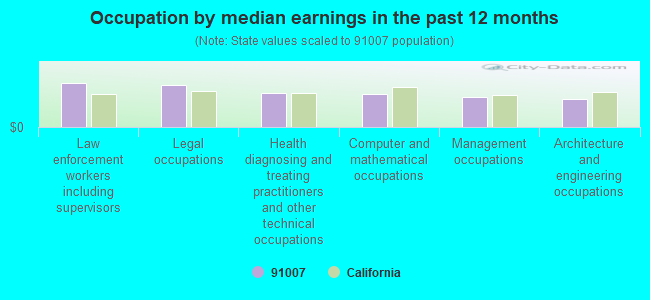
Occupation by median earnings in the past 12 months ($)
131,522Law enforcement workers including supervisors
125,683Legal occupations
101,809Health diagnosing and treating practitioners and other technical occupations
100,001Computer and mathematical occupations
88,301Management occupations
84,927Architecture and engineering occupations
Top industries in this zip code by the number of employees in 2005:
2005 - 2018 National Fire Incident Reporting System (NFIRS) incidents
Based on the data from the years 2005 - 2018 the average number of fires per year is 17. The highest number of reported fires - 54 took place in 2005, and the least - 2 in 2011. The data has a dropping trend.
When looking into fire subcategories, the most reports belonged to: Structure Fires (51.0%), and Outside Fires (26.7%).
Fire incident types reported to NFIRS in Zip Code 91007


 Nearest zip codes: 91006, 91780, 91024, 91775, 91107, 91731.
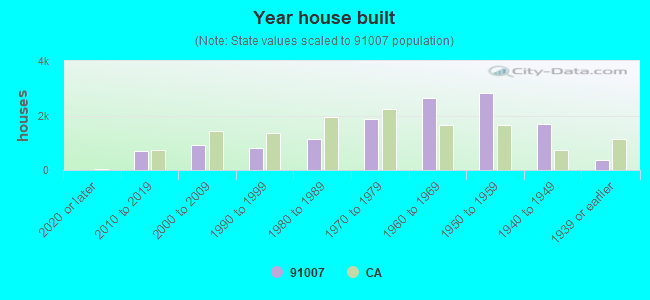


 Based on the data from the years 2005 - 2018 the average number of fires per year is 17. The highest number of reported fires - 54 took place in 2005, and the least - 2 in 2011. The data has a dropping trend.
 When looking into fire subcategories, the most reports belonged to: Structure Fires (51.0%), and Outside Fires (26.7%).