Estimated zip code population in 2022: 35,260 Zip code population in 2010: 34,332 Zip code population in 2000: 32,714
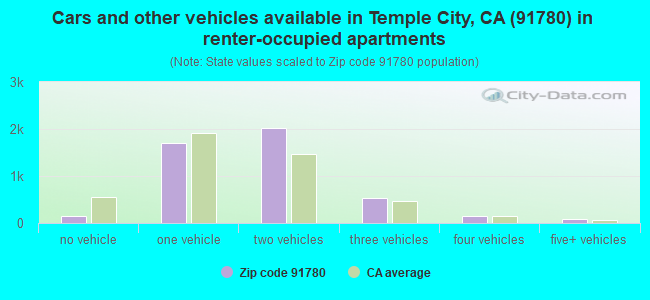
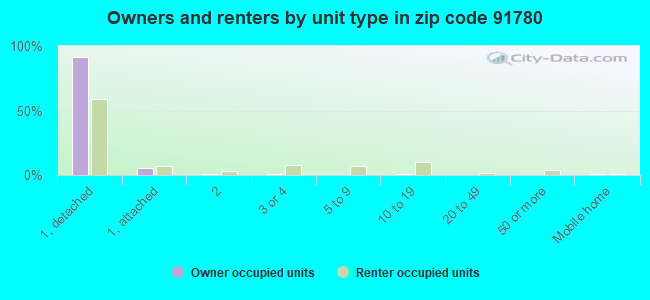
Houses and condos: 12,514 Renter-occupied apartments: 4,643
% of renters here:
39%
State:
44%
March 2022 cost of living index in zip code 91780: 137.3 (high, U.S. average is 100)
Land area: 3.8 sq. mi. Water area: 0.0 sq. mi.
Population density: 9,208 people per square mile
(high).
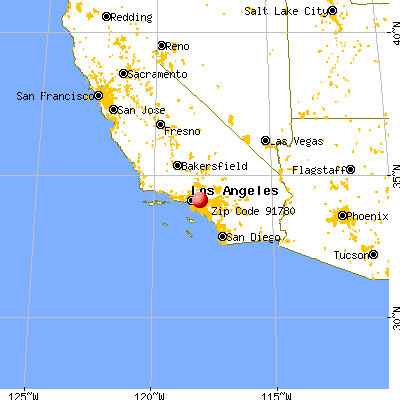
OSM Map
General Map
Google Map
MSN Map
OSM Map
General Map
Google Map
MSN Map
OSM Map
General Map
Google Map
MSN Map
OSM Map
General Map
Google Map
MSN Map
Please wait while loading the map...
Real estate property taxes paid for housing units in 2022:
This zip code:
0.7% ($6,294)
California:
0.7% ($4,831)
Median real estate property taxes paid for housing units with mortgages in 2022: $7,330 (0.8%) Median real estate property taxes paid for housing units with no mortgage in 2022: $5,167 (0.5%)
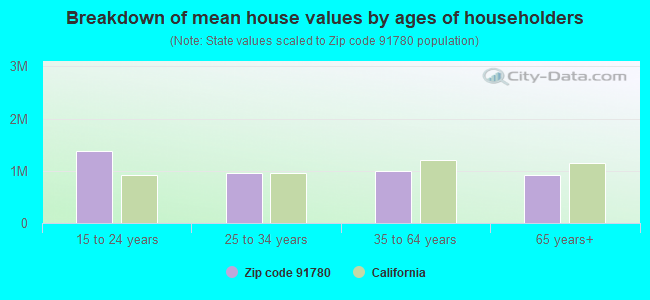
Estimated median house/condo value in 2022: $950,335
91780:
$950,335
California:
$715,900
According to our research of California and other state lists, there were 19 registered sex offenders living in 91780 zip code as of April 27, 2024. The ratio of all residents to sex offenders in zip code 91780 is 1,904 to 1. The ratio of registered sex offenders to all residents in this zip code is much lower than the state average.
Median resident age:
This zip code:
43.4 years
California median age:
37.9 years
Average household size:
This zip code:
3.0 people
California:
2.8 people
Averages for the 2020 tax year for zip code 91780, filed in 2021:
Average Adjusted Gross Income (AGI) in 2020: $70,286 (Individual Income Tax Returns)
Here:
$70,286
State:
$95,910
Salary/wage: $62,148 (reported on 75.7% of returns)
Here:
$62,148
State:
$77,331
(% of AGI for various income ranges: 1149.2% for AGIs below $25k, 3768.9% for AGIs $25k-50k, 7577.7% for AGIs $50k-75k, 10796.2% for AGIs $75k-100k, 20965.9% for AGIs $100k-200k, 80120.7% for AGIs over 200k)
Taxable interest for individuals: $1,866 (reported on 40.3% of returns)
This zip code:
$1,866
California:
$2,294
(% of AGI for various income ranges: 42.2% for AGIs below $25k, 68.8% for AGIs $25k-50k, 120.7% for AGIs $50k-75k, 135.7% for AGIs $75k-100k, 261.1% for AGIs $100k-200k, 1353.7% for AGIs over 200k)
Ordinary dividends: $3,170 (reported on 25.1% of returns)
Here:
$3,170
State:
$10,949
(% of AGI for various income ranges: 23.9% for AGIs below $25k, 46.8% for AGIs $25k-50k, 111.3% for AGIs $50k-75k, 147.3% for AGIs $75k-100k, 326.8% for AGIs $100k-200k, 1810.0% for AGIs over 200k)
Net capital gain/loss in AGI: +$15,077 (reported on 25.0% of returns)
Here:
+$15,077
State:
+$49,306
(% of AGI for various income ranges: 17.4% for AGIs below $25k, 81.6% for AGIs $25k-50k, 161.6% for AGIs $50k-75k, 342.6% for AGIs $75k-100k, 1012.7% for AGIs $100k-200k, 17130.0% for AGIs over 200k)
Profit/loss from business: +$10,813 (reported on 22.5% of returns)
Here:
+$10,813
State:
+$15,671
(% of AGI for various income ranges: 286.1% for AGIs below $25k, 376.4% for AGIs $25k-50k, 296.2% for AGIs $50k-75k, 432.8% for AGIs $75k-100k, 521.1% for AGIs $100k-200k, 2975.9% for AGIs over 200k)
Taxable individual retirement arrangement distribution: $16,220 (reported on 6.4% of returns)
91780:
$16,220
California:
$23,505
(% of AGI for various income ranges: 51.4% for AGIs below $25k, 82.4% for AGIs $25k-50k, 148.2% for AGIs $50k-75k, 316.8% for AGIs $75k-100k, 462.2% for AGIs $100k-200k, 1285.2% for AGIs over 200k)
Self-employed (Keogh) retirement plans: $19,844 (reported on 0.5% of returns)
91780:
$19,844
California:
$30,163
(% of AGI for various income ranges: 57.5% for AGIs $75k-100k, 463.3% for AGIs over 200k)
Total itemized deductions: $31,287 (reported on 13.1% of returns)
Here:
$31,287
State:
$39,517
(% of AGI for various income ranges: 100.2% for AGIs below $25k, 246.4% for AGIs $25k-50k, 477.8% for AGIs $50k-75k, 987.2% for AGIs $75k-100k, 1994.1% for AGIs $100k-200k, 7767.8% for AGIs over 200k)
Charity contributions: $6,485 (reported on 10.1% of returns)
Here:
$6,485
State:
$12,598
(% of AGI for various income ranges: 3.4% for AGIs below $25k, 17.6% for AGIs $25k-50k, 54.0% for AGIs $50k-75k, 142.7% for AGIs $75k-100k, 339.8% for AGIs $100k-200k, 1730.0% for AGIs over 200k)
Taxes paid: $8,867 (reported on 13.1% of returns)
91780:
$8,867
State:
$8,807
(% of AGI for various income ranges: 25.7% for AGIs below $25k, 68.7% for AGIs $25k-50k, 135.2% for AGIs $50k-75k, 305.5% for AGIs $75k-100k, 627.9% for AGIs $100k-200k, 1858.1% for AGIs over 200k)
Earned income credit: $1,807 (reported on 15.1% of returns)
Here:
$1,807
State:
$2,074
(% of AGI for various income ranges: 80.8% for AGIs below $25k, 72.2% for AGIs $25k-50k, 0.9% for AGIs $50k-75k)
Percentage of individuals using paid preparers for their 2020 taxes: 90.8%
Here:
91%
State:
92%
(% for various income ranges: 89.6% for AGIs below $25k, 92.2% for AGIs $25k-50k, 91.0% for AGIs $50k-75k, 91.6% for AGIs $75k-100k, 90.6% for AGIs $100k-200k, 91.4% for AGIs over 200k)
Averages for the 2012 tax year for zip code 91780, filed in 2013:
Average Adjusted Gross Income (AGI) in 2012: $54,377 (Individual Income Tax Returns)
Here:
$54,377
State:
$72,726
Salary/wage: $51,011 (reported on 80.3% of returns)
Here:
$51,011
State:
$59,079
(% of AGI for various income ranges: 69.2% for AGIs below $25k, 80.2% for AGIs $25k-50k, 79.9% for AGIs $50k-75k, 79.1% for AGIs $75k-100k, 79.4% for AGIs $100k-200k, 55.9% for AGIs over 200k)
Taxable interest for individuals: $1,055 (reported on 42.8% of returns)
This zip code:
$1,055
California:
$2,146
(% of AGI for various income ranges: 1.4% for AGIs below $25k, 0.8% for AGIs $25k-50k, 0.8% for AGIs $50k-75k, 0.7% for AGIs $75k-100k, 0.7% for AGIs $100k-200k, 0.9% for AGIs over 200k)
Ordinary dividends: $3,004 (reported on 22.0% of returns)
Here:
$3,004
State:
$9,308
(% of AGI for various income ranges: 1.4% for AGIs below $25k, 0.9% for AGIs $25k-50k, 0.9% for AGIs $50k-75k, 1.0% for AGIs $75k-100k, 0.9% for AGIs $100k-200k, 2.7% for AGIs over 200k)
Net capital gain/loss in AGI: +$3,619 (reported on 19.0% of returns)
Here:
+$3,619
State:
+$30,460
(% of AGI for various income ranges: 0.4% for AGIs $50k-75k, 0.4% for AGIs $75k-100k, 1.1% for AGIs $100k-200k, 6.1% for AGIs over 200k)
Profit/loss from business: +$12,468 (reported on 20.9% of returns)
Here:
+$12,468
State:
+$17,064
(% of AGI for various income ranges: 18.1% for AGIs below $25k, 5.8% for AGIs $25k-50k, 3.9% for AGIs $50k-75k, 2.8% for AGIs $75k-100k, 2.4% for AGIs $100k-200k, 3.8% for AGIs over 200k)
Taxable individual retirement arrangement distribution: $12,618 (reported on 7.0% of returns)
91780:
$12,618
California:
$19,557
(% of AGI for various income ranges: 2.4% for AGIs below $25k, 1.9% for AGIs $25k-50k, 1.7% for AGIs $50k-75k, 2.0% for AGIs $75k-100k, 1.5% for AGIs $100k-200k, 0.5% for AGIs over 200k)
Self-employment retirement plans: $24,350 (reported on 0.5% of returns)
91780:
$24,350
California:
$24,530
Total itemized deductions: $25,889 (26% of AGI, reported on 35.3% of returns)
Here:
$25,889
State:
$34,004
Here:
26.0% of AGI
State:
22.7% of AGI
(% of AGI for various income ranges: 11.2% for AGIs below $25k, 12.7% for AGIs $25k-50k, 16.6% for AGIs $50k-75k, 17.1% for AGIs $75k-100k, 19.7% for AGIs $100k-200k, 17.9% for AGIs over 200k)
Charity contributions: $3,247 (reported on 28.2% of returns)
Here:
$3,247
State:
$4,659
(% of AGI for various income ranges: 0.6% for AGIs below $25k, 1.0% for AGIs $25k-50k, 1.6% for AGIs $50k-75k, 1.8% for AGIs $75k-100k, 2.2% for AGIs $100k-200k, 1.9% for AGIs over 200k)
Taxes paid: $9,869 (reported on 35.3% of returns)
91780:
$9,869
State:
$14,448
(% of AGI for various income ranges: 3.4% for AGIs below $25k, 3.6% for AGIs $25k-50k, 4.9% for AGIs $50k-75k, 6.4% for AGIs $75k-100k, 8.2% for AGIs $100k-200k, 8.8% for AGIs over 200k)
Earned income credit: $2,020 (reported on 19.4% of returns)
Here:
$2,020
State:
$2,286
(% of AGI for various income ranges: 6.5% for AGIs below $25k, 1.0% for AGIs $25k-50k)
Percentage of individuals using paid preparers for their 2012 taxes: 67.2%
Here:
67%
State:
64%
(% for various income ranges: 66.5% for AGIs below $25k, 67.8% for AGIs $25k-50k, 66.1% for AGIs $50k-75k, 68.5% for AGIs $75k-100k, 67.5% for AGIs $100k-200k, 73.7% for AGIs over 200k)
Averages for the 2004 tax year for zip code 91780, filed in 2005:
Average Adjusted Gross Income (AGI) in 2004: $44,276 (Individual Income Tax Returns)
Here:
$44,276
State:
$58,600
Salary/wage: $42,351 (reported on 82.1% of returns)
Here:
$42,351
State:
$49,455
(% of AGI for various income ranges: 270.8% for AGIs below $10k, 73.3% for AGIs $10k-25k, 82.7% for AGIs $25k-50k, 82.0% for AGIs $50k-75k, 82.3% for AGIs $75k-100k, 69.5% for AGIs over 100k)
Taxable interest for individuals: $1,321 (reported on 53.0% of returns)
This zip code:
$1,321
California:
$2,365
(% of AGI for various income ranges: 21.7% for AGIs below $10k, 2.7% for AGIs $10k-25k, 1.5% for AGIs $25k-50k, 1.3% for AGIs $50k-75k, 1.2% for AGIs $75k-100k, 1.2% for AGIs over 100k)
Taxable dividends: $1,459 (reported on 24.5% of returns)
Here:
$1,459
State:
$4,746
(% of AGI for various income ranges: 9.2% for AGIs below $10k, 1.3% for AGIs $10k-25k, 0.8% for AGIs $25k-50k, 0.8% for AGIs $50k-75k, 0.7% for AGIs $75k-100k, 0.6% for AGIs over 100k)
Net capital gain/loss: +$9,108 (reported on 21.7% of returns)
Here:
+$9,108
State:
+$23,418
(% of AGI for various income ranges: -1.1% for AGIs below $10k, -0.3% for AGIs $10k-25k, 0.3% for AGIs $25k-50k, 0.9% for AGIs $50k-75k, 1.2% for AGIs $75k-100k, 12.3% for AGIs over 100k)
Profit/loss from business: +$11,351 (reported on 20.0% of returns)
Here:
+$11,351
State:
+$16,826
(% of AGI for various income ranges: 23.6% for AGIs below $10k, 11.5% for AGIs $10k-25k, 5.2% for AGIs $25k-50k, 3.9% for AGIs $50k-75k, 3.7% for AGIs $75k-100k, 4.5% for AGIs over 100k)
IRA payment deduction: $3,523 (reported on 5.9% of returns)
91780:
$3,523
California:
$3,192
(% of AGI for various income ranges: 1.5% for AGIs below $10k, 0.5% for AGIs $10k-25k, 0.7% for AGIs $25k-50k, 0.6% for AGIs $50k-75k, 0.4% for AGIs $75k-100k, 0.3% for AGIs over 100k)
Self-employed pension: $11,196 (reported on 1.1% of returns)
Here:
$11,196
California:
$17,688
(% of AGI for various income ranges: 1.5% for AGIs below $10k, 0.1% for AGIs $25k-50k, 0.3% for AGIs $50k-75k, 0.3% for AGIs $75k-100k, 0.4% for AGIs over 100k)
Total itemized deductions: $21,016 (27% of AGI, reported on 38.2% of returns)
Here:
$21,016
State:
$28,113
Here:
27.1% of AGI
State:
25.3% of AGI
(% of AGI for various income ranges: 39.6% for AGIs below $10k, 13.0% for AGIs $10k-25k, 15.9% for AGIs $25k-50k, 18.6% for AGIs $50k-75k, 21.6% for AGIs $75k-100k, 18.5% for AGIs over 100k)
Charity contributions deductions: $2,766 (3% of AGI, reported on 32.6% of returns)
Here:
$2,766
State:
$3,923
Here:
3.4% of AGI
State:
3.3% of AGI
(% of AGI for various income ranges: 1.4% for AGIs below $10k, 1.0% for AGIs $10k-25k, 1.6% for AGIs $25k-50k, 2.2% for AGIs $50k-75k, 2.5% for AGIs $75k-100k, 2.3% for AGIs over 100k)
Total tax: $5,995 (reported on 76.9% of returns)
91780:
$5,995
State:
$10,761
(% of AGI for various income ranges: 13.5% for AGIs below $10k, 4.7% for AGIs $10k-25k, 6.8% for AGIs $25k-50k, 8.9% for AGIs $50k-75k, 9.7% for AGIs $75k-100k, 15.4% for AGIs over 100k)
Earned income credit: $1,553 (reported on 15.7% of returns)
Here:
$1,553
State:
$1,763
Percentage of individuals using paid preparers for their 2004 taxes: 68.2%
Here:
68%
State:
66%
(% for various income ranges: 62.4% for AGIs below $10k, 70.8% for AGIs $10k-25k, 67.9% for AGIs $25k-50k, 69.2% for AGIs $50k-75k, 69.5% for AGIs $75k-100k, 71.4% for AGIs over 100k)
Likely homosexual households (counted as self-reported same-sex unmarried-partner households)
Lesbian couples: 0.1% of all households
Gay men: 0.1% of all households
Household received Food Stamps/SNAP in the past 12 months: 836 Household did not receive Food Stamps/SNAP in the past 12 months: 10,842
Women who had a birth in the past 12 months: 273 (249 now married, 22 unmarried) Women who did not have a birth in the past 12 months: 7,893 (3,829 now married, 4,034 unmarried)
Housing units in zip code 91780 with a mortgage: 4,084 (366 second mortgage, 198 both second mortgage and home equity loan) Houses without a mortgage: 49
Median monthly owner costs for units with a mortgage: $3,143 Median monthly owner costs for units without a mortgage: $748
Residents with income below the poverty level in 2022:
This zip code:
10.0%
Whole state:
12.2%
Residents with income below 50% of the poverty level in 2022:
This zip code:
4.6%
Whole state:
6.2%
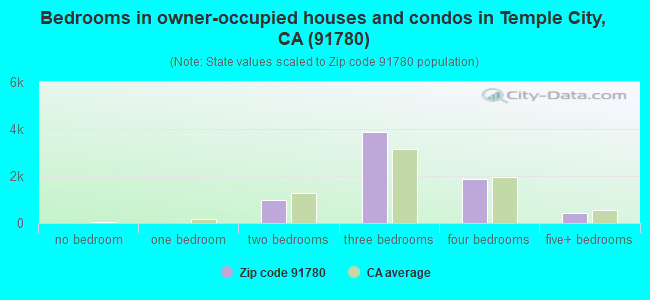
Median number of rooms in houses and condos:
Here:
5.9
State:
6.0
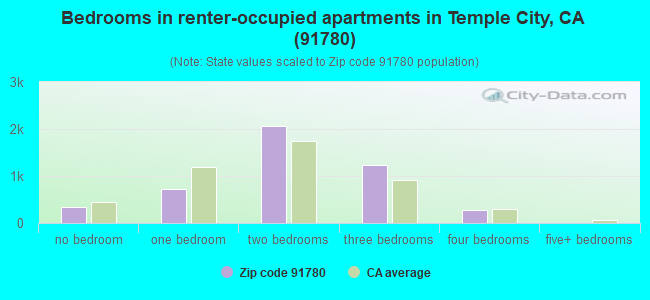
Median number of rooms in apartments:
Here:
4.4
State:
3.9
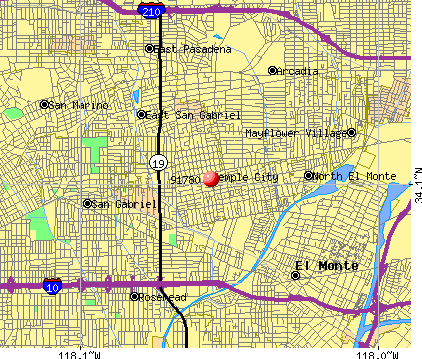
Notable locations in this zip code not listed on our city pages
Notable locations in zip code 91780: Carl W Mischke Memorial Library (A), Temple City City Hall (B), Temple City Branch County of Los Angeles Public Library (C), Los Angeles County Fire Department Station 47 (D). Display/hide their locations on the map
Churches in zip code 91780 include: Bethlehem Lutheran Church (A), Church of the Nazarene (B), The Church of Jesus Christ of Latter Day Saints (C), First Lutheran Church (D), First Southern Baptist Church (E), First United Methodist Church (F), Grace Baptist Church (G), New Beginnings Family Church (H), Pacific Ackworth Friends Meeting House (I). Display/hide their locations on the map
5,055 married couples with children.
1,652 single-parent households (625 men, 1,027 women).
32.8% of residents of 91780 zip code speak English at home.
11.3% of residents speak Spanish at home (63% very well, 18% well, 14% not well, 5% not at all).
3.2% of residents speak other Indo-European language at home (80% very well, 8% well, 10% not well, 2% not at all).
52.1% of residents speak Asian or Pacific Island language at home (44% very well, 26% well, 20% not well, 9% not at all).
0.6% of residents speak other language at home (75% very well, 16% well, 9% not well).
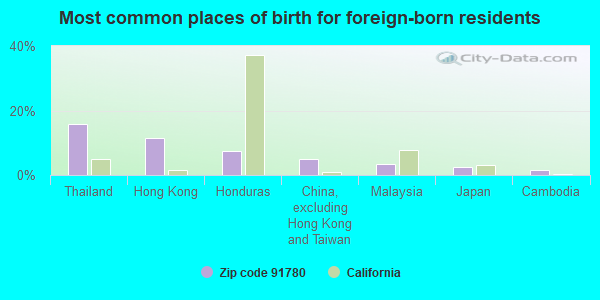
Foreign born population: 17,717 (50.2%) (69.2% of them are naturalized citizens)
This zip code:
50.2%
Whole state:
26.7%
16%Thailand
12%Hong Kong
7%Honduras
5%China, excluding Hong Kong and Taiwan
4%Malaysia
2%Japan
2%Cambodia
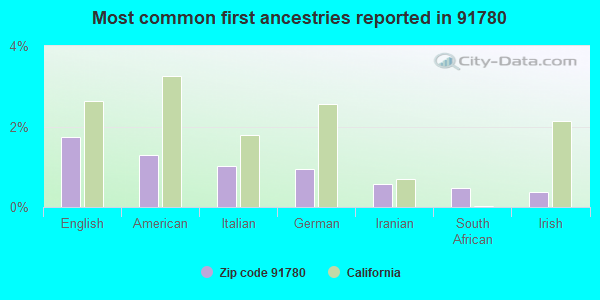
2%English
1%American
1%Italian
1%German
1%Iranian
0%South African
0%Irish
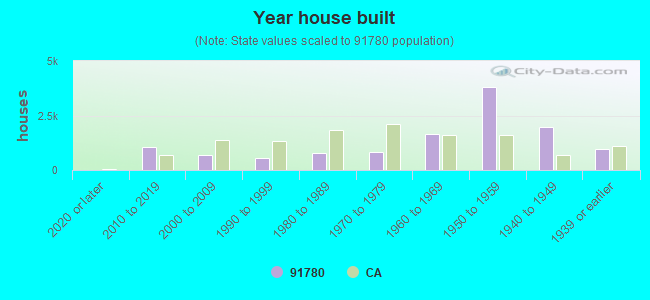
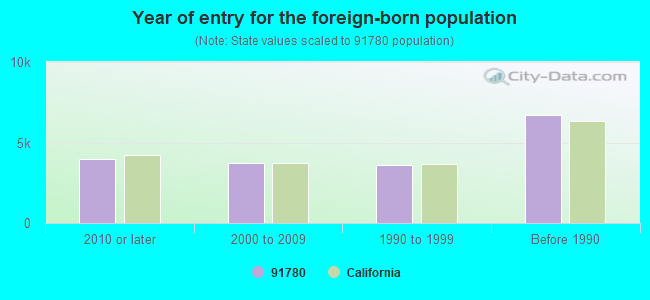
Year of entry for the foreign-born population
3,9792010 or later
3,7462000 to 2009
3,5751990 to 1999
6,710Before 1990
Major facilities with environmental interests located in this zip code:
GERMAN AUTO REPAIR (9133 E LAS TUNAS in TEMPLE CITY, CA)
STATE MASTER (California - Hazardous Waste Tracking) - HAZARDOU WASTE PROGRAM Small Quantity Generators, between 100 kg and 1000 kg of hazardous waste/month (Resource Conservation and Recovery Act (tracking hazardous waste)) - notification Business NAICS classification: GENERAL AUTOMOTIVE REPAIR. Organizations: BENGT KARLSSON & PAUL VITELLI (CONTACT/OWNER)
KENS TOW SERVICE (9350 LOWER AZUSA RD in TEMPLE CITY, CA)
STATE MASTER (California - Hazardous Waste Tracking) - HAZARDOU WASTE PROGRAM Small Quantity Generators, between 100 kg and 1000 kg of hazardous waste/month (Resource Conservation and Recovery Act (tracking hazardous waste)) - notification Business NAICS classification: ALL OTHER AUTOMOTIVE REPAIR AND MAINTENANCE. Organizations: CLARA REEVES (CONTACT/OWNER)
CHEVRON STATION 92721 (9425 LAS TUNAS DR in TEMPLE CITY, CA)
STATE MASTER (California - Hazardous Waste Tracking) - HAZARDOU WASTE PROGRAM Small Quantity Generators, between 100 kg and 1000 kg of hazardous waste/month (Resource Conservation and Recovery Act (tracking hazardous waste)) - notification Organizations: CHEVRON PRODUCTS CO (CONTACT/OWNER)
CHEVRON STATION NO 202036 (5675 ROSEMEAD BLVD in TEMPLE CITY, CA)
STATE MASTER (California - Hazardous Waste Tracking) - HAZARDOU WASTE PROGRAM Small Quantity Generators, between 100 kg and 1000 kg of hazardous waste/month (Resource Conservation and Recovery Act (tracking hazardous waste)) - notification Organizations: CHEVRON PRODUCTS CO (CONTACT/OWNER)
Alternative names: CHEVRON 202036, CHEVRON STATION 20 2036
LA ROSA ELEMENTARY (9301 E. LA ROSA DR. in TEMPLE CITY, CA)
(National Center for Education Statistics) - STATE ID-6022941 Organizations: TEMPLE CITY UNIFIED (SCHOOL DISTRICT)
LONGDEN ELEMENTARY (9501 WENDON ST. in TEMPLE CITY, CA)
(National Center for Education Statistics) - STATE ID-6022958 Organizations: TEMPLE CITY UNIFIED (SCHOOL DISTRICT)
NATTER MANUFACTURING CO. (9440 GIDLEY STREET in TEMPLE CITY, CA)
CRITERIA AND HAZARDOUS AIR POLLUTANT INVENTORY (Inventory of air pollution sources) (Resource Conservation and Recovery Act (tracking hazardous waste)) Small Quantity Generators, between 100 kg and 1000 kg of hazardous waste/month (Resource Conservation and Recovery Act (tracking hazardous waste)) - notification TRI REPORTER (Tracking of toxic chemicals releasing facilities) Business SIC classification: METAL STAMPINGS Organizations: MICHAEL DARABIAN (CONTACT/OWNER)
Alternative names: V I P APPAREL GROUP INC
L A TRIM INC (4343 TEMPLE CITY BLVD in TEMPLE CITY, CA)
Small Quantity Generators, between 100 kg and 1000 kg of hazardous waste/month (Resource Conservation and Recovery Act (tracking hazardous waste)) - notification TRI REPORTER (Tracking of toxic chemicals releasing facilities) Business SIC classification: PAINTS, VARNISHES, LACQUERS, ENAMELS, AND ALLIED PRODUCTS; ADHESIVES AND SEALANTS Business NAICS classification: PLASTICS MATERIAL AND RESIN MANUFACTURING. Organizations: POLTOPAK FAMILY (CONTACT/OWNER)
Alternative names: DEXTER CROWN METRO AEROSPACE INCORPORATED
ACME CONVERTING CO (4327 N TEMPLE CITY BLVD in TEMPLE CITY, CA)
Small Quantity Generators, between 100 kg and 1000 kg of hazardous waste/month (Resource Conservation and Recovery Act (tracking hazardous waste)) Organizations: TECHNICAL EQUITIES CORPORATION (CONTACT/OWNER)
EDMONDSON ENTERPRISES (10946 EAST GRAND AVENUE in TEMPLE CITY, CA)
CRITERIA AND HAZARDOUS AIR POLLUTANT INVENTORY (Inventory of air pollution sources) Small Quantity Generators, between 100 kg and 1000 kg of hazardous waste/month (Resource Conservation and Recovery Act (tracking hazardous waste)) Business SIC classification: COATING, ENGRAVING, AND ALLIED SERVICES
FREIGHT CONTAINER CORP (4942 ENCINITA AVE in TEMPLE CITY, CA)
Conditionally Exempt Small Quantity Generators, less than 100 kg/month of hazardous waste (Resource Conservation and Recovery Act (tracking hazardous waste)) - notification Organizations: ROBERT W CROWE (CONTACT/OWNER)
G-J & SONS TRUCKING (5540 N BALDWIN in TEMPLE CITY, CA)
TRANSPORTER (Resource Conservation and Recovery Act (tracking hazardous waste))
Housing units lacking complete plumbing facilities: 1.5% Housing units lacking complete kitchen facilities: 2.7%
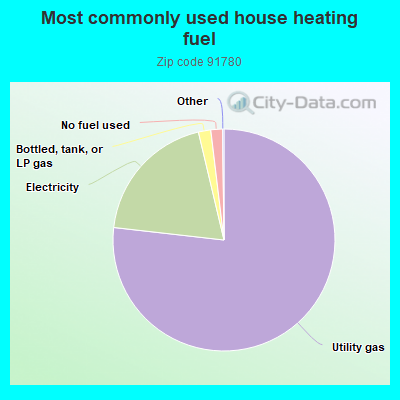
76.8%Utility gas
19.5%Electricity
1.8%Bottled, tank, or LP gas
1.7%No fuel used
Population in 1990: 31,297. Population change in the 1990s: +1,417 (+4.5%).
Place of birth for U.S.-born residents:
This state: 14,984
Northeast: 467
Midwest: 878
South: 605
West: 397
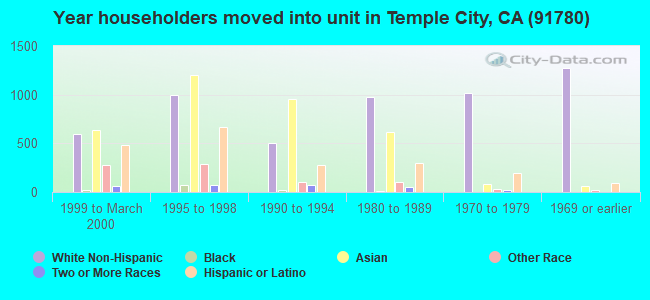
61% of the 91780 zip code residents lived in the same house 5 years ago. Out of people who lived in different houses, 88% lived in this county. Out of people who lived in different counties, 50% lived in California.
94% of the 91780 zip code residents lived in the same house 1 year ago. Out of people who lived in different houses, 72% moved from this county. Out of people who lived in different houses, 14% moved from different county within same state. Out of people who lived in different houses, 4% moved from different state. Out of people who lived in different houses, 12% moved from abroad.
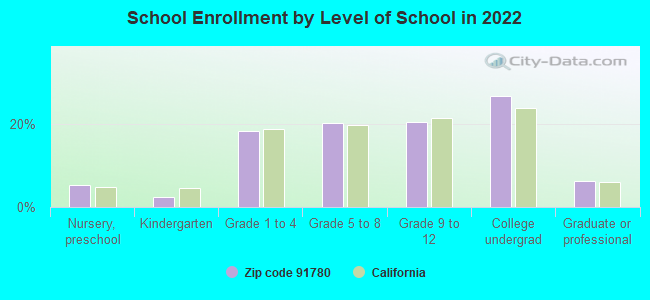
Private vs. public school enrollment:
Students in private schools in grades 1 to 8 (elementary and middle school): 173
Here:
5.2%
California:
10.5%
Students in private schools in grades 9 to 12 (high school): 122
Here:
6.8%
California:
8.5%
Students in private undergraduate colleges: 397
Here:
17.0%
California:
15.9%
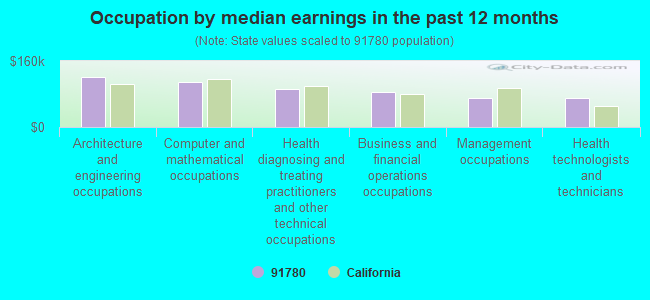
Occupation by median earnings in the past 12 months ($)
120,285Architecture and engineering occupations
108,268Computer and mathematical occupations
91,555Health diagnosing and treating practitioners and other technical occupations
83,996Business and financial operations occupations
69,489Management occupations
69,294Health technologists and technicians
Companies with federal contracts located in this zip code:
EXECUTIVE COACH INC (5917 OAK AVE PNB379 in TEMPLE CITY, CA) : $15,600 in 2 contractsin 2003
$11,700 with Navy for Lease or Rental of Equipment -- Ground Effect Vehicles, Motor Vehicles, Trailers, and Cycles. Signed on 2003-10-23. Completion date: 2003-10-25.
$3,900, same as above.Signed on 2003-10-23. Completion date: 2003-10-25.
Top industries in this zip code by the number of employees in 2005:
Health Care and Social Assistance: Nursing Care Facilities (250-499 employees: 1 establishment, 50-99 employees: 2 establishments)


 Nearest zip codes: 91731, 91007, 91775, 91776, 91006, 91770.