Estimated zip code population in 2022: 37,029 Zip code population in 2010: 38,475 Zip code population in 2000: 38,032
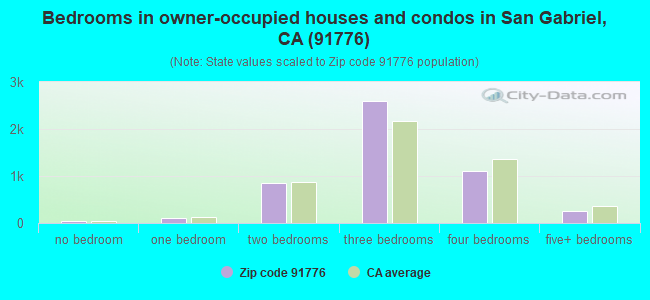
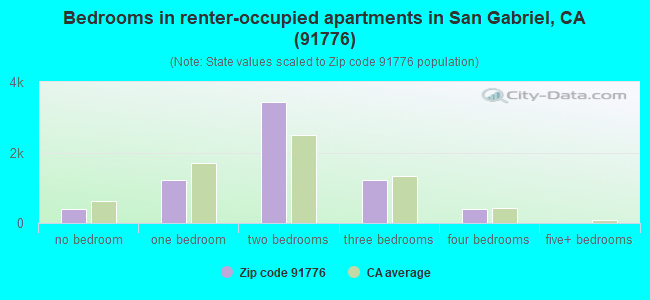
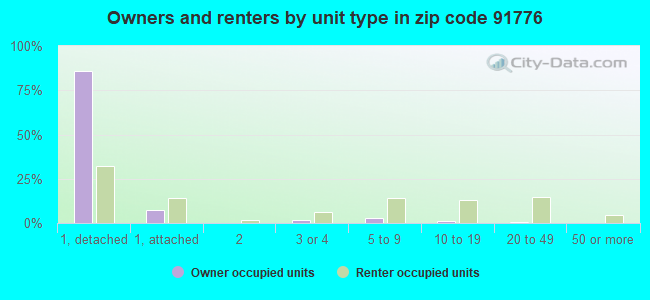
Houses and condos: 12,620 Renter-occupied apartments: 6,672
% of renters here:
57%
State:
44%
March 2022 cost of living index in zip code 91776: 138.0 (high, U.S. average is 100)
Land area: 3.4 sq. mi. Water area: 0.0 sq. mi.
Population density: 10,875 people per square mile
(high).
OSM Map
General Map
Google Map
MSN Map
OSM Map
General Map
Google Map
MSN Map
OSM Map
General Map
Google Map
MSN Map
OSM Map
General Map
Google Map
MSN Map
Please wait while loading the map...
Real estate property taxes paid for housing units in 2022:
This zip code:
0.7% ($6,331)
California:
0.7% ($4,831)
Median real estate property taxes paid for housing units with mortgages in 2022: $6,957 (0.8%) Median real estate property taxes paid for housing units with no mortgage in 2022: $5,767 (0.7%)
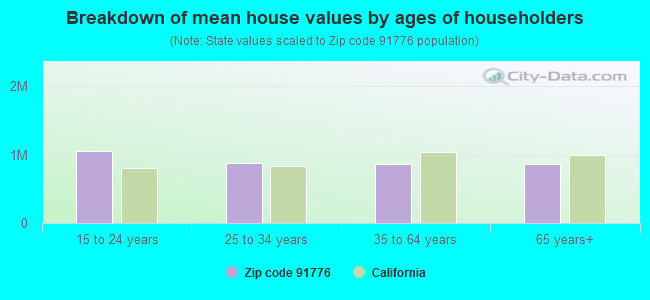
Estimated median house/condo value in 2022: $844,247
91776:
$844,247
California:
$715,900
According to our research of California and other state lists, there were 25 registered sex offenders living in 91776 zip code as of April 27, 2024. The ratio of all residents to sex offenders in zip code 91776 is 1,535 to 1. The ratio of registered sex offenders to all residents in this zip code is lower than the state average.
Median resident age:
This zip code:
43.8 years
California median age:
37.9 years
Average household size:
This zip code:
3.1 people
California:
2.8 people
Averages for the 2020 tax year for zip code 91776, filed in 2021:
Average Adjusted Gross Income (AGI) in 2020: $48,181 (Individual Income Tax Returns)
Here:
$48,181
State:
$95,910
Salary/wage: $45,422 (reported on 73.1% of returns)
Here:
$45,422
State:
$77,331
(% of AGI for various income ranges: 992.8% for AGIs below $25k, 3787.1% for AGIs $25k-50k, 7924.8% for AGIs $50k-75k, 11600.4% for AGIs $75k-100k, 21002.0% for AGIs $100k-200k, 70916.7% for AGIs over 200k)
Taxable interest for individuals: $1,708 (reported on 26.6% of returns)
This zip code:
$1,708
California:
$2,294
(% of AGI for various income ranges: 17.5% for AGIs below $25k, 29.3% for AGIs $25k-50k, 106.5% for AGIs $50k-75k, 106.0% for AGIs $75k-100k, 200.9% for AGIs $100k-200k, 2484.2% for AGIs over 200k)
Ordinary dividends: $2,678 (reported on 14.6% of returns)
Here:
$2,678
State:
$10,949
(% of AGI for various income ranges: 12.2% for AGIs below $25k, 20.3% for AGIs $25k-50k, 46.3% for AGIs $50k-75k, 62.5% for AGIs $75k-100k, 212.0% for AGIs $100k-200k, 2890.8% for AGIs over 200k)
Net capital gain/loss in AGI: +$12,813 (reported on 16.7% of returns)
Here:
+$12,813
State:
+$49,306
(% of AGI for various income ranges: 12.4% for AGIs below $25k, 38.3% for AGIs $25k-50k, 104.8% for AGIs $50k-75k, 277.0% for AGIs $75k-100k, 886.1% for AGIs $100k-200k, 24602.5% for AGIs over 200k)
Profit/loss from business: +$8,407 (reported on 27.5% of returns)
Here:
+$8,407
State:
+$15,671
(% of AGI for various income ranges: 369.4% for AGIs below $25k, 392.4% for AGIs $25k-50k, 251.9% for AGIs $50k-75k, 327.9% for AGIs $75k-100k, 449.5% for AGIs $100k-200k, 2881.7% for AGIs over 200k)
Taxable individual retirement arrangement distribution: $17,412 (reported on 3.2% of returns)
91776:
$17,412
California:
$23,505
(% of AGI for various income ranges: 22.4% for AGIs below $25k, 36.0% for AGIs $25k-50k, 69.7% for AGIs $50k-75k, 126.9% for AGIs $75k-100k, 434.3% for AGIs $100k-200k, 2328.3% for AGIs over 200k)
Self-employed (Keogh) retirement plans: $15,975 (reported on 0.2% of returns)
91776:
$15,975
California:
$30,163
(% of AGI for various income ranges: 78.9% for AGIs $75k-100k)
Total itemized deductions: $35,151 (reported on 6.7% of returns)
Here:
$35,151
State:
$39,517
(% of AGI for various income ranges: 40.2% for AGIs below $25k, 148.7% for AGIs $25k-50k, 331.4% for AGIs $50k-75k, 688.6% for AGIs $75k-100k, 1534.1% for AGIs $100k-200k, 13550.8% for AGIs over 200k)
Charity contributions: $5,678 (reported on 4.9% of returns)
Here:
$5,678
State:
$12,598
(% of AGI for various income ranges: 1.5% for AGIs below $25k, 12.9% for AGIs $25k-50k, 33.0% for AGIs $50k-75k, 100.5% for AGIs $75k-100k, 256.0% for AGIs $100k-200k, 1255.0% for AGIs over 200k)
Taxes paid: $8,636 (reported on 6.7% of returns)
91776:
$8,636
State:
$8,807
(% of AGI for various income ranges: 10.8% for AGIs below $25k, 42.4% for AGIs $25k-50k, 99.5% for AGIs $50k-75k, 231.5% for AGIs $75k-100k, 495.7% for AGIs $100k-200k, 1591.7% for AGIs over 200k)
Earned income credit: $1,580 (reported on 22.9% of returns)
Here:
$1,580
State:
$2,074
(% of AGI for various income ranges: 85.6% for AGIs below $25k, 83.0% for AGIs $25k-50k, 1.2% for AGIs $50k-75k)
Percentage of individuals using paid preparers for their 2020 taxes: 89.7%
Here:
90%
State:
92%
(% for various income ranges: 87.5% for AGIs below $25k, 91.4% for AGIs $25k-50k, 91.1% for AGIs $50k-75k, 92.6% for AGIs $75k-100k, 90.6% for AGIs $100k-200k, 91.1% for AGIs over 200k)
Averages for the 2012 tax year for zip code 91776, filed in 2013:
Average Adjusted Gross Income (AGI) in 2012: $37,095 (Individual Income Tax Returns)
Here:
$37,095
State:
$72,726
Salary/wage: $36,494 (reported on 78.4% of returns)
Here:
$36,494
State:
$59,079
(% of AGI for various income ranges: 70.0% for AGIs below $25k, 86.1% for AGIs $25k-50k, 84.2% for AGIs $50k-75k, 83.7% for AGIs $75k-100k, 80.3% for AGIs $100k-200k, 42.8% for AGIs over 200k)
Taxable interest for individuals: $1,000 (reported on 27.9% of returns)
This zip code:
$1,000
California:
$2,146
(% of AGI for various income ranges: 0.9% for AGIs below $25k, 0.6% for AGIs $25k-50k, 0.5% for AGIs $50k-75k, 0.7% for AGIs $75k-100k, 0.6% for AGIs $100k-200k, 1.7% for AGIs over 200k)
Ordinary dividends: $2,589 (reported on 11.6% of returns)
Here:
$2,589
State:
$9,308
(% of AGI for various income ranges: 0.5% for AGIs below $25k, 0.5% for AGIs $25k-50k, 0.5% for AGIs $50k-75k, 0.6% for AGIs $75k-100k, 0.7% for AGIs $100k-200k, 2.9% for AGIs over 200k)
Net capital gain/loss in AGI: +$5,998 (reported on 11.4% of returns)
Here:
+$5,998
State:
+$30,460
(% of AGI for various income ranges: 0.6% for AGIs $75k-100k, 1.2% for AGIs $100k-200k, 15.9% for AGIs over 200k)
Profit/loss from business: +$9,551 (reported on 25.5% of returns)
Here:
+$9,551
State:
+$17,064
(% of AGI for various income ranges: 21.6% for AGIs below $25k, 5.2% for AGIs $25k-50k, 3.2% for AGIs $50k-75k, 1.8% for AGIs $75k-100k, 2.6% for AGIs $100k-200k, 3.5% for AGIs over 200k)
Taxable individual retirement arrangement distribution: $12,717 (reported on 3.7% of returns)
91776:
$12,717
California:
$19,557
(% of AGI for various income ranges: 1.2% for AGIs below $25k, 0.9% for AGIs $25k-50k, 1.3% for AGIs $50k-75k, 1.4% for AGIs $75k-100k, 1.8% for AGIs $100k-200k, 1.0% for AGIs over 200k)
Self-employment retirement plans: $14,750 (reported on 0.2% of returns)
91776:
$14,750
California:
$24,530
Total itemized deductions: $24,096 (28% of AGI, reported on 20.8% of returns)
Here:
$24,096
State:
$34,004
Here:
28.1% of AGI
State:
22.7% of AGI
(% of AGI for various income ranges: 6.0% for AGIs below $25k, 9.9% for AGIs $25k-50k, 13.1% for AGIs $50k-75k, 16.3% for AGIs $75k-100k, 17.9% for AGIs $100k-200k, 23.2% for AGIs over 200k)
Charity contributions: $2,549 (reported on 15.3% of returns)
Here:
$2,549
State:
$4,659
(% of AGI for various income ranges: 0.3% for AGIs below $25k, 0.8% for AGIs $25k-50k, 1.2% for AGIs $50k-75k, 1.5% for AGIs $75k-100k, 1.6% for AGIs $100k-200k, 1.2% for AGIs over 200k)
Taxes paid: $8,706 (reported on 20.7% of returns)
91776:
$8,706
State:
$14,448
(% of AGI for various income ranges: 1.6% for AGIs below $25k, 2.7% for AGIs $25k-50k, 4.3% for AGIs $50k-75k, 6.4% for AGIs $75k-100k, 7.8% for AGIs $100k-200k, 8.6% for AGIs over 200k)
Earned income credit: $1,745 (reported on 32.8% of returns)
Here:
$1,745
State:
$2,286
(% of AGI for various income ranges: 7.4% for AGIs below $25k, 1.2% for AGIs $25k-50k)
Percentage of individuals using paid preparers for their 2012 taxes: 69.9%
Here:
70%
State:
64%
(% for various income ranges: 69.3% for AGIs below $25k, 72.8% for AGIs $25k-50k, 68.6% for AGIs $50k-75k, 67.7% for AGIs $75k-100k, 67.3% for AGIs $100k-200k, 76.5% for AGIs over 200k)
Averages for the 2004 tax year for zip code 91776, filed in 2005:
Average Adjusted Gross Income (AGI) in 2004: $32,589 (Individual Income Tax Returns)
Here:
$32,589
State:
$58,600
Salary/wage: $31,219 (reported on 84.1% of returns)
Here:
$31,219
State:
$49,455
(% of AGI for various income ranges: 119.0% for AGIs below $10k, 80.8% for AGIs $10k-25k, 89.1% for AGIs $25k-50k, 87.3% for AGIs $50k-75k, 84.4% for AGIs $75k-100k, 56.7% for AGIs over 100k)
Taxable interest for individuals: $1,061 (reported on 39.9% of returns)
This zip code:
$1,061
California:
$2,365
(% of AGI for various income ranges: 4.9% for AGIs below $10k, 1.4% for AGIs $10k-25k, 0.9% for AGIs $25k-50k, 1.0% for AGIs $50k-75k, 1.1% for AGIs $75k-100k, 1.6% for AGIs over 100k)
Taxable dividends: $1,633 (reported on 13.6% of returns)
Here:
$1,633
State:
$4,746
(% of AGI for various income ranges: 1.5% for AGIs below $10k, 0.4% for AGIs $10k-25k, 0.3% for AGIs $25k-50k, 0.4% for AGIs $50k-75k, 0.5% for AGIs $75k-100k, 1.6% for AGIs over 100k)
Net capital gain/loss: +$8,634 (reported on 13.6% of returns)
Here:
+$8,634
State:
+$23,418
(% of AGI for various income ranges: -0.9% for AGIs below $10k, -0.2% for AGIs $10k-25k, 0.1% for AGIs $25k-50k, 0.5% for AGIs $50k-75k, 1.8% for AGIs $75k-100k, 15.2% for AGIs over 100k)
Profit/loss from business: +$8,557 (reported on 18.9% of returns)
Here:
+$8,557
State:
+$16,826
(% of AGI for various income ranges: 15.5% for AGIs below $10k, 10.4% for AGIs $10k-25k, 4.1% for AGIs $25k-50k, 3.2% for AGIs $50k-75k, 3.3% for AGIs $75k-100k, 3.2% for AGIs over 100k)
IRA payment deduction: $3,298 (reported on 4.5% of returns)
91776:
$3,298
California:
$3,192
(% of AGI for various income ranges: 0.4% for AGIs below $10k, 0.4% for AGIs $10k-25k, 0.7% for AGIs $25k-50k, 0.5% for AGIs $50k-75k, 0.4% for AGIs $75k-100k, 0.2% for AGIs over 100k)
Self-employed pension: $14,025 (reported on 0.5% of returns)
Here:
$14,025
California:
$17,688
(% of AGI for various income ranges: 0.1% for AGIs $10k-25k, 0.1% for AGIs $25k-50k, 0.2% for AGIs $50k-75k, 0.2% for AGIs $75k-100k, 0.6% for AGIs over 100k)
Total itemized deductions: $18,943 (28% of AGI, reported on 23.7% of returns)
Here:
$18,943
State:
$28,113
Here:
28.0% of AGI
State:
25.3% of AGI
(% of AGI for various income ranges: 10.2% for AGIs below $10k, 8.6% for AGIs $10k-25k, 11.6% for AGIs $25k-50k, 15.8% for AGIs $50k-75k, 17.7% for AGIs $75k-100k, 17.0% for AGIs over 100k)
Charity contributions deductions: $2,376 (3% of AGI, reported on 18.9% of returns)
Here:
$2,376
State:
$3,923
Here:
3.3% of AGI
State:
3.3% of AGI
(% of AGI for various income ranges: 0.3% for AGIs below $10k, 0.5% for AGIs $10k-25k, 1.0% for AGIs $25k-50k, 1.7% for AGIs $50k-75k, 2.2% for AGIs $75k-100k, 1.8% for AGIs over 100k)
Total tax: $4,369 (reported on 69.4% of returns)
91776:
$4,369
State:
$10,761
(% of AGI for various income ranges: 6.1% for AGIs below $10k, 4.1% for AGIs $10k-25k, 6.5% for AGIs $25k-50k, 9.1% for AGIs $50k-75k, 10.4% for AGIs $75k-100k, 16.8% for AGIs over 100k)
Earned income credit: $1,581 (reported on 26.8% of returns)
Here:
$1,581
State:
$1,763
Percentage of individuals using paid preparers for their 2004 taxes: 68.0%
Here:
68%
State:
66%
(% for various income ranges: 64.5% for AGIs below $10k, 71.0% for AGIs $10k-25k, 67.6% for AGIs $25k-50k, 66.9% for AGIs $50k-75k, 66.3% for AGIs $75k-100k, 73.7% for AGIs over 100k)
Likely homosexual households (counted as self-reported same-sex unmarried-partner households)
Lesbian couples: 0.1% of all households
Gay men: 0.0% of all households
Household received Food Stamps/SNAP in the past 12 months: 1,088 Household did not receive Food Stamps/SNAP in the past 12 months: 10,466
Women who had a birth in the past 12 months: 239 (208 now married, 30 unmarried) Women who did not have a birth in the past 12 months: 8,344 (3,311 now married, 5,032 unmarried)
Housing units in zip code 91776 with a mortgage: 2,783 (212 second mortgage, 5 home equity loan, 212 both second mortgage and home equity loan) Houses without a mortgage: 42
Median monthly owner costs for units with a mortgage: $2,750 Median monthly owner costs for units without a mortgage: $790
Residents with income below the poverty level in 2022:
This zip code:
13.6%
Whole state:
12.2%
Residents with income below 50% of the poverty level in 2022:
This zip code:
7.3%
Whole state:
6.2%
Median number of rooms in houses and condos:
Here:
5.5
State:
6.0
Median number of rooms in apartments:
Here:
4.0
State:
3.9
Notable locations in this zip code not listed on our city pages
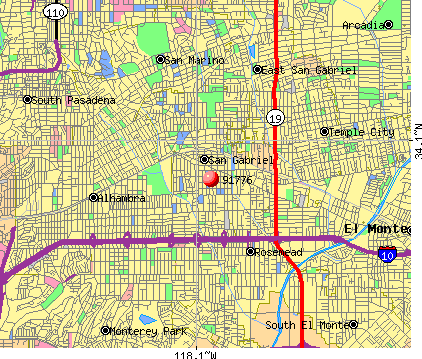
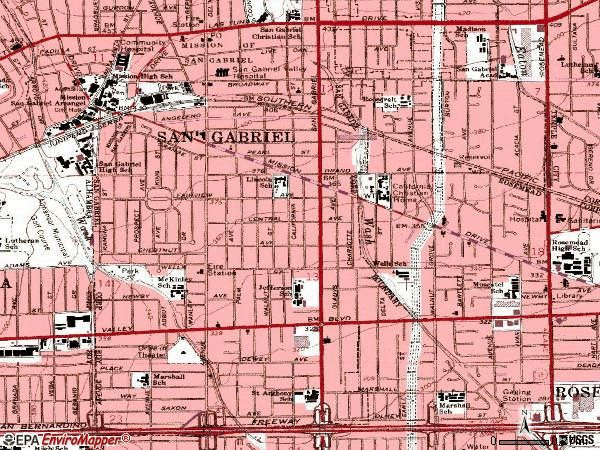
Notable locations in zip code 91776: San Gabriel Branch County of Los Angeles Public Library (A), San Gabriel Fire Department Station 1 Headquarters (B), Temple Sheriffs Station (C). Display/hide their locations on the map
Churches in zip code 91776 include: Gideon Foursquare Church (A), Saint Anthony's Catholic Church (B), Saint Sava Serbian Orthodox Church (C), San Gabriel Presbyterian Church (D), Unity Church of San Gabriel (E), Mission San Gabriel Arcangel (F). Display/hide their locations on the map
3,836 married couples with children.
1,511 single-parent households (644 men, 867 women).
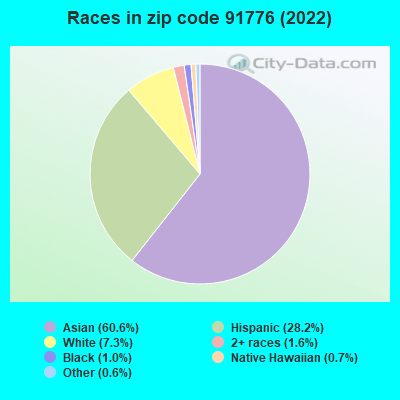
23.3% of residents of 91776 zip code speak English at home.
17.8% of residents speak Spanish at home (69% very well, 14% well, 10% not well, 7% not at all).
1.3% of residents speak other Indo-European language at home (85% very well, 11% well, 4% not well).
56.7% of residents speak Asian or Pacific Island language at home (30% very well, 25% well, 28% not well, 17% not at all).
0.8% of residents speak other language at home (100% very well).
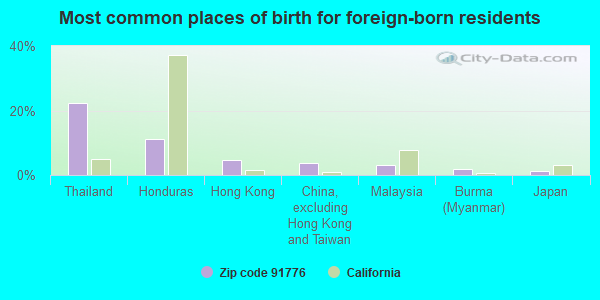
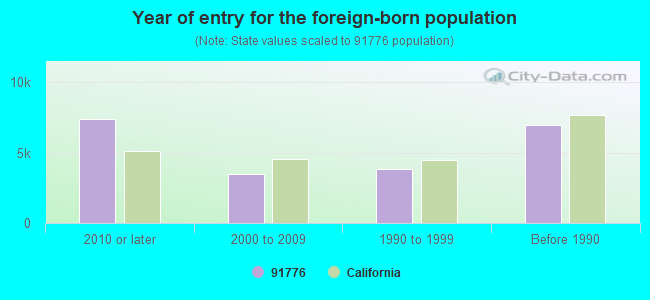
Foreign born population: 21,138 (57.1%) (59.0% of them are naturalized citizens)
Major facilities with environmental interests located in this zip code:
ALHAMBRA USD SAN GABRIEL HIGH SCHOOL (801 RAMONA ST in SAN GABRIEL, CA)
STATE MASTER (California - Hazardous Waste Tracking) - HAZARDOU WASTE PROGRAM (National Center for Education Statistics) - STATE ID-1937697 Small Quantity Generators, between 100 kg and 1000 kg of hazardous waste/month (Resource Conservation and Recovery Act (tracking hazardous waste)) - notification Organizations: ALHAMBRA SCHOOL DIST (CONTACT/OWNER)
, ALHAMBRA CITY HIGH (SCHOOL DISTRICT)
NEW CENTURY FORD (650 E LAS TUNAS DR in SAN GABRIEL, CA)
STATE MASTER (California - Hazardous Waste Tracking) - HAZARDOU WASTE PROGRAM Large Quantity Generators, more that 1000 kg of hazardous waste/month (Resource Conservation and Recovery Act (tracking hazardous waste)) - notification Organizations: DENNIS LIN (CONTACT/OWNER)
AMERICAN FURNITURE SYSTEMS (808 W SANTA ANITA in SAN GABRIEL, CA)
STATE MASTER (California - Hazardous Waste Tracking) - HAZARDOU WASTE PROGRAM CRITERIA AND HAZARDOUS AIR POLLUTANT INVENTORY (Inventory of air pollution sources) Small Quantity Generators, between 100 kg and 1000 kg of hazardous waste/month (Resource Conservation and Recovery Act (tracking hazardous waste)) - notification Business SIC classification: OFFICE FURNITURE, EXCEPT WOOD Organizations: CORPORATION (CONTACT/OWNER)
IKEDA LAWN MOWER (121 S SAN GABRIEL BLVD in SAN GABRIEL, CA)
STATE MASTER (California - Hazardous Waste Tracking) - HAZARDOU WASTE PROGRAM Small Quantity Generators, between 100 kg and 1000 kg of hazardous waste/month (Resource Conservation and Recovery Act (tracking hazardous waste)) - notification Organizations: TOSHIHARU IKEDA (CONTACT/OWNER)
ALL CAR SPECIALISTS INC (330 S DEL MAR in SAN GABRIEL, CA)
STATE MASTER (California - Hazardous Waste Tracking) - HAZARDOU WASTE PROGRAM Small Quantity Generators, between 100 kg and 1000 kg of hazardous waste/month (Resource Conservation and Recovery Act (tracking hazardous waste)) - notification Business NAICS classification: GENERAL AUTOMOTIVE REPAIR. Organizations: PAUL BROW (CONTACT/OWNER)
EQUILON ENTERPRISES (1861 S SAN GABRIEL in SAN GABRIEL, CA) . Federal Facility
STATE MASTER (California - Hazardous Waste Tracking) - HAZARDOU WASTE PROGRAM Small Quantity Generators, between 100 kg and 1000 kg of hazardous waste/month (Resource Conservation and Recovery Act (tracking hazardous waste)) - notification Organizations: EQUILON ENTERPRISES, LLC (CONTACT/OWNER)
Alternative names: SHELL OIL CO
CAPITOL IMPORTS (950 S SAN GABRIEL in SAN GABRIEL, CA)
STATE MASTER (California - Hazardous Waste Tracking) - HAZARDOU WASTE PROGRAM Small Quantity Generators, between 100 kg and 1000 kg of hazardous waste/month (Resource Conservation and Recovery Act (tracking hazardous waste)) - notification Alternative names: CAPITAL FOREIGN AUTO INC/DBA CAPITAL
EXXONMOBIL OIL CORPORATION (801 EAST VALLEY BOULEVARD in SAN GABRIEL, CA)
Small Quantity Generators, between 100 kg and 1000 kg of hazardous waste/month (Resource Conservation and Recovery Act (tracking hazardous waste)) HAZARDOUS WASTE BIENNIAL REPORTER (Resource Conservation and Recovery Act (tracking hazardous waste)) Large Quantity Generators, more that 1000 kg of hazardous waste/month (Resource Conservation and Recovery Act (tracking hazardous waste)) Alternative names: MOBIL OIL CORP HOY
GABRIELINO HIGH (1440 LAFAYETTE ST. in SAN GABRIEL, CA)
(National Center for Education Statistics) - STATE ID-1995810 Organizations: SAN GABRIEL UNIFIED (SCHOOL DISTRICT)
JEFFERSON INTERMEDIATE (1340 E. LIVE OAK ST. in SAN GABRIEL, CA)
(National Center for Education Statistics) - STATE ID-6022438 Organizations: SAN GABRIEL UNIFIED (SCHOOL DISTRICT)
MARSHALL(JOHN) ELEMENTARY (1817 S. JACKSON AVE. in SAN GABRIEL, CA)
(National Center for Education Statistics) - STATE ID-6013569 Organizations: GARVEY ELEMENTARY (SCHOOL DISTRICT)
MCKINLEY ELEMENTARY (1425 MANLEY DR. in SAN GABRIEL, CA)
(National Center for Education Statistics) - STATE ID-6022453 Organizations: SAN GABRIEL UNIFIED (SCHOOL DISTRICT)
EXXONMOBIL OIL CORP. (730 E LAS TUNAS DR in SAN GABRIEL, CA)
HAZARDOUS WASTE BIENNIAL REPORTER (Resource Conservation and Recovery Act (tracking hazardous waste)) Large Quantity Generators, more that 1000 kg of hazardous waste/month (Resource Conservation and Recovery Act (tracking hazardous waste)) Organizations: EXXONMOBIL OIL CORPORATION (CONTACT/OWNER)
Housing units lacking complete plumbing facilities: 0.1% Housing units lacking complete kitchen facilities: 5.7%
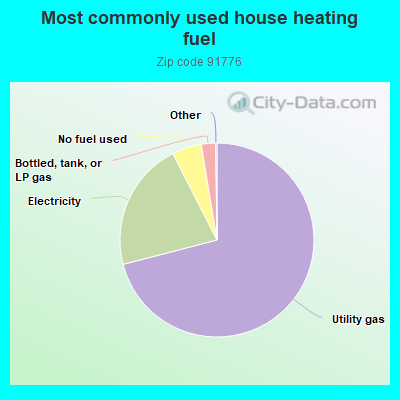
70.9%Utility gas
21.5%Electricity
4.9%No fuel used
2.4%Bottled, tank, or LP gas
Population in 1990: 34,995. Population change in the 1990s: +3,037 (+8.7%).
Place of birth for U.S.-born residents:
This state: 14,501
Northeast: 399
Midwest: 456
South: 278
West: 242
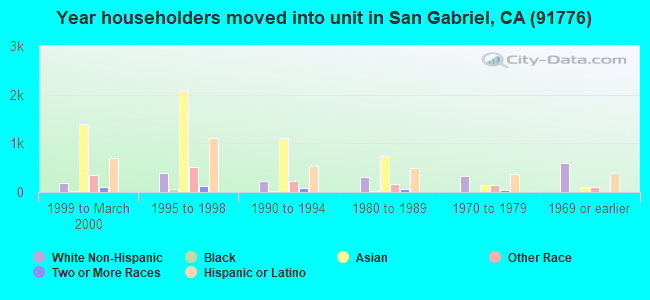
61% of the 91776 zip code residents lived in the same house 5 years ago. Out of people who lived in different houses, 91% lived in this county. Out of people who lived in different counties, 50% lived in California.
95% of the 91776 zip code residents lived in the same house 1 year ago. Out of people who lived in different houses, 72% moved from this county. Out of people who lived in different houses, 9% moved from different county within same state. Out of people who lived in different houses, 12% moved from different state. Out of people who lived in different houses, 13% moved from abroad.
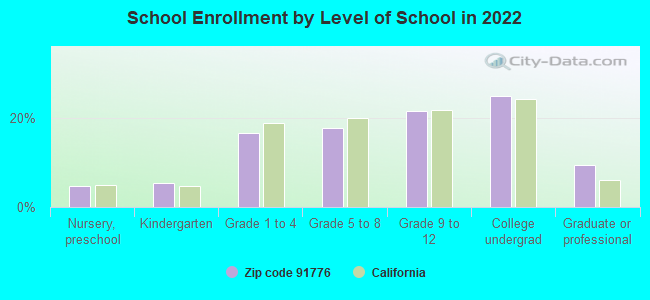
Private vs. public school enrollment:
Students in private schools in grades 1 to 8 (elementary and middle school): 98
Here:
3.8%
California:
10.5%
Students in private schools in grades 9 to 12 (high school): 64
Here:
4.0%
California:
8.5%
Students in private undergraduate colleges: 130
Here:
7.0%
California:
15.9%
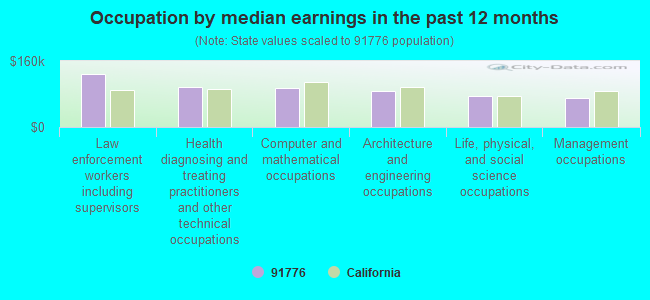
Occupation by median earnings in the past 12 months ($)
128,054Law enforcement workers including supervisors
96,868Health diagnosing and treating practitioners and other technical occupations
94,167Computer and mathematical occupations
86,450Architecture and engineering occupations
75,872Life, physical, and social science occupations
69,342Management occupations
Companies with federal contracts located in this zip code:
IMPERIAL COMPUTER CORPORATION (318 S SAN GABRIEL BLVD U in SAN GABRIEL, CA; small business) : $11,398,555 in 986 contractsfrom 2000 to 2006
Contracts for ADPE System Configuration, ADP Central Processing Unit (CPU, Computer), Digital by Defense Logistics Agency, Department of Defense, American Forces Information Service, Navy, and others Signed by year:2000: $154,100; 2001: $50,630; 2002: $304,695; 2003: $1,214,180; 2004: $2,755,030; 2005: $5,211,270; 2006: $1,708,650.
Biggest contracts:
$351,000 with Defense Logistics Agency for ADPE System Configuration. Signed on 2005-03-26. Completion date: 2005-09-30.
$234,000, same as above.Signed on 2005-03-26. Completion date: 2005-09-30.
$224,640, same as above.Signed on 2005-04-06. Completion date: 2005-05-07.
$154,100 with Department of Defense for ADPE System Configuration. Signed on 2000-07-12. Completion date: 2000-08-07.
EVER HAN CORPORATION (5122 WALNUT GROVE AVENUE in SAN GABRIEL, CA; small business) : $193,650 in 5 contractsfrom 2001 to 2002
Contracts for ADPE System Configuration, Optical Instruments, Test Equipment, Components and Accessories, ADP Support Equipment by Air Force, Geological Survey Signed by year:2000: $0; 2001: $61,973; 2002: $131,677; 2003: $0; 2004: $0; 2005: $0; 2006: $0.
Biggest contracts:
$160,400 with Air Force for ADPE System Configuration. Signed on 2002-09-30. Completion date: 2003-01-05.
$61,973 with Air Force for Optical Instruments, Test Equipment, Components and Accessories. Signed on 2001-11-08. Completion date: 2002-04-15.
$25,000 with Geological Survey for ADP Support Equipment. Taking place in VA. Signed on 2002-03-15. Completion date: 2002-04-15.
$8,250 with Air Force for ADP Support Equipment. Signed on 2002-09-30. Completion date: 2002-10-31.
Top industries in this zip code by the number of employees in 2005:
2005 - 2018 National Fire Incident Reporting System (NFIRS) incidents
According to the data from the years 2005 - 2018 the average number of fires per year is 10. The highest number of fires - 31 took place in 2010, and the least - 1 in 2016. The data has a decreasing trend.
When looking into fire subcategories, the most incidents belonged to: Structure Fires (70.1%), and Outside Fires (16.4%).
Fire incident types reported to NFIRS in Zip Code 91776


 Nearest zip codes: 91775, 91770, 91801, 91108, 91780, 91755.


 According to the data from the years 2005 - 2018 the average number of fires per year is 10. The highest number of fires - 31 took place in 2010, and the least - 1 in 2016. The data has a decreasing trend.
 When looking into fire subcategories, the most incidents belonged to: Structure Fires (70.1%), and Outside Fires (16.4%).