Estimated zip code population in 2022: 52,877 Zip code population in 2010: 52,735 Zip code population in 2000: 54,381
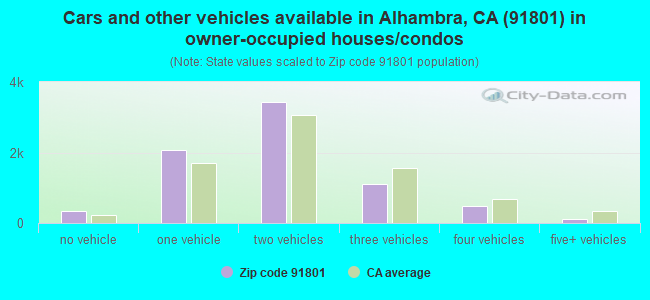
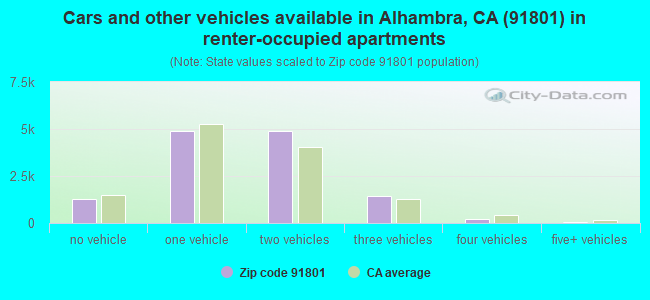
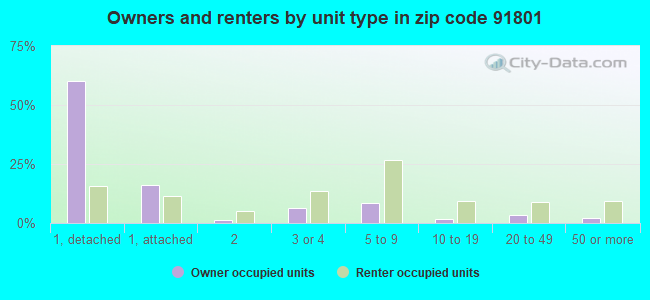
Houses and condos: 21,870 Renter-occupied apartments: 12,757
% of renters here:
63%
State:
44%
March 2022 cost of living index in zip code 91801: 137.0 (high, U.S. average is 100)
Land area: 4.4 sq. mi. Water area: 0.0 sq. mi.
Population density: 12,134 people per square mile
(very high).
OSM Map
General Map
Google Map
MSN Map
OSM Map
General Map
Google Map
MSN Map
OSM Map
General Map
Google Map
MSN Map
OSM Map
General Map
Google Map
MSN Map
Please wait while loading the map...
Real estate property taxes paid for housing units in 2022:
This zip code:
0.7% ($5,575)
California:
0.7% ($4,831)
Median real estate property taxes paid for housing units with mortgages in 2022: $6,038 (0.7%) Median real estate property taxes paid for housing units with no mortgage in 2022: $5,096 (0.6%)
Estimated median house/condo value in 2022: $826,439
91801:
$826,439
California:
$715,900
According to our research of California and other state lists, there were 37 registered sex offenders living in 91801 zip code as of April 27, 2024. The ratio of all residents to sex offenders in zip code 91801 is 1,515 to 1. The ratio of registered sex offenders to all residents in this zip code is lower than the state average.
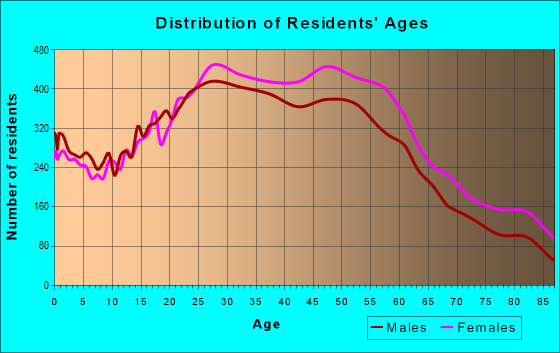
Median resident age:
This zip code:
41.7 years
California median age:
37.9 years
Average household size:
This zip code:
2.6 people
California:
2.8 people
Averages for the 2020 tax year for zip code 91801, filed in 2021:
Average Adjusted Gross Income (AGI) in 2020: $59,217 (Individual Income Tax Returns)
Here:
$59,217
State:
$95,910
Salary/wage: $54,796 (reported on 77.7% of returns)
Here:
$54,796
State:
$77,331
(% of AGI for various income ranges: 1094.0% for AGIs below $25k, 3881.3% for AGIs $25k-50k, 7546.8% for AGIs $50k-75k, 11287.8% for AGIs $75k-100k, 19930.8% for AGIs $100k-200k, 71781.5% for AGIs over 200k)
Taxable interest for individuals: $1,505 (reported on 31.4% of returns)
This zip code:
$1,505
California:
$2,294
(% of AGI for various income ranges: 29.8% for AGIs below $25k, 37.6% for AGIs $25k-50k, 53.7% for AGIs $50k-75k, 97.6% for AGIs $75k-100k, 199.8% for AGIs $100k-200k, 1107.8% for AGIs over 200k)
Ordinary dividends: $3,469 (reported on 18.4% of returns)
Here:
$3,469
State:
$10,949
(% of AGI for various income ranges: 22.1% for AGIs below $25k, 30.7% for AGIs $25k-50k, 76.8% for AGIs $50k-75k, 106.4% for AGIs $75k-100k, 325.3% for AGIs $100k-200k, 2011.9% for AGIs over 200k)
Net capital gain/loss in AGI: +$13,166 (reported on 19.8% of returns)
Here:
+$13,166
State:
+$49,306
(% of AGI for various income ranges: 7.7% for AGIs below $25k, 36.5% for AGIs $25k-50k, 92.1% for AGIs $50k-75k, 216.8% for AGIs $75k-100k, 739.1% for AGIs $100k-200k, 18684.4% for AGIs over 200k)
Profit/loss from business: +$8,881 (reported on 21.9% of returns)
Here:
+$8,881
State:
+$15,671
(% of AGI for various income ranges: 269.8% for AGIs below $25k, 240.0% for AGIs $25k-50k, 197.5% for AGIs $50k-75k, 237.9% for AGIs $75k-100k, 506.7% for AGIs $100k-200k, 3040.0% for AGIs over 200k)
Taxable individual retirement arrangement distribution: $15,637 (reported on 5.0% of returns)
91801:
$15,637
California:
$23,505
(% of AGI for various income ranges: 38.3% for AGIs below $25k, 54.4% for AGIs $25k-50k, 104.6% for AGIs $50k-75k, 159.4% for AGIs $75k-100k, 402.6% for AGIs $100k-200k, 1528.5% for AGIs over 200k)
Self-employed (Keogh) retirement plans: $30,345 (reported on 0.4% of returns)
91801:
$30,345
California:
$30,163
(% of AGI for various income ranges: 4.6% for AGIs $25k-50k, 56.1% for AGIs $100k-200k, 798.9% for AGIs over 200k)
Total itemized deductions: $31,493 (reported on 9.1% of returns)
Here:
$31,493
State:
$39,517
(% of AGI for various income ranges: 55.9% for AGIs below $25k, 129.2% for AGIs $25k-50k, 326.6% for AGIs $50k-75k, 683.0% for AGIs $75k-100k, 1658.7% for AGIs $100k-200k, 7778.1% for AGIs over 200k)
Charity contributions: $6,248 (reported on 7.3% of returns)
Here:
$6,248
State:
$12,598
(% of AGI for various income ranges: 3.5% for AGIs below $25k, 17.7% for AGIs $25k-50k, 40.8% for AGIs $50k-75k, 94.1% for AGIs $75k-100k, 270.2% for AGIs $100k-200k, 1583.0% for AGIs over 200k)
Taxes paid: $8,474 (reported on 9.0% of returns)
91801:
$8,474
State:
$8,807
(% of AGI for various income ranges: 12.1% for AGIs below $25k, 33.5% for AGIs $25k-50k, 85.2% for AGIs $50k-75k, 212.0% for AGIs $75k-100k, 494.0% for AGIs $100k-200k, 1680.4% for AGIs over 200k)
Earned income credit: $1,579 (reported on 16.9% of returns)
Here:
$1,579
State:
$2,074
(% of AGI for various income ranges: 72.9% for AGIs below $25k, 62.8% for AGIs $25k-50k, 0.6% for AGIs $50k-75k)
Percentage of individuals using paid preparers for their 2020 taxes: 91.5%
Here:
91%
State:
92%
(% for various income ranges: 90.4% for AGIs below $25k, 92.4% for AGIs $25k-50k, 91.6% for AGIs $50k-75k, 92.3% for AGIs $75k-100k, 91.7% for AGIs $100k-200k, 92.5% for AGIs over 200k)
Averages for the 2012 tax year for zip code 91801, filed in 2013:
Average Adjusted Gross Income (AGI) in 2012: $45,310 (Individual Income Tax Returns)
Here:
$45,310
State:
$72,726
Salary/wage: $43,461 (reported on 81.6% of returns)
Here:
$43,461
State:
$59,079
(% of AGI for various income ranges: 72.1% for AGIs below $25k, 85.6% for AGIs $25k-50k, 85.8% for AGIs $50k-75k, 81.6% for AGIs $75k-100k, 79.8% for AGIs $100k-200k, 53.9% for AGIs over 200k)
Taxable interest for individuals: $993 (reported on 32.8% of returns)
This zip code:
$993
California:
$2,146
(% of AGI for various income ranges: 1.1% for AGIs below $25k, 0.7% for AGIs $25k-50k, 0.4% for AGIs $50k-75k, 0.6% for AGIs $75k-100k, 0.7% for AGIs $100k-200k, 1.1% for AGIs over 200k)
Ordinary dividends: $4,394 (reported on 15.2% of returns)
Here:
$4,394
State:
$9,308
(% of AGI for various income ranges: 1.0% for AGIs below $25k, 0.6% for AGIs $25k-50k, 0.7% for AGIs $50k-75k, 1.0% for AGIs $75k-100k, 1.2% for AGIs $100k-200k, 5.6% for AGIs over 200k)
Net capital gain/loss in AGI: +$4,017 (reported on 14.0% of returns)
Here:
+$4,017
State:
+$30,460
(% of AGI for various income ranges: 0.1% for AGIs $50k-75k, 0.2% for AGIs $75k-100k, 1.2% for AGIs $100k-200k, 7.8% for AGIs over 200k)
Profit/loss from business: +$10,283 (reported on 20.0% of returns)
Here:
+$10,283
State:
+$17,064
(% of AGI for various income ranges: 16.5% for AGIs below $25k, 4.5% for AGIs $25k-50k, 2.2% for AGIs $50k-75k, 2.3% for AGIs $75k-100k, 2.6% for AGIs $100k-200k, 2.6% for AGIs over 200k)
Taxable individual retirement arrangement distribution: $13,844 (reported on 5.3% of returns)
91801:
$13,844
California:
$19,557
(% of AGI for various income ranges: 1.8% for AGIs below $25k, 1.2% for AGIs $25k-50k, 1.5% for AGIs $50k-75k, 1.3% for AGIs $75k-100k, 1.7% for AGIs $100k-200k, 2.5% for AGIs over 200k)
Self-employment retirement plans: $16,540 (reported on 0.4% of returns)
91801:
$16,540
California:
$24,530
(% of AGI for various income ranges: 0.2% for AGIs $50k-75k, 0.2% for AGIs $100k-200k, 0.6% for AGIs over 200k)
Total itemized deductions: $23,572 (25% of AGI, reported on 25.5% of returns)
Here:
$23,572
State:
$34,004
Here:
25.2% of AGI
State:
22.7% of AGI
(% of AGI for various income ranges: 7.0% for AGIs below $25k, 9.1% for AGIs $25k-50k, 12.9% for AGIs $50k-75k, 15.4% for AGIs $75k-100k, 17.9% for AGIs $100k-200k, 15.6% for AGIs over 200k)
Charity contributions: $3,055 (reported on 20.2% of returns)
Here:
$3,055
State:
$4,659
(% of AGI for various income ranges: 0.4% for AGIs below $25k, 0.9% for AGIs $25k-50k, 1.4% for AGIs $50k-75k, 1.7% for AGIs $75k-100k, 1.9% for AGIs $100k-200k, 1.8% for AGIs over 200k)
Taxes paid: $8,780 (reported on 25.4% of returns)
91801:
$8,780
State:
$14,448
(% of AGI for various income ranges: 1.5% for AGIs below $25k, 2.2% for AGIs $25k-50k, 3.9% for AGIs $50k-75k, 5.4% for AGIs $75k-100k, 7.4% for AGIs $100k-200k, 9.2% for AGIs over 200k)
Earned income credit: $1,871 (reported on 24.2% of returns)
Here:
$1,871
State:
$2,286
(% of AGI for various income ranges: 6.6% for AGIs below $25k, 1.1% for AGIs $25k-50k)
Percentage of individuals using paid preparers for their 2012 taxes: 67.1%
Here:
67%
State:
64%
(% for various income ranges: 67.7% for AGIs below $25k, 67.1% for AGIs $25k-50k, 65.7% for AGIs $50k-75k, 67.0% for AGIs $75k-100k, 64.0% for AGIs $100k-200k, 75.0% for AGIs over 200k)
Averages for the 2004 tax year for zip code 91801, filed in 2005:
Average Adjusted Gross Income (AGI) in 2004: $37,223 (Individual Income Tax Returns)
Here:
$37,223
State:
$58,600
Salary/wage: $36,116 (reported on 83.9% of returns)
Here:
$36,116
State:
$49,455
(% of AGI for various income ranges: 121.9% for AGIs below $10k, 80.9% for AGIs $10k-25k, 88.1% for AGIs $25k-50k, 86.0% for AGIs $50k-75k, 84.3% for AGIs $75k-100k, 65.6% for AGIs over 100k)
Taxable interest for individuals: $1,253 (reported on 43.7% of returns)
This zip code:
$1,253
California:
$2,365
(% of AGI for various income ranges: 6.2% for AGIs below $10k, 1.8% for AGIs $10k-25k, 1.2% for AGIs $25k-50k, 1.2% for AGIs $50k-75k, 1.3% for AGIs $75k-100k, 1.5% for AGIs over 100k)
Taxable dividends: $2,249 (reported on 17.3% of returns)
Here:
$2,249
State:
$4,746
(% of AGI for various income ranges: 2.6% for AGIs below $10k, 0.8% for AGIs $10k-25k, 0.6% for AGIs $25k-50k, 0.9% for AGIs $50k-75k, 0.8% for AGIs $75k-100k, 1.8% for AGIs over 100k)
Net capital gain/loss: +$7,419 (reported on 16.2% of returns)
Here:
+$7,419
State:
+$23,418
(% of AGI for various income ranges: -2.2% for AGIs below $10k, -0.1% for AGIs $10k-25k, -0.1% for AGIs $25k-50k, 0.6% for AGIs $50k-75k, 1.2% for AGIs $75k-100k, 12.2% for AGIs over 100k)
Profit/loss from business: +$9,737 (reported on 17.8% of returns)
Here:
+$9,737
State:
+$16,826
(% of AGI for various income ranges: 24.3% for AGIs below $10k, 9.7% for AGIs $10k-25k, 3.8% for AGIs $25k-50k, 2.4% for AGIs $50k-75k, 2.1% for AGIs $75k-100k, 4.7% for AGIs over 100k)
IRA payment deduction: $3,297 (reported on 5.0% of returns)
91801:
$3,297
California:
$3,192
(% of AGI for various income ranges: 0.6% for AGIs below $10k, 0.5% for AGIs $10k-25k, 0.7% for AGIs $25k-50k, 0.4% for AGIs $50k-75k, 0.3% for AGIs $75k-100k, 0.2% for AGIs over 100k)
Self-employed pension: $11,688 (reported on 0.6% of returns)
Here:
$11,688
California:
$17,688
(% of AGI for various income ranges: 0.1% for AGIs $10k-25k, 0.1% for AGIs $25k-50k, 0.1% for AGIs $50k-75k, 0.1% for AGIs $75k-100k, 0.5% for AGIs over 100k)
Total itemized deductions: $19,132 (27% of AGI, reported on 27.6% of returns)
Here:
$19,132
State:
$28,113
Here:
26.7% of AGI
State:
25.3% of AGI
(% of AGI for various income ranges: 13.2% for AGIs below $10k, 8.8% for AGIs $10k-25k, 11.2% for AGIs $25k-50k, 15.1% for AGIs $50k-75k, 17.2% for AGIs $75k-100k, 17.9% for AGIs over 100k)
Charity contributions deductions: $3,015 (4% of AGI, reported on 23.2% of returns)
Here:
$3,015
State:
$3,923
Here:
4.0% of AGI
State:
3.3% of AGI
(% of AGI for various income ranges: 0.7% for AGIs below $10k, 0.8% for AGIs $10k-25k, 1.3% for AGIs $25k-50k, 1.9% for AGIs $50k-75k, 2.3% for AGIs $75k-100k, 2.9% for AGIs over 100k)
Total tax: $5,080 (reported on 73.7% of returns)
91801:
$5,080
State:
$10,761
(% of AGI for various income ranges: 5.7% for AGIs below $10k, 4.2% for AGIs $10k-25k, 7.0% for AGIs $25k-50k, 9.7% for AGIs $50k-75k, 11.2% for AGIs $75k-100k, 16.4% for AGIs over 100k)
Earned income credit: $1,559 (reported on 21.0% of returns)
Here:
$1,559
State:
$1,763
Percentage of individuals using paid preparers for their 2004 taxes: 66.2%
Here:
66%
State:
66%
(% for various income ranges: 63.1% for AGIs below $10k, 69.5% for AGIs $10k-25k, 65.9% for AGIs $25k-50k, 63.8% for AGIs $50k-75k, 65.6% for AGIs $75k-100k, 68.8% for AGIs over 100k)
Likely homosexual households (counted as self-reported same-sex unmarried-partner households)
Lesbian couples: 0.4% of all households
Gay men: 0.4% of all households
Household received Food Stamps/SNAP in the past 12 months: 2,091 Household did not receive Food Stamps/SNAP in the past 12 months: 18,138
Women who had a birth in the past 12 months: 626 (457 now married, 168 unmarried) Women who did not have a birth in the past 12 months: 12,294 (5,235 now married, 7,044 unmarried)
Housing units in zip code 91801 with a mortgage: 4,708 (410 second mortgage, 38 home equity loan, 352 both second mortgage and home equity loan) Houses without a mortgage: 28
Median monthly owner costs for units with a mortgage: $2,859 Median monthly owner costs for units without a mortgage: $777
Residents with income below the poverty level in 2022:
This zip code:
10.8%
Whole state:
12.2%
Residents with income below 50% of the poverty level in 2022:
This zip code:
6.5%
Whole state:
6.2%
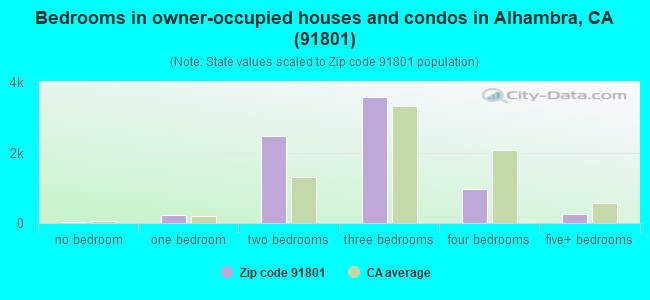
Median number of rooms in houses and condos:
Here:
5.3
State:
6.0
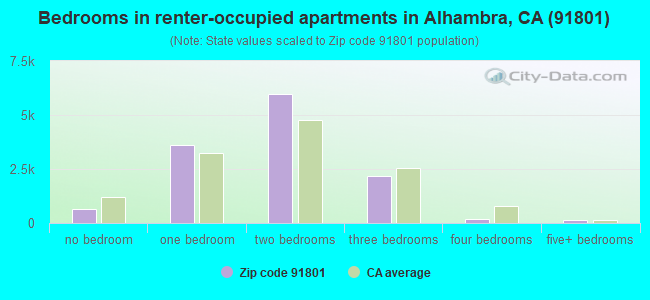
Median number of rooms in apartments:
Here:
3.8
State:
3.9
Notable locations in this zip code not listed on our city pages
Notable locations in zip code 91801: Alhambra Renaissance Entertainment Center (A), Almansor Municipal Golf Course (B), Jack Miller Memorial Library (C), Dorothy Hooper Library (D), City of Alhambra Fire Department Station 73 Northwest District (E), Alhambra Womans Club (F), Alhambra Public Library (G), Alhambra City Hall (H), City of Alhambra Fire Department Training Facility (I), City of Alhambra Fire Department Station 71 Headquarters (J), West San Gabriel Valley YMCA (K), Atherton Baptist Homes (L), Arte Flamenco Dance Theatre (M). Display/hide their locations on the map
Churches in zip code 91801 include: Alhambra True Light Presbyterian Church (A), All Souls Roman Catholic Church (B), Alhambra Assembly of God Church (C), Alhambra Christian Center (D), Alhambra Church of Religious Science (E), Alhambra Community Gospel Church (F), Alhambra Seven Day Adventist Church (G), All Souls Convent (H), Bethany Church of Alhambra (I). Display/hide their locations on the map
Parks in zip code 91801 include: Burke Park (1), Almansor Park (2), Lindaraka Park (3), Moor Field (4), Story Park (5), Alhambra Park (6), Joslyn Adult Recreation Center (7). Display/hide their locations on the map
5,814 married couples with children.
2,008 single-parent households (523 men, 1,485 women).
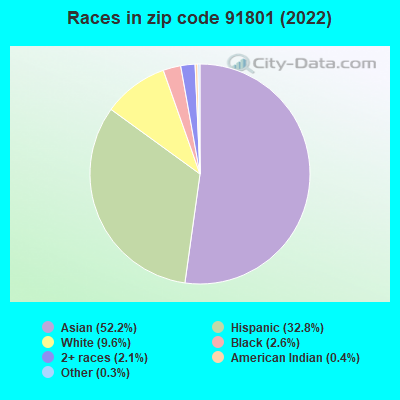
31.2% of residents of 91801 zip code speak English at home.
22.5% of residents speak Spanish at home (79% very well, 11% well, 8% not well, 2% not at all).
1.6% of residents speak other Indo-European language at home (81% very well, 14% well, 4% not well, 1% not at all).
44.7% of residents speak Asian or Pacific Island language at home (38% very well, 26% well, 26% not well, 10% not at all).
0.4% of residents speak other language at home (80% very well, 13% well, 8% not well).
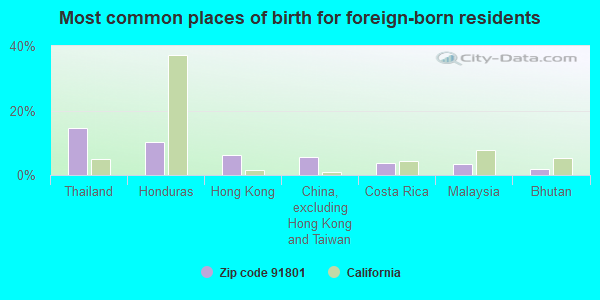
Foreign born population: 24,523 (46.4%) (66.3% of them are naturalized citizens)
Major facilities with environmental interests located in this zip code:
ALHAMBRA USD (101 S 2ND ST in ALHAMBRA, CA)
STATE MASTER (California - Hazardous Waste Tracking) - HAZARDOU WASTE PROGRAM COMPLIANCE ACTIVITY (Tracking inspections of insecticide, fungicide, and rodenticide, and toxic substances) (National Center for Education Statistics) - STATE ID-1930163 Small Quantity Generators, between 100 kg and 1000 kg of hazardous waste/month (Resource Conservation and Recovery Act (tracking hazardous waste)) - notification Organizations: ALHAMBRA SCHOOL DIST (CONTACT/OWNER)
, ALHAMBRA CITY HIGH (SCHOOL DISTRICT)
Alternative names: ALHAMBRA HIGH SCHOOL
GOUDY HONDA (1400 W MAIN ST in ALHAMBRA, CA)
STATE MASTER (California - Hazardous Waste Tracking) - HAZARDOU WASTE PROGRAM Small Quantity Generators, between 100 kg and 1000 kg of hazardous waste/month (Resource Conservation and Recovery Act (tracking hazardous waste)) - notification Small Quantity Generators, between 100 kg and 1000 kg of hazardous waste/month (Resource Conservation and Recovery Act (tracking hazardous waste)) - notification Business NAICS classification: AUTOMOTIVE BODY, PAINT, AND INTERIOR REPAIR AND MAINTENANCE. Organizations: ALHAMBRA MOTORS INC (CONTACT/OWNER)
, MITCHELL DRASCO JR (CONTACT/OWNER)
Alternative names: DRASCO BODY FENDER WORKS
ALHAMBRA CHRYSLER PLYMOUTH (1100 W MAIN ST in ALHAMBRA, CA)
STATE MASTER (California - Hazardous Waste Tracking) - HAZARDOU WASTE PROGRAM Large Quantity Generators, more that 1000 kg of hazardous waste/month (Resource Conservation and Recovery Act (tracking hazardous waste)) Organizations: ALHAMBRA CHRYSLER JEEP DODGE INC (CONTACT/OPERATOR)
, CHRYSLER REALTY COMP LLC (CONTACT/OWNER)
ALHAMBRA AUTO KRAFT (539 W MAIN ST in ALHAMBRA, CA)
STATE MASTER (California - Hazardous Waste Tracking) - HAZARDOU WASTE PROGRAM Small Quantity Generators, between 100 kg and 1000 kg of hazardous waste/month (Resource Conservation and Recovery Act (tracking hazardous waste)) - notification Business NAICS classification: AUTOMOTIVE BODY, PAINT, AND INTERIOR REPAIR AND MAINTENANCE. Organizations: HAROLD HALTOM (CONTACT/OWNER)
ALHAMBRA USD TRANSPORTATION DEPT (24 MARENGO AVE in ALHAMBRA, CA)
STATE MASTER (California - Hazardous Waste Tracking) - HAZARDOU WASTE PROGRAM Small Quantity Generators, between 100 kg and 1000 kg of hazardous waste/month (Resource Conservation and Recovery Act (tracking hazardous waste)) - notification Organizations: ALHAMBRA SCHOOL DIST (CONTACT/OWNER)
ALHAMBRA CITY OF (900 SOUTH NEW AVENUE in ALHAMBRA, CA)
STATE MASTER (California - Hazardous Waste Tracking) - HAZARDOU WASTE PROGRAM Small Quantity Generators, between 100 kg and 1000 kg of hazardous waste/month (Resource Conservation and Recovery Act (tracking hazardous waste)) - notification
CENTURY MOTOR SALES HYUNDAI (3001 W MAIN in ALHAMBRA, CA)
STATE MASTER (California - Hazardous Waste Tracking) - HAZARDOU WASTE PROGRAM Small Quantity Generators, between 100 kg and 1000 kg of hazardous waste/month (Resource Conservation and Recovery Act (tracking hazardous waste)) - notification Organizations: CEON PESKIN (CONTACT/OWNER)
Alternative names: NEW CENTURY HYUNDAI
ALHAMBRA USD MAINTENANCE & OPERATIONS (608 S PALM AVE in ALHAMBRA, CA)
STATE MASTER (California - Hazardous Waste Tracking) - HAZARDOU WASTE PROGRAM Small Quantity Generators, between 100 kg and 1000 kg of hazardous waste/month (Resource Conservation and Recovery Act (tracking hazardous waste)) - notification Organizations: ALHAMBRA SCHOOL DIST (CONTACT/OWNER)
ALHAMBRA USD MARK KEPPEL HIGH SCHOOL (510 HELLMAN AVE in ALHAMBRA, CA)
STATE MASTER (California - Hazardous Waste Tracking) - HAZARDOU WASTE PROGRAM Small Quantity Generators, between 100 kg and 1000 kg of hazardous waste/month (Resource Conservation and Recovery Act (tracking hazardous waste)) - notification Organizations: ALLARA PATTI RISK MGR (CONTACT/OWNER)
CHEVRON STATION 90199 (300 S ATLANTIC BLVD in ALHAMBRA, CA)
STATE MASTER (California - Hazardous Waste Tracking) - HAZARDOU WASTE PROGRAM Small Quantity Generators, between 100 kg and 1000 kg of hazardous waste/month (Resource Conservation and Recovery Act (tracking hazardous waste)) - notification Organizations: CHEVRON PRODUCTS CO (CONTACT/OWNER)
Alternative names: CHEVRON STATION 9 0199
FASHION CLEANERS (239 W MAIN ST in ALHAMBRA, CA)
STATE MASTER (California - Hazardous Waste Tracking) - HAZARDOU WASTE PROGRAM Small Quantity Generators, between 100 kg and 1000 kg of hazardous waste/month (Resource Conservation and Recovery Act (tracking hazardous waste)) - notification Organizations: TONY ARAMIAN (CONTACT/OWNER)
MARK KEPPEL HIGH (501 E. HELLMAN AVE. in ALHAMBRA, CA)
COMPLIANCE ACTIVITY (Tracking inspections of insecticide, fungicide, and rodenticide, and toxic substances) (National Center for Education Statistics) - STATE ID-1934553 Organizations: ALHAMBRA CITY HIGH (SCHOOL DISTRICT)
Alternative names: MARK KEPPEL HIGH SCHOOL
ALHAMBRA SD COMMUNITY DAY (15 W. ALHAMBRA RD. in ALHAMBRA, CA)
(National Center for Education Statistics) - STATE ID-1996396 Organizations: ALHAMBRA CITY HIGH (SCHOOL DISTRICT)
Housing units lacking complete plumbing facilities: 0.9% Housing units lacking complete kitchen facilities: 3.8%
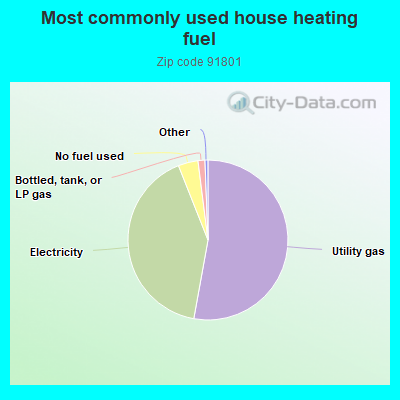
52.8%Utility gas
41.1%Electricity
4.0%No fuel used
1.4%Bottled, tank, or LP gas
Population in 1990: 51,148. Population change in the 1990s: +3,233 (+6.3%).
Place of birth for U.S.-born residents:
This state: 23,611
Northeast: 971
Midwest: 959
South: 1,524
West: 949
54% of the 91801 zip code residents lived in the same house 5 years ago. Out of people who lived in different houses, 88% lived in this county. Out of people who lived in different counties, 50% lived in California.
91% of the 91801 zip code residents lived in the same house 1 year ago. Out of people who lived in different houses, 80% moved from this county. Out of people who lived in different houses, 8% moved from different county within same state. Out of people who lived in different houses, 6% moved from different state. Out of people who lived in different houses, 5% moved from abroad.
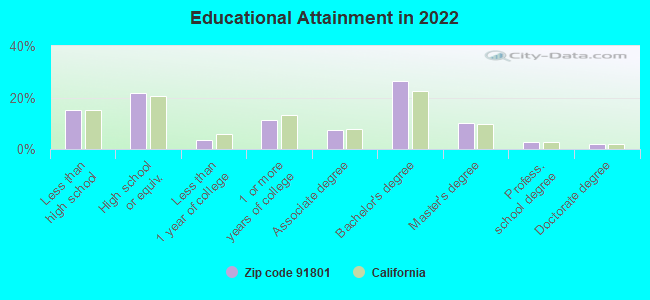
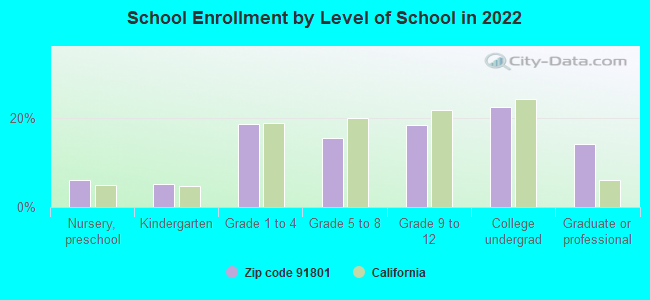
Private vs. public school enrollment:
Students in private schools in grades 1 to 8 (elementary and middle school): 369
Here:
10.2%
California:
10.5%
Students in private schools in grades 9 to 12 (high school): 173
Here:
8.9%
California:
8.5%
Students in private undergraduate colleges: 255
Here:
10.8%
California:
15.9%
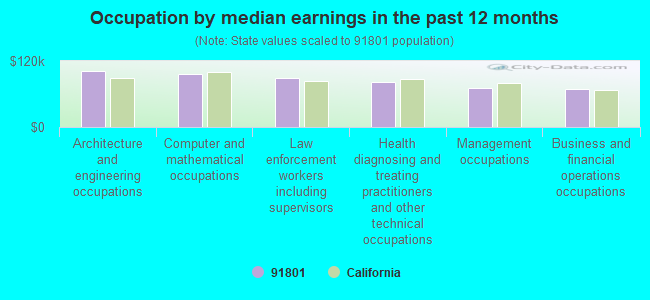
Occupation by median earnings in the past 12 months ($)
102,072Architecture and engineering occupations
95,619Computer and mathematical occupations
88,919Law enforcement workers including supervisors
82,521Health diagnosing and treating practitioners and other technical occupations
71,408Management occupations
69,279Business and financial operations occupations
Companies with federal contracts located in this zip code:
RANAJIT SAHU (311 NORTH STORY PLACE in ALHAMBRA, CA; small business) : $779,851 in 14 contractsfrom 2000 to 2005
Contracts for Expert Witness by Offices, Boards and Divisions (includes Attorney General, Deputy Attorney General, etc.) Signed by year:2000: $50,000; 2001: $203,000; 2002: $371,500; 2003: $0; 2004: $20,000; 2005: $135,351; 2006: $0.
Biggest contracts:
$221,500 with Offices, Boards and Divisions (includes Attorney General, Deputy Attorney General, etc.) for Expert Witness. Signed on 2002-12-15. Completion date: 2003-09-15.
$158,000, same as above.Signed on 2001-03-15. Completion date: 2001-09-15.
$93,750, same as above.Signed on 2005-02-15. Completion date: 2005-09-30.
$89,000, same as above.Signed on 2002-08-15. Completion date: 2002-09-15.
UNIONWAY INTERNATIONAL CORP (820 S GRFIELD AVE STE 202 in ALHAMBRA, CA; small business)
$3,050 with Army for ADP Input/Output and Storage Devices. Signed on 2004-09-30. Completion date: 2004-10-10.
Top industries in this zip code by the number of employees in 2005:
2005 - 2018 National Fire Incident Reporting System (NFIRS) incidents
According to the data from the years 2005 - 2018 the average number of fires per year is 68. The highest number of reported fire incidents - 178 took place in 2005, and the least - 6 in 2013. The data has a decreasing trend.
When looking into fire subcategories, the most incidents belonged to: Structure Fires (54.0%), and Outside Fires (22.9%).
Fire incident types reported to NFIRS in Zip Code 91801


 Nearest zip codes: 91803, 91776, 91030, 91108, 91754, 91755.
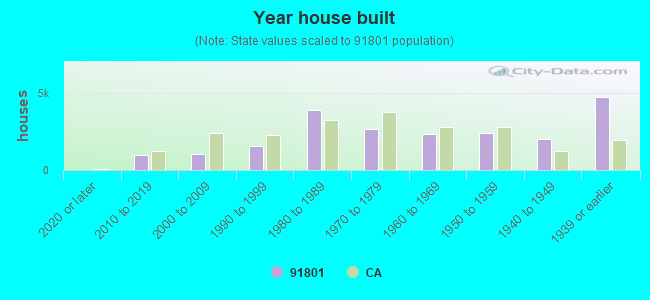


 According to the data from the years 2005 - 2018 the average number of fires per year is 68. The highest number of reported fire incidents - 178 took place in 2005, and the least - 6 in 2013. The data has a decreasing trend.
 When looking into fire subcategories, the most incidents belonged to: Structure Fires (54.0%), and Outside Fires (22.9%).