Estimated zip code population in 2022: 26,198
Zip code population in 2010: 27,496
Zip code population in 2000: 26,925
Houses and condos: 9,188
Renter-occupied apartments: 4,722
% of renters here:
55%State:
44%
March 2022 cost of living index in zip code 91755: 138.1
(high, U.S. average is 100)
Land area: 3.1
sq. mi.
Water area: 0.1
sq. mi.
Population density: 8,429 people per square mile (high).
OSM Map
General Map
Google Map
MSN Map
OSM Map
General Map
Google Map
MSN Map
OSM Map
General Map
Google Map
MSN Map
OSM Map
General Map
Google Map
MSN Map
Please wait while loading the map...
Real estate property taxes paid for housing units in 2022:
This zip code:
0.6% ($4,885)California:
0.7% ($4,831)
Median real estate property taxes paid for housing units with mortgages in 2022: $5,743 (0.7%)
Median real estate property taxes paid for housing units with no mortgage in 2022: $4,193 (0.5%)
Profiles of local businesses
Business Search - 14 Million verified businesses
Males: 12,583 Females: 13,615
For population 25 years and over in 91755:
High school or higher: 75.2%Bachelor's degree or higher: 29.7%Graduate or professional degree: 8.0%Unemployed: 4.9%Mean travel time to work (commute): 27.8 minutes
For population 15 years and over in 91755:
Never married: 33.2%Now married: 52.6%Separated: 1.0%Widowed: 6.9%Divorced: 6.3%
Zip code 91755 compared to state average:
Black race population percentage significantly below state average. Hispanic race population percentage below state average. Median age above state average. Foreign-born population percentage above state average. Length of stay since moving in significantly above state average. 18,487 70.6% Asian 5,767 22.0% Hispanic or Latino 1,200 4.6% White 468 1.8% Two or more races 139 0.5% Black 106 0.4% Some other race 28 0.1% American Indian
Data:
Median household income ($)
Median household income (% change since 2000)
Household income diversity
Ratio of average income to average house value (%)
Ratio of average income to average rent
Median household income ($) - White
Median household income ($) - Black or African American
Median household income ($) - Asian
Median household income ($) - Hispanic or Latino
Median household income ($) - American Indian and Alaska Native
Median household income ($) - Multirace
Median household income ($) - Other Race
Median household income for houses/condos with a mortgage ($)
Median household income for apartments without a mortgage ($)
Races - White alone (%)
Races - White alone (% change since 2000)
Races - Black alone (%)
Races - Black alone (% change since 2000)
Races - American Indian alone (%)
Races - American Indian alone (% change since 2000)
Races - Asian alone (%)
Races - Asian alone (% change since 2000)
Races - Hispanic (%)
Races - Hispanic (% change since 2000)
Races - Native Hawaiian and Other Pacific Islander alone (%)
Races - Native Hawaiian and Other Pacific Islander alone (% change since 2000)
Races - Two or more races (%)
Races - Two or more races (% change since 2000)
Races - Other race alone (%)
Races - Other race alone (% change since 2000)
Racial diversity
Unemployment (%)
Unemployment (% change since 2000)
Unemployment (%) - White
Unemployment (%) - Black or African American
Unemployment (%) - Asian
Unemployment (%) - Hispanic or Latino
Unemployment (%) - American Indian and Alaska Native
Unemployment (%) - Multirace
Unemployment (%) - Other Race
Population density (people per square mile)
Population - Males (%)
Population - Females (%)
Population - Males (%) - White
Population - Males (%) - Black or African American
Population - Males (%) - Asian
Population - Males (%) - Hispanic or Latino
Population - Males (%) - American Indian and Alaska Native
Population - Males (%) - Multirace
Population - Males (%) - Other Race
Population - Females (%) - White
Population - Females (%) - Black or African American
Population - Females (%) - Asian
Population - Females (%) - Hispanic or Latino
Population - Females (%) - American Indian and Alaska Native
Population - Females (%) - Multirace
Population - Females (%) - Other Race
Coronavirus confirmed cases (Apr 27, 2024)
Deaths caused by coronavirus (Apr 27, 2024)
Coronavirus confirmed cases (per 100k population) (Apr 27, 2024)
Deaths caused by coronavirus (per 100k population) (Apr 27, 2024)
Daily increase in number of cases (Apr 27, 2024)
Weekly increase in number of cases (Apr 27, 2024)
Cases doubled (in days) (Apr 27, 2024)
Hospitalized patients (Apr 18, 2022)
Negative test results (Apr 18, 2022)
Total test results (Apr 18, 2022)
COVID Vaccine doses distributed (per 100k population) (Sep 19, 2023)
COVID Vaccine doses administered (per 100k population) (Sep 19, 2023)
COVID Vaccine doses distributed (Sep 19, 2023)
COVID Vaccine doses administered (Sep 19, 2023)
Likely homosexual households (%)
Likely homosexual households (% change since 2000)
Likely homosexual households - Lesbian couples (%)
Likely homosexual households - Lesbian couples (% change since 2000)
Likely homosexual households - Gay men (%)
Likely homosexual households - Gay men (% change since 2000)
Cost of living index
Median gross rent ($)
Median contract rent ($)
Median monthly housing costs ($)
Median house or condo value ($)
Median house or condo value ($ change since 2000)
Mean house or condo value by units in structure - 1, detached ($)
Mean house or condo value by units in structure - 1, attached ($)
Mean house or condo value by units in structure - 2 ($)
Mean house or condo value by units in structure by units in structure - 3 or 4 ($)
Mean house or condo value by units in structure - 5 or more ($)
Mean house or condo value by units in structure - Boat, RV, van, etc. ($)
Mean house or condo value by units in structure - Mobile home ($)
Median house or condo value ($) - White
Median house or condo value ($) - Black or African American
Median house or condo value ($) - Asian
Median house or condo value ($) - Hispanic or Latino
Median house or condo value ($) - American Indian and Alaska Native
Median house or condo value ($) - Multirace
Median house or condo value ($) - Other Race
Median resident age
Resident age diversity
Median resident age - Males
Median resident age - Females
Median resident age - White
Median resident age - Black or African American
Median resident age - Asian
Median resident age - Hispanic or Latino
Median resident age - American Indian and Alaska Native
Median resident age - Multirace
Median resident age - Other Race
Median resident age - Males - White
Median resident age - Males - Black or African American
Median resident age - Males - Asian
Median resident age - Males - Hispanic or Latino
Median resident age - Males - American Indian and Alaska Native
Median resident age - Males - Multirace
Median resident age - Males - Other Race
Median resident age - Females - White
Median resident age - Females - Black or African American
Median resident age - Females - Asian
Median resident age - Females - Hispanic or Latino
Median resident age - Females - American Indian and Alaska Native
Median resident age - Females - Multirace
Median resident age - Females - Other Race
Commute - mean travel time to work (minutes)
Travel time to work - Less than 5 minutes (%)
Travel time to work - Less than 5 minutes (% change since 2000)
Travel time to work - 5 to 9 minutes (%)
Travel time to work - 5 to 9 minutes (% change since 2000)
Travel time to work - 10 to 19 minutes (%)
Travel time to work - 10 to 19 minutes (% change since 2000)
Travel time to work - 20 to 29 minutes (%)
Travel time to work - 20 to 29 minutes (% change since 2000)
Travel time to work - 30 to 39 minutes (%)
Travel time to work - 30 to 39 minutes (% change since 2000)
Travel time to work - 40 to 59 minutes (%)
Travel time to work - 40 to 59 minutes (% change since 2000)
Travel time to work - 60 to 89 minutes (%)
Travel time to work - 60 to 89 minutes (% change since 2000)
Travel time to work - 90 or more minutes (%)
Travel time to work - 90 or more minutes (% change since 2000)
Marital status - Never married (%)
Marital status - Now married (%)
Marital status - Separated (%)
Marital status - Widowed (%)
Marital status - Divorced (%)
Median family income ($)
Median family income (% change since 2000)
Median non-family income ($)
Median non-family income (% change since 2000)
Median per capita income ($)
Median per capita income (% change since 2000)
Median family income ($) - White
Median family income ($) - Black or African American
Median family income ($) - Asian
Median family income ($) - Hispanic or Latino
Median family income ($) - American Indian and Alaska Native
Median family income ($) - Multirace
Median family income ($) - Other Race
Median year house/condo built
Median year apartment built
Year house built - Built 2005 or later (%)
Year house built - Built 2000 to 2004 (%)
Year house built - Built 1990 to 1999 (%)
Year house built - Built 1980 to 1989 (%)
Year house built - Built 1970 to 1979 (%)
Year house built - Built 1960 to 1969 (%)
Year house built - Built 1950 to 1959 (%)
Year house built - Built 1940 to 1949 (%)
Year house built - Built 1939 or earlier (%)
Average household size
Household density (households per square mile)
Average household size - White
Average household size - Black or African American
Average household size - Asian
Average household size - Hispanic or Latino
Average household size - American Indian and Alaska Native
Average household size - Multirace
Average household size - Other Race
Occupied housing units (%)
Vacant housing units (%)
Owner occupied housing units (%)
Renter occupied housing units (%)
Vacancy status - For rent (%)
Vacancy status - For sale only (%)
Vacancy status - Rented or sold, not occupied (%)
Vacancy status - For seasonal, recreational, or occasional use (%)
Vacancy status - For migrant workers (%)
Vacancy status - Other vacant (%)
Residents with income below the poverty level (%)
Residents with income below 50% of the poverty level (%)
Children below poverty level (%)
Poor families by family type - Married-couple family (%)
Poor families by family type - Male, no wife present (%)
Poor families by family type - Female, no husband present (%)
Poverty status for native-born residents (%)
Poverty status for foreign-born residents (%)
Poverty among high school graduates not in families (%)
Poverty among people who did not graduate high school not in families (%)
Residents with income below the poverty level (%) - White
Residents with income below the poverty level (%) - Black or African American
Residents with income below the poverty level (%) - Asian
Residents with income below the poverty level (%) - Hispanic or Latino
Residents with income below the poverty level (%) - American Indian and Alaska Native
Residents with income below the poverty level (%) - Multirace
Residents with income below the poverty level (%) - Other Race
Air pollution - Air Quality Index (AQI)
Air pollution - CO
Air pollution - NO2
Air pollution - SO2
Air pollution - Ozone
Air pollution - PM10
Air pollution - PM25
Air pollution - Pb
Crime - Murders per 100,000 population
Crime - Rapes per 100,000 population
Crime - Robberies per 100,000 population
Crime - Assaults per 100,000 population
Crime - Burglaries per 100,000 population
Crime - Thefts per 100,000 population
Crime - Auto thefts per 100,000 population
Crime - Arson per 100,000 population
Crime - City-data.com crime index
Crime - Violent crime index
Crime - Property crime index
Crime - Murders per 100,000 population (5 year average)
Crime - Rapes per 100,000 population (5 year average)
Crime - Robberies per 100,000 population (5 year average)
Crime - Assaults per 100,000 population (5 year average)
Crime - Burglaries per 100,000 population (5 year average)
Crime - Thefts per 100,000 population (5 year average)
Crime - Auto thefts per 100,000 population (5 year average)
Crime - Arson per 100,000 population (5 year average)
Crime - City-data.com crime index (5 year average)
Crime - Violent crime index (5 year average)
Crime - Property crime index (5 year average)
1996 Presidential Elections Results (%) - Democratic Party (Clinton)
1996 Presidential Elections Results (%) - Republican Party (Dole)
1996 Presidential Elections Results (%) - Other
2000 Presidential Elections Results (%) - Democratic Party (Gore)
2000 Presidential Elections Results (%) - Republican Party (Bush)
2000 Presidential Elections Results (%) - Other
2004 Presidential Elections Results (%) - Democratic Party (Kerry)
2004 Presidential Elections Results (%) - Republican Party (Bush)
2004 Presidential Elections Results (%) - Other
2008 Presidential Elections Results (%) - Democratic Party (Obama)
2008 Presidential Elections Results (%) - Republican Party (McCain)
2008 Presidential Elections Results (%) - Other
2012 Presidential Elections Results (%) - Democratic Party (Obama)
2012 Presidential Elections Results (%) - Republican Party (Romney)
2012 Presidential Elections Results (%) - Other
2016 Presidential Elections Results (%) - Democratic Party (Clinton)
2016 Presidential Elections Results (%) - Republican Party (Trump)
2016 Presidential Elections Results (%) - Other
2020 Presidential Elections Results (%) - Democratic Party (Biden)
2020 Presidential Elections Results (%) - Republican Party (Trump)
2020 Presidential Elections Results (%) - Other
Ancestries Reported - Arab (%)
Ancestries Reported - Czech (%)
Ancestries Reported - Danish (%)
Ancestries Reported - Dutch (%)
Ancestries Reported - English (%)
Ancestries Reported - French (%)
Ancestries Reported - French Canadian (%)
Ancestries Reported - German (%)
Ancestries Reported - Greek (%)
Ancestries Reported - Hungarian (%)
Ancestries Reported - Irish (%)
Ancestries Reported - Italian (%)
Ancestries Reported - Lithuanian (%)
Ancestries Reported - Norwegian (%)
Ancestries Reported - Polish (%)
Ancestries Reported - Portuguese (%)
Ancestries Reported - Russian (%)
Ancestries Reported - Scotch-Irish (%)
Ancestries Reported - Scottish (%)
Ancestries Reported - Slovak (%)
Ancestries Reported - Subsaharan African (%)
Ancestries Reported - Swedish (%)
Ancestries Reported - Swiss (%)
Ancestries Reported - Ukrainian (%)
Ancestries Reported - United States (%)
Ancestries Reported - Welsh (%)
Ancestries Reported - West Indian (%)
Ancestries Reported - Other (%)
Educational Attainment - No schooling completed (%)
Educational Attainment - Less than high school (%)
Educational Attainment - High school or equivalent (%)
Educational Attainment - Less than 1 year of college (%)
Educational Attainment - 1 or more years of college (%)
Educational Attainment - Associate degree (%)
Educational Attainment - Bachelor's degree (%)
Educational Attainment - Master's degree (%)
Educational Attainment - Professional school degree (%)
Educational Attainment - Doctorate degree (%)
School Enrollment - Nursery, preschool (%)
School Enrollment - Kindergarten (%)
School Enrollment - Grade 1 to 4 (%)
School Enrollment - Grade 5 to 8 (%)
School Enrollment - Grade 9 to 12 (%)
School Enrollment - College undergrad (%)
School Enrollment - Graduate or professional (%)
School Enrollment - Not enrolled in school (%)
School enrollment - Public schools (%)
School enrollment - Private schools (%)
School enrollment - Not enrolled (%)
Median number of rooms in houses and condos
Median number of rooms in apartments
Housing units lacking complete plumbing facilities (%)
Housing units lacking complete kitchen facilities (%)
Density of houses
Urban houses (%)
Rural houses (%)
Households with people 60 years and over (%)
Households with people 65 years and over (%)
Households with people 75 years and over (%)
Households with one or more nonrelatives (%)
Households with no nonrelatives (%)
Population in households (%)
Family households (%)
Nonfamily households (%)
Population in families (%)
Family households with own children (%)
Median number of bedrooms in owner occupied houses
Mean number of bedrooms in owner occupied houses
Median number of bedrooms in renter occupied houses
Mean number of bedrooms in renter occupied houses
Median number of vehichles in owner occupied houses
Mean number of vehichles in owner occupied houses
Median number of vehichles in renter occupied houses
Mean number of vehichles in renter occupied houses
Mortgage status - with mortgage (%)
Mortgage status - with second mortgage (%)
Mortgage status - with home equity loan (%)
Mortgage status - with both second mortgage and home equity loan (%)
Mortgage status - without a mortgage (%)
Average family size
Average family size - White
Average family size - Black or African American
Average family size - Asian
Average family size - Hispanic or Latino
Average family size - American Indian and Alaska Native
Average family size - Multirace
Average family size - Other Race
Geographical mobility - Same house 1 year ago (%)
Geographical mobility - Moved within same county (%)
Geographical mobility - Moved from different county within same state (%)
Geographical mobility - Moved from different state (%)
Geographical mobility - Moved from abroad (%)
Place of birth - Born in state of residence (%)
Place of birth - Born in other state (%)
Place of birth - Native, outside of US (%)
Place of birth - Foreign born (%)
Housing units in structures - 1, detached (%)
Housing units in structures - 1, attached (%)
Housing units in structures - 2 (%)
Housing units in structures - 3 or 4 (%)
Housing units in structures - 5 to 9 (%)
Housing units in structures - 10 to 19 (%)
Housing units in structures - 20 to 49 (%)
Housing units in structures - 50 or more (%)
Housing units in structures - Mobile home (%)
Housing units in structures - Boat, RV, van, etc. (%)
House/condo owner moved in on average (years ago)
Renter moved in on average (years ago)
Year householder moved into unit - Moved in 1999 to March 2000 (%)
Year householder moved into unit - Moved in 1995 to 1998 (%)
Year householder moved into unit - Moved in 1990 to 1994 (%)
Year householder moved into unit - Moved in 1980 to 1989 (%)
Year householder moved into unit - Moved in 1970 to 1979 (%)
Year householder moved into unit - Moved in 1969 or earlier (%)
Means of transportation to work - Drove car alone (%)
Means of transportation to work - Carpooled (%)
Means of transportation to work - Public transportation (%)
Means of transportation to work - Bus or trolley bus (%)
Means of transportation to work - Streetcar or trolley car (%)
Means of transportation to work - Subway or elevated (%)
Means of transportation to work - Railroad (%)
Means of transportation to work - Ferryboat (%)
Means of transportation to work - Taxicab (%)
Means of transportation to work - Motorcycle (%)
Means of transportation to work - Bicycle (%)
Means of transportation to work - Walked (%)
Means of transportation to work - Other means (%)
Working at home (%)
Industry diversity
Most Common Industries - Agriculture, forestry, fishing and hunting, and mining (%)
Most Common Industries - Agriculture, forestry, fishing and hunting (%)
Most Common Industries - Mining, quarrying, and oil and gas extraction (%)
Most Common Industries - Construction (%)
Most Common Industries - Manufacturing (%)
Most Common Industries - Wholesale trade (%)
Most Common Industries - Retail trade (%)
Most Common Industries - Transportation and warehousing, and utilities (%)
Most Common Industries - Transportation and warehousing (%)
Most Common Industries - Utilities (%)
Most Common Industries - Information (%)
Most Common Industries - Finance and insurance, and real estate and rental and leasing (%)
Most Common Industries - Finance and insurance (%)
Most Common Industries - Real estate and rental and leasing (%)
Most Common Industries - Professional, scientific, and management, and administrative and waste management services (%)
Most Common Industries - Professional, scientific, and technical services (%)
Most Common Industries - Management of companies and enterprises (%)
Most Common Industries - Administrative and support and waste management services (%)
Most Common Industries - Educational services, and health care and social assistance (%)
Most Common Industries - Educational services (%)
Most Common Industries - Health care and social assistance (%)
Most Common Industries - Arts, entertainment, and recreation, and accommodation and food services (%)
Most Common Industries - Arts, entertainment, and recreation (%)
Most Common Industries - Accommodation and food services (%)
Most Common Industries - Other services, except public administration (%)
Most Common Industries - Public administration (%)
Occupation diversity
Most Common Occupations - Management, business, science, and arts occupations (%)
Most Common Occupations - Management, business, and financial occupations (%)
Most Common Occupations - Management occupations (%)
Most Common Occupations - Business and financial operations occupations (%)
Most Common Occupations - Computer, engineering, and science occupations (%)
Most Common Occupations - Computer and mathematical occupations (%)
Most Common Occupations - Architecture and engineering occupations (%)
Most Common Occupations - Life, physical, and social science occupations (%)
Most Common Occupations - Education, legal, community service, arts, and media occupations (%)
Most Common Occupations - Community and social service occupations (%)
Most Common Occupations - Legal occupations (%)
Most Common Occupations - Education, training, and library occupations (%)
Most Common Occupations - Arts, design, entertainment, sports, and media occupations (%)
Most Common Occupations - Healthcare practitioners and technical occupations (%)
Most Common Occupations - Health diagnosing and treating practitioners and other technical occupations (%)
Most Common Occupations - Health technologists and technicians (%)
Most Common Occupations - Service occupations (%)
Most Common Occupations - Healthcare support occupations (%)
Most Common Occupations - Protective service occupations (%)
Most Common Occupations - Fire fighting and prevention, and other protective service workers including supervisors (%)
Most Common Occupations - Law enforcement workers including supervisors (%)
Most Common Occupations - Food preparation and serving related occupations (%)
Most Common Occupations - Building and grounds cleaning and maintenance occupations (%)
Most Common Occupations - Personal care and service occupations (%)
Most Common Occupations - Sales and office occupations (%)
Most Common Occupations - Sales and related occupations (%)
Most Common Occupations - Office and administrative support occupations (%)
Most Common Occupations - Natural resources, construction, and maintenance occupations (%)
Most Common Occupations - Farming, fishing, and forestry occupations (%)
Most Common Occupations - Construction and extraction occupations (%)
Most Common Occupations - Installation, maintenance, and repair occupations (%)
Most Common Occupations - Production, transportation, and material moving occupations (%)
Most Common Occupations - Production occupations (%)
Most Common Occupations - Transportation occupations (%)
Most Common Occupations - Material moving occupations (%)
People in Group quarters - Institutionalized population (%)
People in Group quarters - Correctional institutions (%)
People in Group quarters - Federal prisons and detention centers (%)
People in Group quarters - Halfway houses (%)
People in Group quarters - Local jails and other confinement facilities (including police lockups) (%)
People in Group quarters - Military disciplinary barracks (%)
People in Group quarters - State prisons (%)
People in Group quarters - Other types of correctional institutions (%)
People in Group quarters - Nursing homes (%)
People in Group quarters - Hospitals/wards, hospices, and schools for the handicapped (%)
People in Group quarters - Hospitals/wards and hospices for chronically ill (%)
People in Group quarters - Hospices or homes for chronically ill (%)
People in Group quarters - Military hospitals or wards for chronically ill (%)
People in Group quarters - Other hospitals or wards for chronically ill (%)
People in Group quarters - Hospitals or wards for drug/alcohol abuse (%)
People in Group quarters - Mental (Psychiatric) hospitals or wards (%)
People in Group quarters - Schools, hospitals, or wards for the mentally retarded (%)
People in Group quarters - Schools, hospitals, or wards for the physically handicapped (%)
People in Group quarters - Institutions for the deaf (%)
People in Group quarters - Institutions for the blind (%)
People in Group quarters - Orthopedic wards and institutions for the physically handicapped (%)
People in Group quarters - Wards in general hospitals for patients who have no usual home elsewhere (%)
People in Group quarters - Wards in military hospitals for patients who have no usual home elsewhere (%)
People in Group quarters - Juvenile institutions (%)
People in Group quarters - Long-term care (%)
People in Group quarters - Homes for abused, dependent, and neglected children (%)
People in Group quarters - Residential treatment centers for emotionally disturbed children (%)
People in Group quarters - Training schools for juvenile delinquents (%)
People in Group quarters - Short-term care, detention or diagnostic centers for delinquent children (%)
People in Group quarters - Type of juvenile institution unknown (%)
People in Group quarters - Noninstitutionalized population (%)
People in Group quarters - College dormitories (includes college quarters off campus) (%)
People in Group quarters - Military quarters (%)
People in Group quarters - On base (%)
People in Group quarters - Barracks, unaccompanied personnel housing (UPH), (Enlisted/Officer), ;and similar group living quarters for military personnel (%)
People in Group quarters - Transient quarters for temporary residents (%)
People in Group quarters - Military ships (%)
People in Group quarters - Group homes (%)
People in Group quarters - Homes or halfway houses for drug/alcohol abuse (%)
People in Group quarters - Homes for the mentally ill (%)
People in Group quarters - Homes for the mentally retarded (%)
People in Group quarters - Homes for the physically handicapped (%)
People in Group quarters - Other group homes (%)
People in Group quarters - Religious group quarters (%)
People in Group quarters - Dormitories (%)
People in Group quarters - Agriculture workers' dormitories on farms (%)
People in Group quarters - Job Corps and vocational training facilities (%)
People in Group quarters - Other workers' dormitories (%)
People in Group quarters - Crews of maritime vessels (%)
People in Group quarters - Other nonhousehold living situations (%)
People in Group quarters - Other noninstitutional group quarters (%)
Residents speaking English at home (%)
Residents speaking English at home - Born in the United States (%)
Residents speaking English at home - Native, born elsewhere (%)
Residents speaking English at home - Foreign born (%)
Residents speaking Spanish at home (%)
Residents speaking Spanish at home - Born in the United States (%)
Residents speaking Spanish at home - Native, born elsewhere (%)
Residents speaking Spanish at home - Foreign born (%)
Residents speaking other language at home (%)
Residents speaking other language at home - Born in the United States (%)
Residents speaking other language at home - Native, born elsewhere (%)
Residents speaking other language at home - Foreign born (%)
Class of Workers - Employee of private company (%)
Class of Workers - Self-employed in own incorporated business (%)
Class of Workers - Private not-for-profit wage and salary workers (%)
Class of Workers - Local government workers (%)
Class of Workers - State government workers (%)
Class of Workers - Federal government workers (%)
Class of Workers - Self-employed workers in own not incorporated business and Unpaid family workers (%)
House heating fuel used in houses and condos - Utility gas (%)
House heating fuel used in houses and condos - Bottled, tank, or LP gas (%)
House heating fuel used in houses and condos - Electricity (%)
House heating fuel used in houses and condos - Fuel oil, kerosene, etc. (%)
House heating fuel used in houses and condos - Coal or coke (%)
House heating fuel used in houses and condos - Wood (%)
House heating fuel used in houses and condos - Solar energy (%)
House heating fuel used in houses and condos - Other fuel (%)
House heating fuel used in houses and condos - No fuel used (%)
House heating fuel used in apartments - Utility gas (%)
House heating fuel used in apartments - Bottled, tank, or LP gas (%)
House heating fuel used in apartments - Electricity (%)
House heating fuel used in apartments - Fuel oil, kerosene, etc. (%)
House heating fuel used in apartments - Coal or coke (%)
House heating fuel used in apartments - Wood (%)
House heating fuel used in apartments - Solar energy (%)
House heating fuel used in apartments - Other fuel (%)
House heating fuel used in apartments - No fuel used (%)
Armed forces status - In Armed Forces (%)
Armed forces status - Civilian (%)
Armed forces status - Civilian - Veteran (%)
Armed forces status - Civilian - Nonveteran (%)
Fatal accidents locations in years 2005-2021
Fatal accidents locations in 2005
Fatal accidents locations in 2006
Fatal accidents locations in 2007
Fatal accidents locations in 2008
Fatal accidents locations in 2009
Fatal accidents locations in 2010
Fatal accidents locations in 2011
Fatal accidents locations in 2012
Fatal accidents locations in 2013
Fatal accidents locations in 2014
Fatal accidents locations in 2015
Fatal accidents locations in 2016
Fatal accidents locations in 2017
Fatal accidents locations in 2018
Fatal accidents locations in 2019
Fatal accidents locations in 2020
Fatal accidents locations in 2021
Alcohol use - People drinking some alcohol every month (%)
Alcohol use - People not drinking at all (%)
Alcohol use - Average days/month drinking alcohol
Alcohol use - Average drinks/week
Alcohol use - Average days/year people drink much
Audiometry - Average condition of hearing (%)
Audiometry - People that can hear a whisper from across a quiet room (%)
Audiometry - People that can hear normal voice from across a quiet room (%)
Audiometry - Ears ringing, roaring, buzzing (%)
Audiometry - Had a job exposure to loud noise (%)
Audiometry - Had off-work exposure to loud noise (%)
Blood Pressure & Cholesterol - Has high blood pressure (%)
Blood Pressure & Cholesterol - Checking blood pressure at home (%)
Blood Pressure & Cholesterol - Frequently checking blood cholesterol (%)
Blood Pressure & Cholesterol - Has high cholesterol level (%)
Consumer Behavior - Money monthly spent on food at supermarket/grocery store
Consumer Behavior - Money monthly spent on food at other stores
Consumer Behavior - Money monthly spent on eating out
Consumer Behavior - Money monthly spent on carryout/delivered foods
Consumer Behavior - Income spent on food at supermarket/grocery store (%)
Consumer Behavior - Income spent on food at other stores (%)
Consumer Behavior - Income spent on eating out (%)
Consumer Behavior - Income spent on carryout/delivered foods (%)
Current Health Status - General health condition (%)
Current Health Status - Blood donors (%)
Current Health Status - Has blood ever tested for HIV virus (%)
Current Health Status - Left-handed people (%)
Dermatology - People using sunscreen (%)
Diabetes - Diabetics (%)
Diabetes - Had a blood test for high blood sugar (%)
Diabetes - People taking insulin (%)
Diet Behavior & Nutrition - Diet health (%)
Diet Behavior & Nutrition - Milk product consumption (# of products/month)
Diet Behavior & Nutrition - Meals not home prepared (#/week)
Diet Behavior & Nutrition - Meals from fast food or pizza place (#/week)
Diet Behavior & Nutrition - Ready-to-eat foods (#/month)
Diet Behavior & Nutrition - Frozen meals/pizza (#/month)
Drug Use - People that ever used marijuana or hashish (%)
Drug Use - Ever used hard drugs (%)
Drug Use - Ever used any form of cocaine (%)
Drug Use - Ever used heroin (%)
Drug Use - Ever used methamphetamine (%)
Health Insurance - People covered by health insurance (%)
Kidney Conditions-Urology - Avg. # of times urinating at night
Medical Conditions - People with asthma (%)
Medical Conditions - People with anemia (%)
Medical Conditions - People with psoriasis (%)
Medical Conditions - People with overweight (%)
Medical Conditions - Elderly people having difficulties in thinking or remembering (%)
Medical Conditions - People who ever received blood transfusion (%)
Medical Conditions - People having trouble seeing even with glass/contacts (%)
Medical Conditions - People with arthritis (%)
Medical Conditions - People with gout (%)
Medical Conditions - People with congestive heart failure (%)
Medical Conditions - People with coronary heart disease (%)
Medical Conditions - People with angina pectoris (%)
Medical Conditions - People who ever had heart attack (%)
Medical Conditions - People who ever had stroke (%)
Medical Conditions - People with emphysema (%)
Medical Conditions - People with thyroid problem (%)
Medical Conditions - People with chronic bronchitis (%)
Medical Conditions - People with any liver condition (%)
Medical Conditions - People who ever had cancer or malignancy (%)
Mental Health - People who have little interest in doing things (%)
Mental Health - People feeling down, depressed, or hopeless (%)
Mental Health - People who have trouble sleeping or sleeping too much (%)
Mental Health - People feeling tired or having little energy (%)
Mental Health - People with poor appetite or overeating (%)
Mental Health - People feeling bad about themself (%)
Mental Health - People who have trouble concentrating on things (%)
Mental Health - People moving or speaking slowly or too fast (%)
Mental Health - People having thoughts they would be better off dead (%)
Oral Health - Average years since last visit a dentist
Oral Health - People embarrassed because of mouth (%)
Oral Health - People with gum disease (%)
Oral Health - General health of teeth and gums (%)
Oral Health - Average days a week using dental floss/device
Oral Health - Average days a week using mouthwash for dental problem
Oral Health - Average number of teeth
Pesticide Use - Households using pesticides to control insects (%)
Pesticide Use - Households using pesticides to kill weeds (%)
Physical Activity - People doing vigorous-intensity work activities (%)
Physical Activity - People doing moderate-intensity work activities (%)
Physical Activity - People walking or bicycling (%)
Physical Activity - People doing vigorous-intensity recreational activities (%)
Physical Activity - People doing moderate-intensity recreational activities (%)
Physical Activity - Average hours a day doing sedentary activities
Physical Activity - Average hours a day watching TV or videos
Physical Activity - Average hours a day using computer
Physical Functioning - People having limitations keeping them from working (%)
Physical Functioning - People limited in amount of work they can do (%)
Physical Functioning - People that need special equipment to walk (%)
Physical Functioning - People experiencing confusion/memory problems (%)
Physical Functioning - People requiring special healthcare equipment (%)
Prescription Medications - Average number of prescription medicines taking
Preventive Aspirin Use - Adults 40+ taking low-dose aspirin (%)
Reproductive Health - Vaginal deliveries (%)
Reproductive Health - Cesarean deliveries (%)
Reproductive Health - Deliveries resulted in a live birth (%)
Reproductive Health - Pregnancies resulted in a delivery (%)
Reproductive Health - Women breastfeeding newborns (%)
Reproductive Health - Women that had a hysterectomy (%)
Reproductive Health - Women that had both ovaries removed (%)
Reproductive Health - Women that have ever taken birth control pills (%)
Reproductive Health - Women taking birth control pills (%)
Reproductive Health - Women that have ever used Depo-Provera or injectables (%)
Reproductive Health - Women that have ever used female hormones (%)
Sexual Behavior - People 18+ that ever had sex (vaginal, anal, or oral) (%)
Sexual Behavior - Males 18+ that ever had vaginal sex with a woman (%)
Sexual Behavior - Males 18+ that ever performed oral sex on a woman (%)
Sexual Behavior - Males 18+ that ever had anal sex with a woman (%)
Sexual Behavior - Males 18+ that ever had any sex with a man (%)
Sexual Behavior - Females 18+ that ever had vaginal sex with a man (%)
Sexual Behavior - Females 18+ that ever performed oral sex on a man (%)
Sexual Behavior - Females 18+ that ever had anal sex with a man (%)
Sexual Behavior - Females 18+ that ever had any kind of sex with a woman (%)
Sexual Behavior - Average age people first had sex
Sexual Behavior - Average number of female sex partners in lifetime (males 18+)
Sexual Behavior - Average number of female vaginal sex partners in lifetime (males 18+)
Sexual Behavior - Average age people first performed oral sex on a woman (18+)
Sexual Behavior - Average number of woman performed oral sex on in lifetime (18+)
Sexual Behavior - Average number of male sex partners in lifetime (males 18+)
Sexual Behavior - Average number of male anal sex partners in lifetime (males 18+)
Sexual Behavior - Average age people first performed oral sex on a man (18+)
Sexual Behavior - Average number of male oral sex partners in lifetime (18+)
Sexual Behavior - People using protection when performing oral sex (%)
Sexual Behavior - Average number of times people have vaginal or anal sex a year
Sexual Behavior - People having sex without condom (%)
Sexual Behavior - Average number of male sex partners in lifetime (females 18+)
Sexual Behavior - Average number of male vaginal sex partners in lifetime (females 18+)
Sexual Behavior - Average number of female sex partners in lifetime (females 18+)
Sexual Behavior - Circumcised males 18+ (%)
Sleep Disorders - Average hours sleeping at night
Sleep Disorders - People that has trouble sleeping (%)
Smoking-Cigarette Use - People smoking cigarettes (%)
Taste & Smell - People 40+ having problems with smell (%)
Taste & Smell - People 40+ having problems with taste (%)
Taste & Smell - People 40+ that ever had wisdom teeth removed (%)
Taste & Smell - People 40+ that ever had tonsils teeth removed (%)
Taste & Smell - People 40+ that ever had a loss of consciousness because of a head injury (%)
Taste & Smell - People 40+ that ever had a broken nose or other serious injury to face or skull (%)
Taste & Smell - People 40+ that ever had two or more sinus infections (%)
Weight - Average height (inches)
Weight - Average weight (pounds)
Weight - Average BMI
Weight - People that are obese (%)
Weight - People that ever were obese (%)
Weight - People trying to lose weight (%)
100%
urban population.
Estimated median house/condo value in 2022: $765,089
91755:
$765,089California:
$715,900
According to our research of California and other state lists, there were 11 registered sex offenders living in 91755 zip code as of April 26, 2024 . The ratio of all residents to sex offenders in zip code 91755 is 2,535 to 1.The ratio of registered sex offenders to all residents in this zip code is much lower than the state average.
Median resident age: This zip code:
45.8 yearsCalifornia median age:
37.9 years
Average household size: This zip code:
3.0 peopleCalifornia:
2.8 people
Averages for the 2020 tax year for zip code 91755, filed in 2021:
Average Adjusted Gross Income (AGI) in 2020: $49,554 (Individual Income Tax Returns) Here:
$49,554State:
$95,910
Salary/wage: $48,386 (reported on 65.9% of returns )Here:
$48,386State:
$77,331
(% of AGI for various income ranges: 840.9% for AGIs below $25k , 3602.4% for AGIs $25k-50k , 7649.7% for AGIs $50k-75k , 11021.0% for AGIs $75k-100k , 20631.0% for AGIs $100k-200k , 71364.6% for AGIs over 200k ) Taxable interest for individuals: $1,739 (reported on 28.7% of returns )This zip code:
$1,739California:
$2,294
(% of AGI for various income ranges: 24.6% for AGIs below $25k , 46.5% for AGIs $25k-50k , 97.2% for AGIs $50k-75k , 149.2% for AGIs $75k-100k , 268.2% for AGIs $100k-200k , 1528.5% for AGIs over 200k ) Ordinary dividends: $3,325 (reported on 16.5% of returns )(% of AGI for various income ranges: 16.4% for AGIs below $25k , 33.9% for AGIs $25k-50k , 67.8% for AGIs $50k-75k , 153.0% for AGIs $75k-100k , 332.9% for AGIs $100k-200k , 2457.7% for AGIs over 200k ) Net capital gain/loss in AGI: +$12,868 (reported on 17.9% of returns )Here:
+$12,868State:
+$49,306
(% of AGI for various income ranges: 9.5% for AGIs below $25k , 54.8% for AGIs $25k-50k , 116.2% for AGIs $50k-75k , 215.8% for AGIs $75k-100k , 965.1% for AGIs $100k-200k , 19603.8% for AGIs over 200k ) Profit/loss from business: +$8,285 (reported on 31.3% of returns )Here:
+$8,285State:
+$15,671
(% of AGI for various income ranges: 463.2% for AGIs below $25k , 498.4% for AGIs $25k-50k , 327.7% for AGIs $50k-75k , 248.5% for AGIs $75k-100k , 430.9% for AGIs $100k-200k , 1975.4% for AGIs over 200k ) Taxable individual retirement arrangement distribution: $15,238 (reported on 4.5% of returns )91755:
$15,238California:
$23,505
(% of AGI for various income ranges: 29.0% for AGIs below $25k , 58.3% for AGIs $25k-50k , 145.0% for AGIs $50k-75k , 269.3% for AGIs $75k-100k , 480.4% for AGIs $100k-200k , 1353.1% for AGIs over 200k ) Self-employed (Keogh) retirement plans: $17,233 (reported on 0.2% of returns )91755:
$17,233California:
$30,163
(% of AGI for various income ranges: 67.1% for AGIs $100k-200k ) Total itemized deductions: $33,341 (reported on 8.1% of returns )Here:
$33,341State:
$39,517
(% of AGI for various income ranges: 50.0% for AGIs below $25k , 142.6% for AGIs $25k-50k , 418.4% for AGIs $50k-75k , 826.0% for AGIs $75k-100k , 2093.2% for AGIs $100k-200k , 9683.8% for AGIs over 200k ) Charity contributions: $6,337 (reported on 6.2% of returns )(% of AGI for various income ranges: 2.1% for AGIs below $25k , 11.1% for AGIs $25k-50k , 52.5% for AGIs $50k-75k , 123.5% for AGIs $75k-100k , 339.0% for AGIs $100k-200k , 1619.2% for AGIs over 200k ) Taxes paid: $8,774 (reported on 8.1% of returns )(% of AGI for various income ranges: 13.9% for AGIs below $25k , 44.4% for AGIs $25k-50k , 128.1% for AGIs $50k-75k , 269.5% for AGIs $75k-100k , 619.7% for AGIs $100k-200k , 1612.3% for AGIs over 200k ) Earned income credit: $1,280 (reported on 24.3% of returns )(% of AGI for various income ranges: 70.1% for AGIs below $25k , 89.0% for AGIs $25k-50k , 1.6% for AGIs $50k-75k ) Percentage of individuals using paid preparers for their 2020 taxes: 89.0%(% for various income ranges: 87.5% for AGIs below $25k , 89.9% for AGIs $25k-50k , 91.7% for AGIs $50k-75k , 91.1% for AGIs $75k-100k , 89.5% for AGIs $100k-200k , 90.0% for AGIs over 200k )
Averages for the 2012 tax year for zip code 91755, filed in 2013:
Average Adjusted Gross Income (AGI) in 2012: $41,329 (Individual Income Tax Returns) Here:
$41,329State:
$72,726
Salary/wage: $41,082 (reported on 75.3% of returns )Here:
$41,082State:
$59,079
(% of AGI for various income ranges: 66.9% for AGIs below $25k , 81.5% for AGIs $25k-50k , 80.8% for AGIs $50k-75k , 79.0% for AGIs $75k-100k , 78.2% for AGIs $100k-200k , 51.9% for AGIs over 200k ) Taxable interest for individuals: $1,048 (reported on 34.2% of returns )This zip code:
$1,048California:
$2,146
(% of AGI for various income ranges: 1.1% for AGIs below $25k , 0.7% for AGIs $25k-50k , 0.9% for AGIs $50k-75k , 0.7% for AGIs $75k-100k , 0.8% for AGIs $100k-200k , 1.1% for AGIs over 200k ) Ordinary dividends: $2,961 (reported on 16.3% of returns )(% of AGI for various income ranges: 1.0% for AGIs below $25k , 1.0% for AGIs $25k-50k , 0.9% for AGIs $50k-75k , 0.9% for AGIs $75k-100k , 1.3% for AGIs $100k-200k , 2.1% for AGIs over 200k ) Net capital gain/loss in AGI: +$3,775 (reported on 14.6% of returns )Here:
+$3,775State:
+$30,460
(% of AGI for various income ranges: 0.4% for AGIs $50k-75k , 0.2% for AGIs $75k-100k , 0.8% for AGIs $100k-200k , 10.7% for AGIs over 200k ) Profit/loss from business: +$9,576 (reported on 25.4% of returns )Here:
+$9,576State:
+$17,064
(% of AGI for various income ranges: 23.2% for AGIs below $25k , 5.4% for AGIs $25k-50k , 2.3% for AGIs $50k-75k , 2.4% for AGIs $75k-100k , 1.9% for AGIs $100k-200k , 3.5% for AGIs over 200k ) Taxable individual retirement arrangement distribution: $11,621 (reported on 5.7% of returns )91755:
$11,621California:
$19,557
(% of AGI for various income ranges: 1.8% for AGIs below $25k , 1.6% for AGIs $25k-50k , 1.3% for AGIs $50k-75k , 1.8% for AGIs $75k-100k , 1.6% for AGIs $100k-200k , 1.2% for AGIs over 200k ) Self-employment retirement plans: $14,600 (reported on 0.3% of returns )91755:
$14,600California:
$24,530
Total itemized deductions: $23,535 (26% of AGI, reported on 25.3% of returns )Here:
$23,535State:
$34,004
Here:
25.8% of AGIState:
22.7% of AGI
(% of AGI for various income ranges: 6.3% for AGIs below $25k , 12.1% for AGIs $25k-50k , 14.2% for AGIs $50k-75k , 17.1% for AGIs $75k-100k , 18.3% for AGIs $100k-200k , 16.3% for AGIs over 200k ) Charity contributions: $2,801 (reported on 19.2% of returns )(% of AGI for various income ranges: 0.3% for AGIs below $25k , 0.9% for AGIs $25k-50k , 1.3% for AGIs $50k-75k , 1.6% for AGIs $75k-100k , 1.8% for AGIs $100k-200k , 1.7% for AGIs over 200k ) Taxes paid: $9,021 (reported on 25.1% of returns )91755:
$9,021State:
$14,448
(% of AGI for various income ranges: 1.5% for AGIs below $25k , 3.2% for AGIs $25k-50k , 4.8% for AGIs $50k-75k , 6.3% for AGIs $75k-100k , 8.1% for AGIs $100k-200k , 8.1% for AGIs over 200k ) Earned income credit: $1,594 (reported on 30.8% of returns )(% of AGI for various income ranges: 7.0% for AGIs below $25k , 1.0% for AGIs $25k-50k ) Percentage of individuals using paid preparers for their 2012 taxes: 67.9%(% for various income ranges: 66.8% for AGIs below $25k , 70.9% for AGIs $25k-50k , 69.3% for AGIs $50k-75k , 66.2% for AGIs $75k-100k , 65.7% for AGIs $100k-200k , 73.7% for AGIs over 200k )
Averages for the 2004 tax year for zip code 91755, filed in 2005:
Average Adjusted Gross Income (AGI) in 2004: $36,170 (Individual Income Tax Returns) Here:
$36,170State:
$58,600
Salary/wage: $34,571 (reported on 80.7% of returns )Here:
$34,571State:
$49,455
(% of AGI for various income ranges: 112.6% for AGIs below $10k , 77.4% for AGIs $10k-25k , 84.0% for AGIs $25k-50k , 81.3% for AGIs $50k-75k , 81.5% for AGIs $75k-100k , 63.1% for AGIs over 100k ) Taxable interest for individuals: $1,403 (reported on 47.7% of returns )This zip code:
$1,403California:
$2,365
(% of AGI for various income ranges: 5.6% for AGIs below $10k , 2.2% for AGIs $10k-25k , 1.7% for AGIs $25k-50k , 1.6% for AGIs $50k-75k , 1.7% for AGIs $75k-100k , 1.7% for AGIs over 100k ) Taxable dividends: $1,763 (reported on 19.5% of returns )(% of AGI for various income ranges: 3.8% for AGIs below $10k , 1.0% for AGIs $10k-25k , 0.6% for AGIs $25k-50k , 0.9% for AGIs $50k-75k , 0.9% for AGIs $75k-100k , 1.0% for AGIs over 100k ) Net capital gain/loss: +$7,868 (reported on 18.6% of returns )Here:
+$7,868State:
+$23,418
(% of AGI for various income ranges: -3.9% for AGIs below $10k , -0.7% for AGIs $10k-25k , 0.3% for AGIs $25k-50k , 0.6% for AGIs $50k-75k , 1.5% for AGIs $75k-100k , 13.8% for AGIs over 100k ) Profit/loss from business: +$9,803 (reported on 18.6% of returns )Here:
+$9,803State:
+$16,826
(% of AGI for various income ranges: 26.7% for AGIs below $10k , 10.0% for AGIs $10k-25k , 4.7% for AGIs $25k-50k , 3.1% for AGIs $50k-75k , 2.6% for AGIs $75k-100k , 3.6% for AGIs over 100k ) IRA payment deduction: $3,460 (reported on 5.4% of returns )91755:
$3,460California:
$3,192
(% of AGI for various income ranges: 0.3% for AGIs below $10k , 0.8% for AGIs $10k-25k , 0.8% for AGIs $25k-50k , 0.6% for AGIs $50k-75k , 0.3% for AGIs $75k-100k , 0.2% for AGIs over 100k ) Self-employed pension: $12,235 (reported on 0.6% of returns )Here:
$12,235California:
$17,688
(% of AGI for various income ranges: 0.1% for AGIs $25k-50k , 0.1% for AGIs $50k-75k , 0.3% for AGIs $75k-100k , 0.4% for AGIs over 100k ) Total itemized deductions: $19,498 (27% of AGI, reported on 28.2% of returns )Here:
$19,498State:
$28,113
Here:
26.9% of AGIState:
25.3% of AGI
(% of AGI for various income ranges: 14.9% for AGIs below $10k , 9.7% for AGIs $10k-25k , 13.1% for AGIs $25k-50k , 16.9% for AGIs $50k-75k , 19.2% for AGIs $75k-100k , 16.5% for AGIs over 100k ) Charity contributions deductions: $2,433 (3% of AGI, reported on 23.0% of returns )Here:
3.1% of AGIState:
3.3% of AGI
(% of AGI for various income ranges: 0.3% for AGIs below $10k , 0.6% for AGIs $10k-25k , 1.2% for AGIs $25k-50k , 1.7% for AGIs $50k-75k , 2.3% for AGIs $75k-100k , 2.0% for AGIs over 100k ) Total tax: $5,136 (reported on 71.7% of returns )91755:
$5,136State:
$10,761
(% of AGI for various income ranges: 6.1% for AGIs below $10k , 4.3% for AGIs $10k-25k , 6.9% for AGIs $25k-50k , 9.4% for AGIs $50k-75k , 10.7% for AGIs $75k-100k , 16.4% for AGIs over 100k ) Earned income credit: $1,525 (reported on 24.2% of returns )Percentage of individuals using paid preparers for their 2004 taxes: 66.6%(% for various income ranges: 65.2% for AGIs below $10k , 68.7% for AGIs $10k-25k , 66.8% for AGIs $25k-50k , 64.4% for AGIs $50k-75k , 64.5% for AGIs $75k-100k , 67.6% for AGIs over 100k )
Estimated median household income in 2022: This zip code:
$70,188California:
$91,551
Nearest zip codes: 91754 ,
91770 ,
90640 ,
91803 ,
91801 ,
91776 .
Monterey Park Zip Code Map
Percentage of family households: This zip code:
44.5%California:
46.8%
Percentage of households with unmarried partners: This zip code:
2.9%California:
48.1%
Likely homosexual households (counted as self-reported same-sex unmarried-partner households)
Lesbian couples: 0.1% of all households Gay men: 0.2% of all households
Household received Food Stamps/SNAP in the past 12 months: 899Household did not receive Food Stamps/SNAP in the past 12 months: 7,673
Women who had a birth in the past 12 months: 177 (149 now married , 27 unmarried) Women who did not have a birth in the past 12 months: 6,080 (2,693 now married , 3,374 unmarried)
Housing units in zip code 91755 with a mortgage: 2,033 (230
second mortgage , 32
home equity loan , 201
both second mortgage and home equity loan )
Houses without a mortgage: 26
Median monthly owner costs for units with a mortgage: $2,569
Median monthly owner costs for units without a mortgage: $732
Residents with income below the poverty level in 2022:
This zip code:
12.3%Whole state:
12.2%
Residents with income below 50% of the poverty level in 2022:
This zip code:
6.1%Whole state:
6.2%
Median number of rooms in houses and condos: Median number of rooms in apartments:
Year house built (houses)
0 2020 or later207 2010 to 2019615 2000 to 2009500 1990 to 19991,126 1980 to 19891,759 1970 to 19791,279 1960 to 19691,851 1950 to 19591,055 1940 to 1949584 1939 or earlier
Zip code 91755 household income distribution in 2022 602 Less than $10,000264 $10,000 to $14,999173 $15,000 to $19,999571 $20,000 to $24,999170 $25,000 to $29,999347 $30,000 to $34,999353 $35,000 to $39,999296 $40,000 to $44,999351 $45,000 to $49,999635 $50,000 to $59,999857 $60,000 to $74,999902 $75,000 to $99,999781 $100,000 to $124,999742 $125,000 to $149,999744 $150,000 to $199,999819 $200,000 or moreEstimate of home value of owner-occupied houses/condos in 2022 in zip code 91755 102 Less than $10,00010 $10,000 to $14,99948 $50,000 to $59,9998 $60,000 to $69,99911 $70,000 to $79,99914 $80,000 to $89,99918 $100,000 to $124,99913 $175,000 to $199,99922 $250,000 to $299,99973 $300,000 to $399,999279 $400,000 to $499,9991,568 $500,000 to $749,9991,401 $750,000 to $999,999371 $1,000,000 to $1,499,99952 $1,500,000 to $1,999,9996 $2,000,000 or moreRent paid by renters in 2022 in zip code 91755 8 $100 to $14981 $200 to $24939 $250 to $29938 $300 to $34983 $500 to $54974 $550 to $59910 $600 to $64947 $700 to $749101 $800 to $89951 $900 to $999330 $1,000 to $1,249685 $1,250 to $1,4991,454 $1,500 to $1,999902 $2,000 to $2,499226 $2,500 to $2,999226 $3,000 to $3,49916 $3,500 or more327 No cash rent
Median gross rent in 2022: $1,816.
Median price asked for vacant for-sale houses and condos in 2022: $829,564.
Estimated median house (or condo) value in 2022 for: White Non-Hispanic householders: $795,604American Indian or Alaska Native householders: $689,352Asian householders: $769,133Some other race householders: $823,913Two or more races householders: $782,368Hispanic or Latino householders: $808,472Estimated median house or condo value in 2022: $765,089
91755:
$765,089California:
$715,900
Lower value quartile - upper value quartile: $609,616 - $966,232
Mean price in 2022: Detached houses: $1,073,046Here:
$1,073,046State:
$988,808
Townhouses or other attached units: $995,437Here:
$995,437State:
$838,546
In 2-unit structures: $754,178Here:
$754,178State:
$1,138,100
In 3-to-4-unit structures: $2,090,773Here:
$2,090,773State:
$824,253
In 5-or-more-unit structures: $639,341Here:
$639,341State:
$730,996
Housing units in structures:
One, detached: 4,918One, attached: 1,089Two: 2393 or 4: 6095 to 9: 48710 to 19: 61820 to 49: 79250 or more: 404Mobile homes: 14Unemployment : 4.9%
Means of transportation to work in zip code 91755 65.2% 8,045 Drove a car alone14.5% 1,792 Carpooled2.2% 277 Bus or trolley bus0.1% 9 Streetcar or trolley car0.1% 8 Railroad0.2% 27 Taxi1.2% 152 Bicycle1.5% 187 Walked0.2% 30 Other means14.6% 1,797 Worked at homeTravel time to work (commute) in zip code 91755 79 Less than 5 minutes439 5 to 9 minutes1,241 10 to 14 minutes1,836 15 to 19 minutes1,708 20 to 24 minutes449 25 to 29 minutes1,840 30 to 34 minutes121 35 to 39 minutes598 40 to 44 minutes1,048 45 to 59 minutes914 60 to 89 minutes190 90 or more minutes
Neighborhoods in zip code 91755: Percentage of zip code residents living and working in this county: 96.0%
Household type by relationship:
Households: 26,198
Male householders: 4,574 (461 living alone ), Female householders: 4,037 (729 living alone )4,731 spouses (4,554 opposite-sex spouses ), 263 unmarried partners , (228 opposite-sex unmarried partners ), 7,060 children (6,853 natural , 79 adopted , 131 stepchildren ), 526 grandchildren , 574 brothers or sisters , 1,654 parents , 0 foster children , 879 other relatives , 1,585 non-relatives In group quarters: 247 (-1 institutionalized population )
Size of family households: 2,508 2-persons , 1,601 3-persons , 1,627 4-persons , 828 5-persons , 138 6-persons , 88 7-or-more-persons
Size of nonfamily households: 1,192 1-person , 228 2-persons , 147 3-persons , 162 4-persons , 11 5-persons , 20 6-persons , 18 7-or-more-persons
3,064 married couples with children. single-parent households (135 men , 607 women ).
23.2% of residents of 91755 zip code speak English at home. of residents speak Spanish at home (82% very well, 13% well, 4% not well, 1% not at all ).of residents speak other Indo-European language at home (63% very well, 20% well, 16% not well ).of residents speak Asian or Pacific Island language at home (31% very well, 22% well, 30% not well, 17% not at all ).of residents speak other language at home (89% very well, 11% not well ).
Foreign born population: 14,986 (57.2%)
(59.5%
of them are naturalized citizens )
This zip code:
57.2%Whole state:
26.7%
13% Thailand 7% China, excluding Hong Kong and Taiwan 4% Hong Kong 4% Honduras 2% Burma (Myanmar) 2% Malaysia 2% Taiwan 1% American 0% Italian 0% Jordanian 0% English 0% European 0% Northern European 0% German
Year of entry for the foreign-born population
5,434 2010 or later 2,419 2000 to 2009 2,270 1990 to 1999 5,344 Before 1990
There are
51 Medical Specialists in Zip Code 91755 .
Facilities with environmental interests located in this zip code:
HILLCREST ELEMENTARY (795 PEPPER ST. in MONTEREY PARK, CA)
(National Center for Education Statistics) - STATE ID-6013551 Organizations: GARVEY ELEMENTARY (SCHOOL DISTRICT)
MACY INTERMEDIATE (2101 S. LUPINE AVE. in MONTEREY PARK, CA)
(National Center for Education Statistics) - STATE ID-6020572 Organizations: MONTEBELLO UNIFIED (SCHOOL DISTRICT)
MONTEREY VISTA ELEMENTARY (901 E. GRAVES AVE. in MONTEREY PARK, CA)
(National Center for Education Statistics) - STATE ID-6013585 Organizations: GARVEY ELEMENTARY (SCHOOL DISTRICT)
Housing units lacking complete plumbing facilities: 0.1%
Housing units lacking complete kitchen facilities: 3.9%
59.8% Utility gas 35.2% Electricity 2.5% No fuel used 2.2% Bottled, tank, or LP gas
Place of birth for U.S.-born residents:
This state: 9,906Northeast: 223Midwest: 346South: 382West: 321
64% of the 91755 zip code residents lived in the same house 5 years ago.
Out of people who lived in different houses, 90% lived in this county.
Out of people who lived in different counties, 50% lived in California.
95% of the 91755 zip code residents lived in the same house 1 year ago.
Out of people who lived in different houses, 66% moved from this county.
Out of people who lived in different houses, 13% moved from different county within same state.
Out of people who lived in different houses, 10% moved from different state.
Out of people who lived in different houses, 18% moved from abroad.
Private vs. public school enrollment:
Students in private schools in grades 1 to 8 (elementary and middle school): 432
Here:
20.3%California:
10.5%
Students in private schools in grades 9 to 12 (high school): 43
Students in private undergraduate colleges: 144
Here:
9.2%California:
15.9%
Occupation by median earnings in the past 12 months ($)
103,683 Health diagnosing and treating practitioners and other technical occupations 80,996 Computer and mathematical occupations 77,963 Architecture and engineering occupations 76,486 Business and financial operations occupations 73,430 Life, physical, and social science occupations 69,308 Management occupations
Companies with federal contracts located in this zip code (MONTEREY PARK, CA):
FURTERA, INC (326 N ORANGE; small business) in 23 contracts from 2001 to 2004
Contracts for ADP Telecommunications and Transmission Services by Department of Defense, Defense Information Systems AgencySigned by year: 2000: $0; 2001: $50,000; 2002: $1,699,510; 2003: $147,511; 2004: -$585,760; 2005: $0; 2006: $0.
Biggest contracts: with Department of Defense for ADP Telecommunications and Transmission Services. Signed on 2002-05-31. Completion date: 2007-04-17.
, same as above. Signed on 2002-05-31. Completion date: 2007-01-09.
, same as above. Signed on 2002-03-31. Completion date: 2007-04-22.
, same as above. Signed on 2003-06-30. Completion date: 2006-06-04.
PEDUS SECURITY SERVICES, INC. (601 POTRERO GRANDE DRIVE; small business)
$61,614 with Navy for Guard Services. Signed on 2000-08-29. Completion date: 2001-04-30.
RIGOLI PACIFIC COMPANY INC (1983 POTRERO GRANDE DR; small business)
$25,750 with Air Force for Equipment and Materials Testing -- Fire Fighting, Rescue, and Safety Equipment; and Environmental Protection Equipment and Materials. Signed on 2001-01-05. Completion date: 2000-12-06.
KINETIC SOLUTIONS INC (168 CORAL VIEW ST; small business)
$6,897 with Air Force for Fans, Air Circulators, and Blower Equipment. Taking place in TX. Signed on 2005-01-11. Completion date: 2005-01-21.
ROSS NAME PLATE COMPANY (2 RED PLUM CIR; small business) in 3 contracts from 2004 to 2005
$384 with Army for Miscellaneous Printed Matter. Signed on 2004-08-23. Completion date: 2004-09-17.
, same as above. Signed on 2004-09-22. Completion date: 2004-10-15.
, same as above. Signed on 2005-11-10. Completion date: 2005-11-18.
Top industries in this zip code by the number of employees in 2005:
Administrative and Support and Waste Management and Remediation Services: Janitorial Services (500-999 employees: 1 establishment, 1-4 employees: 2 establishments)Finance and Insurance: Commercial Banking (100-249: 1, 1-4: 1)Management of Companies and Enterprises: Corporate, Subsidiary, and Regional Managing Offices (100-249: 1)Health Care and Social Assistance: Nursing Care Facilities (100-249: 1)Administrative and Support and Waste Management and Remediation Services: Travel Agencies (50-99: 1, 20-49: 1, 5-9: 2, 1-4: 6)Accommodation and Food Services: Full-Service Restaurants (20-49: 1, 10-19: 1, 5-9: 4, 1-4: 6)Educational Services: Elementary and Secondary Schools (50-99: 1)Professional, Scientific, and Technical Services: Environmental Consulting Services (20-49: 1, 1-4: 1)
People in group quarters in 2010:
186 people in nursing facilities/skilled-nursing facilities
6 people in group homes intended for adults
4 people in other noninstitutional facilities
People in group quarters in 2000:
92 people in homes for the physically handicapped
85 people in nursing homes
8 people in homes for the mentally retarded
Fatal accident statistics in 2014:
Fatal accident count: 2Vehicles involved in fatal accidents: 4Fatal accidents caused by drunken drivers: 1Fatalities: 2Persons involved in fatal accidents: 5Pedestrians involved in fatal accidents: 1
Fatal accident statistics in 2013:
Fatal accident count: 1Vehicles involved in fatal accidents: 2Fatal accidents caused by drunken drivers: 2Fatalities: 1Persons involved in fatal accidents: 6Pedestrians involved in fatal accidents: 0
Home Mortgage Disclosure Act Aggregated Statistics For Year 2009(Based on 6 full and 6 partial tracts) A) FHA, FSA/RHS & VA B) Conventional C) Refinancings D) Home Improvement Loans E) Loans on Dwellings For 5+ Families F) Non-occupant Loans on Number Average Value Number Average Value Number Average Value Number Average Value Number Average Value Number Average Value
LOANS ORIGINATED 13 $365,678 185 $302,832 635 $279,824 32 $237,813 8 $895,512 68 $255,232 APPLICATIONS APPROVED, NOT ACCEPTED 2 $273,315 19 $299,076 93 $309,391 5 $215,894 0 $0 6 $269,545 APPLICATIONS DENIED 0 $0 38 $274,197 208 $305,219 7 $192,490 2 $553,950 35 $258,981 APPLICATIONS WITHDRAWN 5 $350,240 38 $322,295 98 $350,238 11 $98,355 0 $0 10 $238,579 FILES CLOSED FOR INCOMPLETENESS 0 $0 12 $344,969 51 $297,810 8 $330,250 0 $0 9 $235,659
Aggregated Statistics For Year 2008(Based on 6 full and 6 partial tracts) A) FHA, FSA/RHS & VA B) Conventional C) Refinancings D) Home Improvement Loans E) Loans on Dwellings For 5+ Families F) Non-occupant Loans on G) Loans On Manufactured Number Average Value Number Average Value Number Average Value Number Average Value Number Average Value Number Average Value Number Average Value
LOANS ORIGINATED 7 $513,599 200 $335,543 318 $286,848 32 $155,212 20 $906,558 53 $260,852 0 $0 APPLICATIONS APPROVED, NOT ACCEPTED 0 $0 45 $313,456 76 $298,561 8 $292,611 0 $0 19 $208,132 5 $81,802 APPLICATIONS DENIED 2 $283,370 63 $339,548 169 $337,158 31 $164,321 2 $375,895 24 $400,468 2 $79,265 APPLICATIONS WITHDRAWN 2 $304,395 40 $346,491 93 $330,192 9 $333,981 0 $0 8 $276,525 0 $0 FILES CLOSED FOR INCOMPLETENESS 0 $0 14 $283,249 38 $294,259 4 $66,272 0 $0 9 $294,574 0 $0
Aggregated Statistics For Year 2007(Based on 6 full and 6 partial tracts) B) Conventional C) Refinancings D) Home Improvement Loans E) Loans on Dwellings For 5+ Families F) Non-occupant Loans on G) Loans On Manufactured Number Average Value Number Average Value Number Average Value Number Average Value Number Average Value Number Average Value
LOANS ORIGINATED 350 $327,086 503 $314,541 86 $206,874 16 $764,732 96 $325,611 0 $0 APPLICATIONS APPROVED, NOT ACCEPTED 92 $304,851 124 $314,448 18 $177,319 2 $985,900 20 $346,613 0 $0 APPLICATIONS DENIED 66 $353,162 261 $341,023 51 $166,945 0 $0 30 $341,750 2 $77,280 APPLICATIONS WITHDRAWN 29 $317,049 124 $309,808 33 $317,685 0 $0 11 $315,822 0 $0 FILES CLOSED FOR INCOMPLETENESS 27 $397,020 51 $320,692 2 $319,935 0 $0 4 $331,298 0 $0
Aggregated Statistics For Year 2006(Based on 6 full and 6 partial tracts) B) Conventional C) Refinancings D) Home Improvement Loans E) Loans on Dwellings For 5+ Families F) Non-occupant Loans on G) Loans On Manufactured Number Average Value Number Average Value Number Average Value Number Average Value Number Average Value Number Average Value
LOANS ORIGINATED 489 $300,868 654 $309,585 78 $224,531 18 $913,185 90 $302,416 2 $63,310 APPLICATIONS APPROVED, NOT ACCEPTED 119 $313,234 120 $326,939 3 $361,160 2 $723,285 12 $319,014 4 $69,355 APPLICATIONS DENIED 127 $276,982 253 $329,257 43 $166,550 4 $490,642 48 $165,871 0 $0 APPLICATIONS WITHDRAWN 90 $301,347 184 $317,998 28 $257,666 0 $0 19 $341,375 0 $0 FILES CLOSED FOR INCOMPLETENESS 10 $324,300 52 $258,713 2 $29,725 0 $0 0 $0 2 $481,740
Aggregated Statistics For Year 2005(Based on 6 full and 6 partial tracts) B) Conventional C) Refinancings D) Home Improvement Loans E) Loans on Dwellings For 5+ Families F) Non-occupant Loans on Number Average Value Number Average Value Number Average Value Number Average Value Number Average Value
LOANS ORIGINATED 597 $311,582 769 $286,294 120 $216,524 25 $1,298,687 128 $291,921 APPLICATIONS APPROVED, NOT ACCEPTED 83 $271,303 147 $278,624 16 $231,837 6 $876,045 26 $300,913 APPLICATIONS DENIED 159 $276,408 212 $296,425 35 $178,668 2 $739,425 37 $320,780 APPLICATIONS WITHDRAWN 97 $272,099 224 $266,597 17 $105,848 4 $1,232,375 11 $168,807 FILES CLOSED FOR INCOMPLETENESS 35 $244,719 47 $286,750 6 $311,718 0 $0 2 $328,160
Aggregated Statistics For Year 2004(Based on 6 full and 6 partial tracts) A) FHA, FSA/RHS & VA B) Conventional C) Refinancings D) Home Improvement Loans E) Loans on Dwellings For 5+ Families F) Non-occupant Loans on G) Loans On Manufactured Number Average Value Number Average Value Number Average Value Number Average Value Number Average Value Number Average Value Number Average Value
LOANS ORIGINATED 1 $362,550 669 $262,636 1,058 $233,225 109 $165,849 25 $576,690 159 $237,363 2 $26,710 APPLICATIONS APPROVED, NOT ACCEPTED 0 $0 144 $267,093 203 $223,123 12 $233,801 0 $0 39 $223,460 0 $0 APPLICATIONS DENIED 0 $0 141 $257,988 293 $250,612 43 $148,190 0 $0 29 $268,741 0 $0 APPLICATIONS WITHDRAWN 0 $0 54 $266,648 231 $253,129 21 $105,399 2 $1,336,595 18 $265,848 0 $0 FILES CLOSED FOR INCOMPLETENESS 0 $0 26 $225,862 83 $279,578 8 $113,449 0 $0 6 $234,173 0 $0
Aggregated Statistics For Year 2003(Based on 6 full and 6 partial tracts) A) FHA, FSA/RHS & VA B) Conventional C) Refinancings D) Home Improvement Loans E) Loans on Dwellings For 5+ Families F) Non-occupant Loans on Number Average Value Number Average Value Number Average Value Number Average Value Number Average Value Number Average Value
LOANS ORIGINATED 2 $303,110 518 $227,231 2,493 $181,382 37 $96,182 46 $733,346 249 $187,274 APPLICATIONS APPROVED, NOT ACCEPTED 0 $0 84 $221,375 422 $195,845 10 $50,748 4 $877,108 38 $169,182 APPLICATIONS DENIED 0 $0 120 $213,906 402 $192,653 24 $78,079 0 $0 42 $207,244 APPLICATIONS WITHDRAWN 2 $230,855 63 $217,200 434 $187,235 3 $22,043 1 $492,300 27 $227,059 FILES CLOSED FOR INCOMPLETENESS 2 $238,580 31 $256,384 90 $205,971 4 $29,292 0 $0 11 $243,877
Aggregated Statistics For Year 2002(Based on 6 full and 6 partial tracts) A) FHA, FSA/RHS & VA B) Conventional C) Refinancings D) Home Improvement Loans E) Loans on Dwellings For 5+ Families F) Non-occupant Loans on Number Average Value Number Average Value Number Average Value Number Average Value Number Average Value Number Average Value
LOANS ORIGINATED 4 $240,480 592 $198,905 1,514 $169,896 18 $44,933 33 $707,252 167 $177,234 APPLICATIONS APPROVED, NOT ACCEPTED 2 $158,140 60 $207,582 244 $161,931 6 $61,452 2 $340,135 11 $146,002 APPLICATIONS DENIED 1 $408,990 48 $128,435 228 $155,703 22 $28,770 6 $667,368 13 $176,102 APPLICATIONS WITHDRAWN 1 $170,340 64 $192,904 207 $172,254 6 $10,437 6 $656,847 13 $177,018 FILES CLOSED FOR INCOMPLETENESS 1 $408,990 21 $214,198 72 $170,604 1 $67,090 2 $1,368,430 3 $189,210
Aggregated Statistics For Year 2001(Based on 6 full and 6 partial tracts) A) FHA, FSA/RHS & VA B) Conventional C) Refinancings D) Home Improvement Loans E) Loans on Dwellings For 5+ Families F) Non-occupant Loans on Number Average Value Number Average Value Number Average Value Number Average Value Number Average Value Number Average Value
LOANS ORIGINATED 18 $207,070 570 $171,420 936 $156,618 59 $30,169 21 $710,890 95 $158,773 APPLICATIONS APPROVED, NOT ACCEPTED 3 $219,543 45 $202,244 168 $145,959 10 $80,219 4 $626,928 21 $158,700 APPLICATIONS DENIED 0 $0 69 $168,901 282 $139,033 45 $31,392 0 $0 24 $140,932 APPLICATIONS WITHDRAWN 2 $146,255 50 $164,203 173 $164,745 23 $36,523 0 $0 19 $141,855 FILES CLOSED FOR INCOMPLETENESS 0 $0 26 $183,021 61 $127,363 4 $20,568 4 $799,975 5 $140,504
Aggregated Statistics For Year 2000(Based on 6 full and 6 partial tracts) A) FHA, FSA/RHS & VA B) Conventional C) Refinancings D) Home Improvement Loans E) Loans on Dwellings For 5+ Families F) Non-occupant Loans on Number Average Value Number Average Value Number Average Value Number Average Value Number Average Value Number Average Value
LOANS ORIGINATED 16 $177,236 441 $154,738 179 $119,911 73 $40,079 18 $684,639 43 $143,960 APPLICATIONS APPROVED, NOT ACCEPTED 2 $223,355 66 $154,318 51 $106,912 25 $38,848 0 $0 0 $0 APPLICATIONS DENIED 4 $202,015 68 $162,769 102 $134,139 47 $22,867 0 $0 5 $92,370 APPLICATIONS WITHDRAWN 3 $136,557 60 $144,012 96 $117,000 13 $89,838 0 $0 15 $151,796 FILES CLOSED FOR INCOMPLETENESS 1 $202,560 7 $184,041 36 $154,600 4 $25,675 2 $985,900 0 $0
Aggregated Statistics For Year 1999(Based on 1 full and 5 partial tracts) A) FHA, FSA/RHS & VA B) Conventional C) Refinancings D) Home Improvement Loans E) Loans on Dwellings For 5+ Families F) Non-occupant Loans on Number Average Value Number Average Value Number Average Value Number Average Value Number Average Value Number Average Value
LOANS ORIGINATED 7 $153,331 234 $146,635 219 $129,633 40 $18,468 10 $417,771 46 $114,602 APPLICATIONS APPROVED, NOT ACCEPTED 0 $0 13 $140,726 34 $134,965 4 $36,870 0 $0 0 $0 APPLICATIONS DENIED 0 $0 31 $143,114 81 $117,608 15 $16,106 1 $260,200 6 $111,622 APPLICATIONS WITHDRAWN 2 $209,505 26 $138,471 74 $122,670 7 $38,564 0 $0 7 $138,967 FILES CLOSED FOR INCOMPLETENESS 0 $0 10 $148,803 23 $142,233 0 $0 0 $0 3 $98,517
Private Mortgage Insurance Companies Aggregated Statistics For Year 2009(Based on 4 full and 4 partial tracts) A) Conventional B) Refinancings Number Average Value Number Average Value
LOANS ORIGINATED 9 $373,898 4 $346,978 APPLICATIONS APPROVED, NOT ACCEPTED 0 $0 3 $449,170 APPLICATIONS DENIED 0 $0 0 $0 APPLICATIONS WITHDRAWN 0 $0 2 $347,360 FILES CLOSED FOR INCOMPLETENESS 0 $0 0 $0
Aggregated Statistics For Year 2008(Based on 6 full and 6 partial tracts) A) Conventional B) Refinancings C) Non-occupant Loans on Number Average Value Number Average Value Number Average Value
LOANS ORIGINATED 27 $386,769 3 $465,067 2 $268,505 APPLICATIONS APPROVED, NOT ACCEPTED 17 $420,560 9 $402,853 0 $0 APPLICATIONS DENIED 0 $0 4 $336,872 2 $336,870 APPLICATIONS WITHDRAWN 0 $0 2 $457,050 0 $0 FILES CLOSED FOR INCOMPLETENESS 2 $385,485 0 $0 0 $0
Aggregated Statistics For Year 2007(Based on 6 full and 6 partial tracts) A) Conventional B) Refinancings Number Average Value Number Average Value
LOANS ORIGINATED 11 $415,208 15 $475,149 APPLICATIONS APPROVED, NOT ACCEPTED 2 $529,085 1 $621,880 APPLICATIONS DENIED 0 $0 2 $554,330 APPLICATIONS WITHDRAWN 0 $0 2 $386,475 FILES CLOSED FOR INCOMPLETENESS 0 $0 0 $0
Aggregated Statistics For Year 2006(Based on 2 full and 6 partial tracts) A) Conventional B) Refinancings Number Average Value Number Average Value
LOANS ORIGINATED 12 $411,395 5 $421,360 APPLICATIONS APPROVED, NOT ACCEPTED 0 $0 4 $457,050 APPLICATIONS DENIED 0 $0 0 $0 APPLICATIONS WITHDRAWN 0 $0 2 $457,050 FILES CLOSED FOR INCOMPLETENESS 0 $0 0 $0
Aggregated Statistics For Year 2005(Based on 6 full and 6 partial tracts) A) Conventional B) Refinancings Number Average Value Number Average Value
LOANS ORIGINATED 10 $303,176 10 $329,371 APPLICATIONS APPROVED, NOT ACCEPTED 2 $334,890 3 $371,877 APPLICATIONS DENIED 1 $250,300 0 $0 APPLICATIONS WITHDRAWN 0 $0 0 $0 FILES CLOSED FOR INCOMPLETENESS 0 $0 0 $0
Aggregated Statistics For Year 2004(Based on 6 full and 6 partial tracts) A) Conventional B) Refinancings C) Non-occupant Loans on Number Average Value Number Average Value Number Average Value
LOANS ORIGINATED 15 $318,707 8 $282,590 1 $367,260 APPLICATIONS APPROVED, NOT ACCEPTED 6 $193,592 5 $290,898 2 $182,390 APPLICATIONS DENIED 0 $0 0 $0 0 $0 APPLICATIONS WITHDRAWN 1 $331,810 2 $385,485 0 $0 FILES CLOSED FOR INCOMPLETENESS 4 $182,392 0 $0 0 $0
Aggregated Statistics For Year 2003(Based on 6 full and 6 partial tracts) A) Conventional B) Refinancings C) Non-occupant Loans on Number Average Value Number Average Value Number Average Value
LOANS ORIGINATED 59 $246,609 11 $258,399 2 $278,800 APPLICATIONS APPROVED, NOT ACCEPTED 27 $251,375 13 $231,800 2 $186,270 APPLICATIONS DENIED 1 $398,670 0 $0 0 $0 APPLICATIONS WITHDRAWN 2 $234,925 0 $0 0 $0 FILES CLOSED FOR INCOMPLETENESS 0 $0 0 $0 0 $0
Aggregated Statistics For Year 2002(Based on 6 full and 6 partial tracts) A) Conventional B) Refinancings C) Non-occupant Loans on Number Average Value Number Average Value Number Average Value
LOANS ORIGINATED 68 $229,016 21 $222,019 2 $175,090 APPLICATIONS APPROVED, NOT ACCEPTED 21 $213,459 17 $232,367 2 $182,015 APPLICATIONS DENIED 0 $0 0 $0 0 $0 APPLICATIONS WITHDRAWN 0 $0 2 $145,340 0 $0 FILES CLOSED FOR INCOMPLETENESS 0 $0 0 $0 0 $0
Aggregated Statistics For Year 2001(Based on 6 full and 6 partial tracts) A) Conventional B) Refinancings C) Non-occupant Loans on Number Average Value Number Average Value Number Average Value
LOANS ORIGINATED 83 $197,773 25 $215,657 2 $151,740 APPLICATIONS APPROVED, NOT ACCEPTED 17 $192,335 6 $213,092 0 $0 APPLICATIONS DENIED 5 $192,510 2 $218,965 2 $218,965 APPLICATIONS WITHDRAWN 4 $199,325 0 $0 0 $0 FILES CLOSED FOR INCOMPLETENESS 0 $0 0 $0 0 $0
Aggregated Statistics For Year 2000(Based on 6 full and 6 partial tracts) A) Conventional B) Refinancings C) Non-occupant Loans on Number Average Value Number Average Value Number Average Value
LOANS ORIGINATED 85 $173,307 7 $154,649 4 $183,100 APPLICATIONS APPROVED, NOT ACCEPTED 7 $196,467 0 $0 0 $0 APPLICATIONS DENIED 2 $228,525 0 $0 0 $0 APPLICATIONS WITHDRAWN 0 $0 0 $0 0 $0 FILES CLOSED FOR INCOMPLETENESS 0 $0 0 $0 0 $0
Aggregated Statistics For Year 1999(Based on 1 full and 5 partial tracts) A) Conventional B) Refinancings C) Non-occupant Loans on Number Average Value Number Average Value Number Average Value
LOANS ORIGINATED 41 $167,649 13 $180,065 2 $220,635 APPLICATIONS APPROVED, NOT ACCEPTED 5 $166,028 5 $157,314 0 $0 APPLICATIONS DENIED 1 $285,600 0 $0 0 $0 APPLICATIONS WITHDRAWN 1 $125,000 2 $116,520 0 $0 FILES CLOSED FOR INCOMPLETENESS 0 $0 0 $0 0 $0
2005 - 2018 National Fire Incident Reporting System (NFIRS) incidents See full 2006 National Fire Incident Reporting System statistics for zip code 91755, California
Most common first names in zip code 91755 among deceased individuals Name Count Lived (average)
Frank 29 82.1 years George 26 80.1 years Robert 25 73.2 years Mary 23 84.2 years John 22 73.6 years James 18 80.5 years Maria 16 79.9 years Joseph 14 83.6 years Charles 13 76.9 years Paul 13 79.0 years
Most common last names in zip code 91755 among deceased individuals Last name Count Lived (average)
Wong 35 78.6 years Chang 27 83.6 years Lee 27 83.3 years Liu 20 80.8 years Tran 20 80.4 years Chen 18 80.2 years Li 18 79.1 years Lam 18 80.9 years Wang 17 80.7 years Garcia 13 67.5 years
Businesses in zip code 91755
Name Count Name Count
7-Eleven 2 FedEx 2 Best Western 1 T-Mobile 1
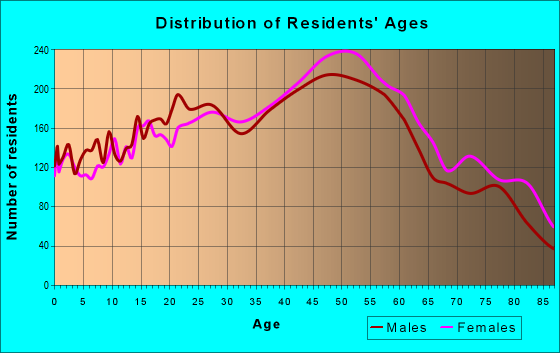
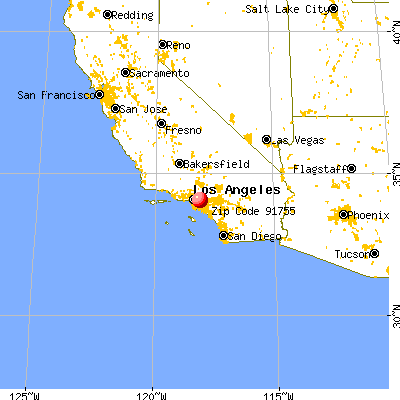


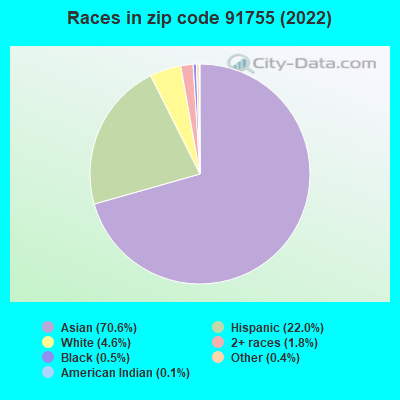


 Nearest zip codes: 91754, 91770, 90640, 91803, 91801, 91776.
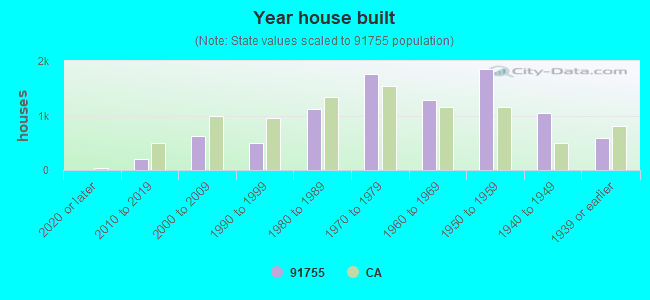
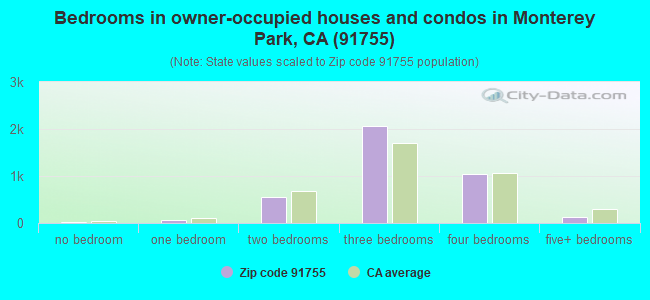
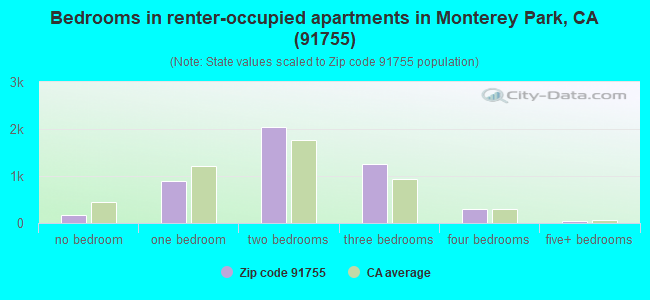
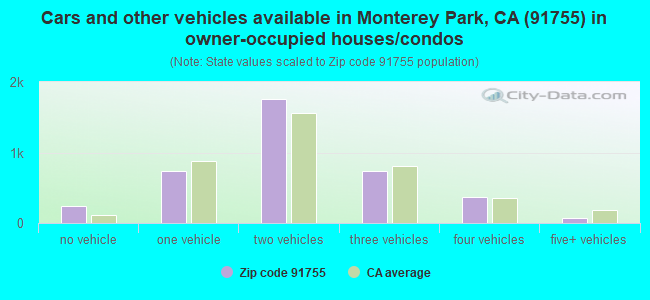
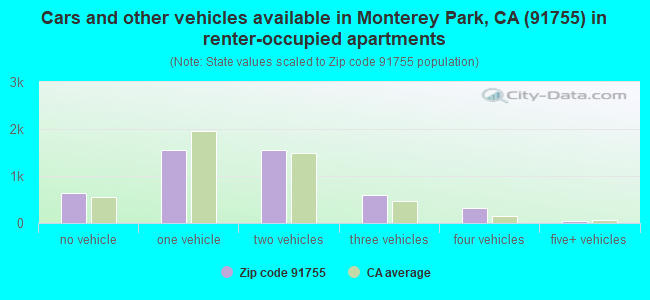


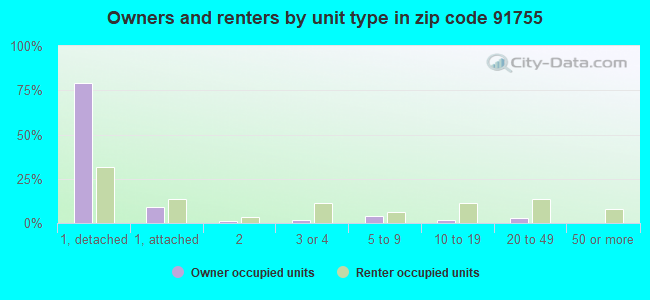
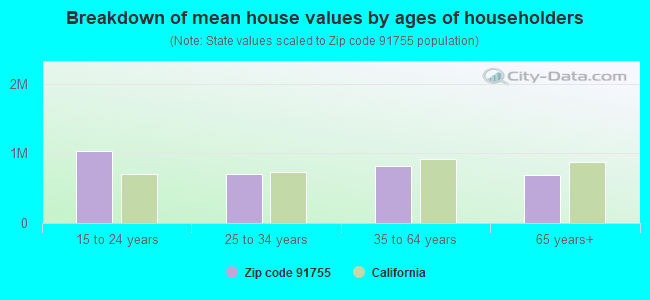


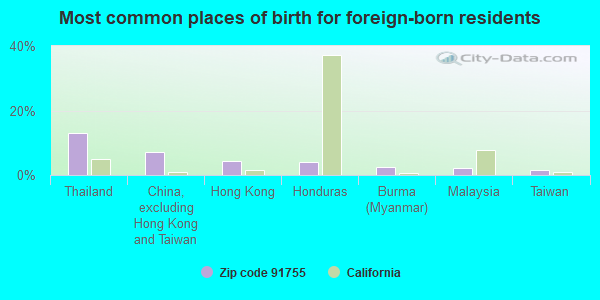
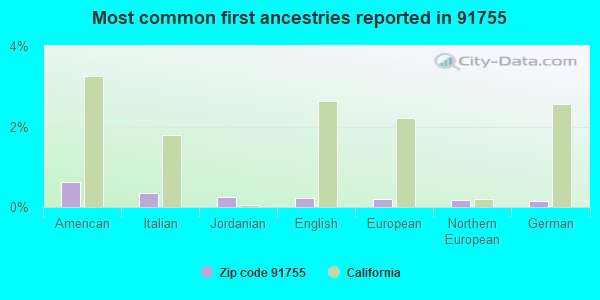
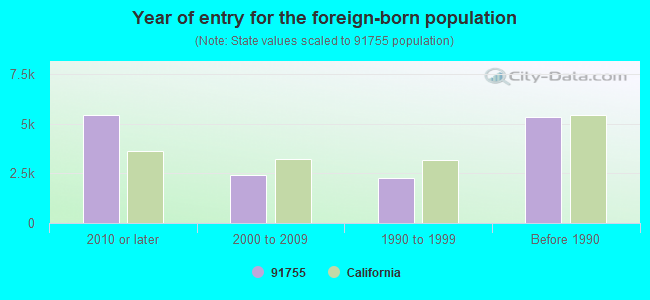


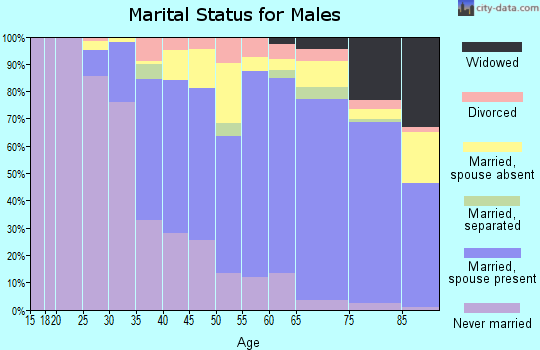
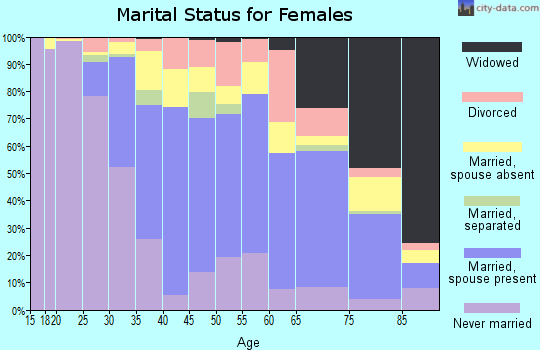
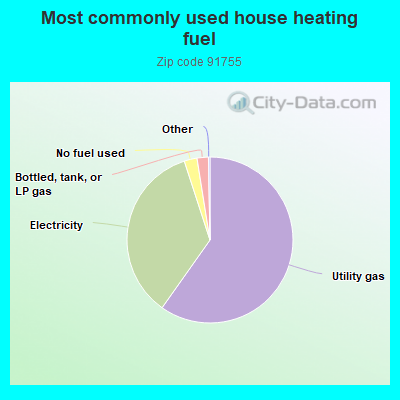
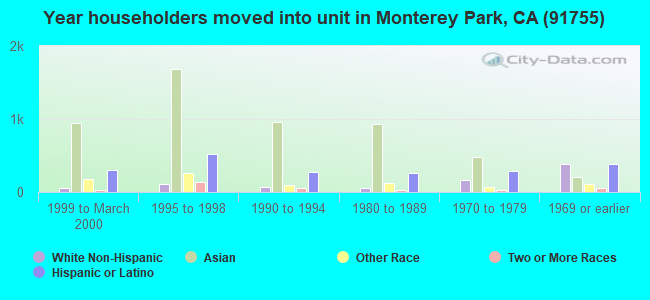
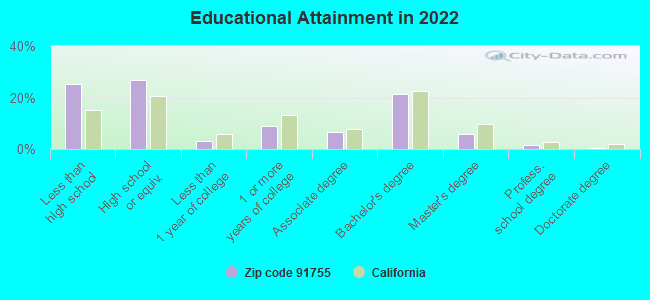
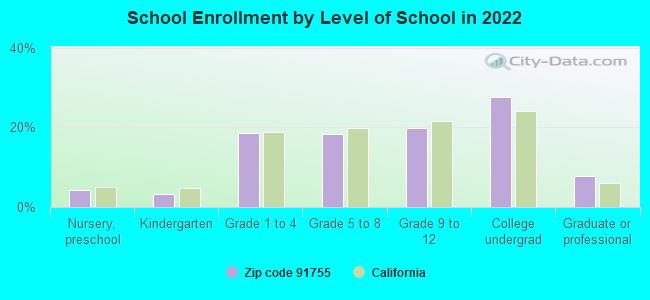
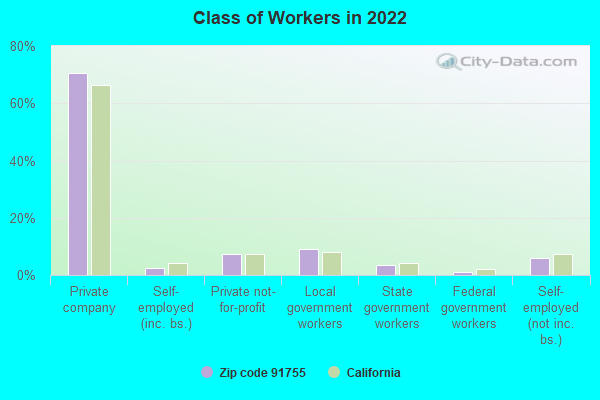
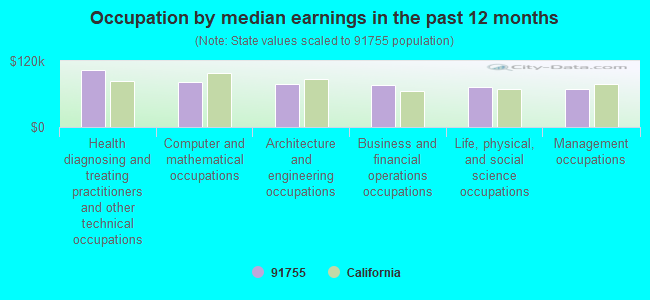
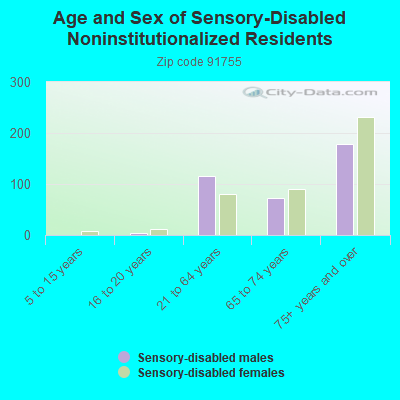
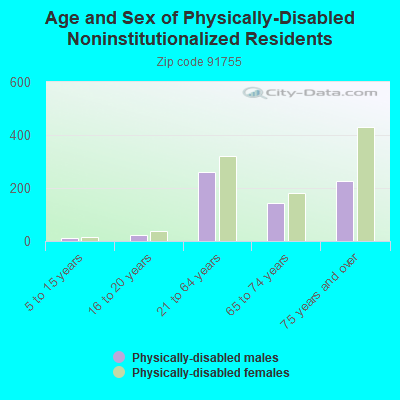
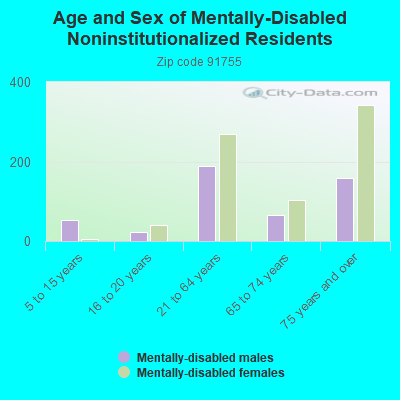
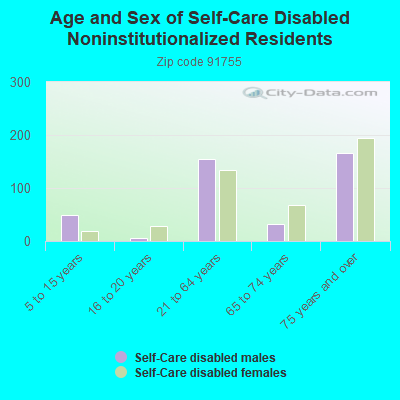
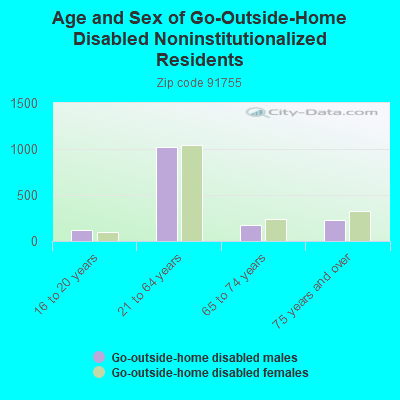
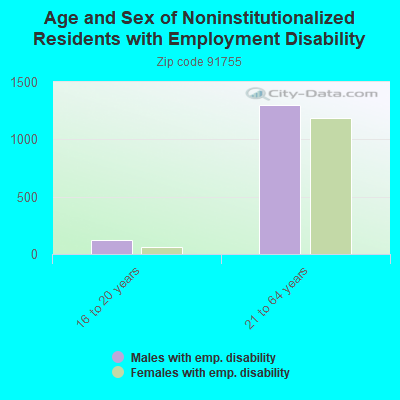
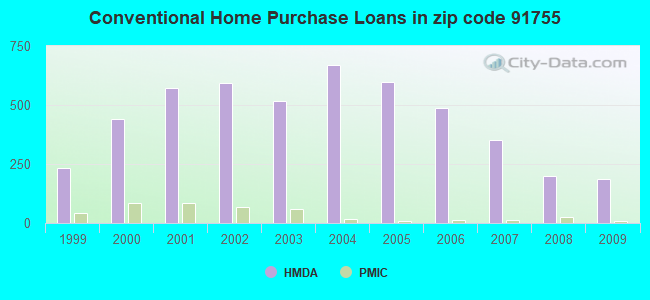
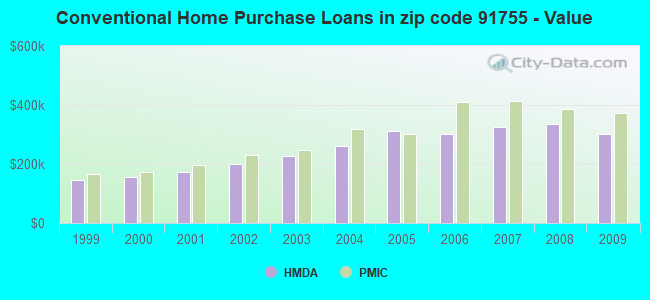
 According to the data from the years 2005 - 2018 the average number of fires per year is 8. The highest number of fires - 23 took place in 2010, and the least - 0 in 2013. The data has a decreasing trend.
 When looking into fire subcategories, the most incidents belonged to: Structure Fires (54.3%), and Outside Fires (21.6%).