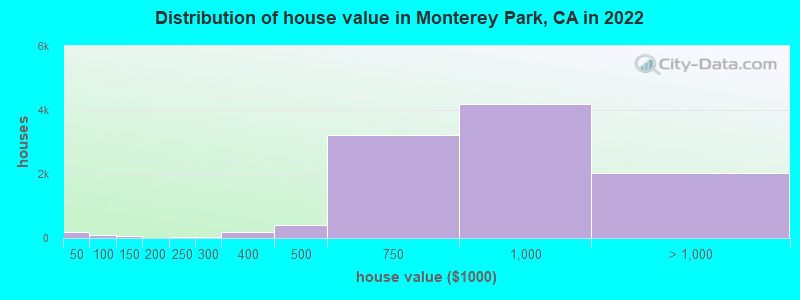
Estimated median house or condo value in 2022: $847,299 (it was $211,600 in 2000)
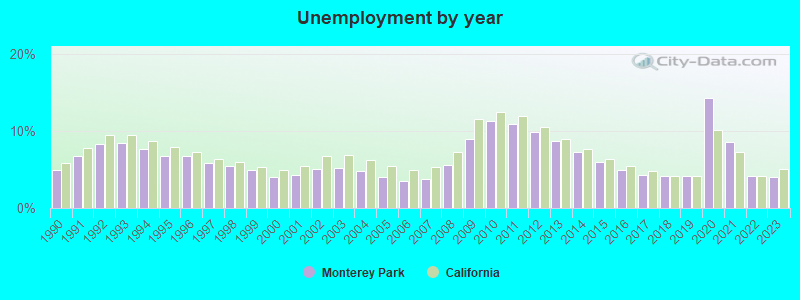
Monterey Park:
$847,299
CA:
$715,900
Mean prices in 2022:all housing units: $904,486; detached houses: $959,999; townhouses or other attached units: $631,359; in 2-unit structures: $720,123; in 3-to-4-unit structures: $688,090; in 5-or-more-unit structures: $604,841; mobile homes: $938,663
Median gross rent in 2022: $1,791.
March 2022 cost of living index in Monterey Park: 144.1 (very high, U.S. average is 100)
Percentage of residents living in poverty in 2022: 12.0%
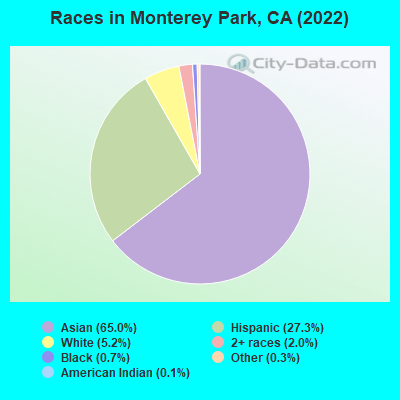
(15.1% for White Non-Hispanic residents, 13.6% for Black residents, 8.0% for Hispanic or Latino residents, 17.1% for American Indian residents, 6.1% for other race residents, 10.4% for two or more races residents)
580.10%Native Hawaiian and Other Pacific Islander alone
According to our research of California and other state lists, there were 27 registered sex offenders living in Monterey Park, California as of April 27, 2024. The ratio of all residents to sex offenders in Monterey Park is 2,277 to 1. The ratio of registered sex offenders to all residents in this city is much lower than the state average.
Crime rates in Monterey Park by year
Type
2009
2010
2011
2012
2013
2014
2015
2016
2017
2018
2019
2020
2022
Murders (per 100,000)
1 (1.6)
3 (5.0)
1 (1.6)
4 (6.5)
0 (0.0)
1 (1.6)
0 (0.0)
1 (1.6)
1 (1.6)
0 (0.0)
0 (0.0)
2 (3.4)
0 (0.0)
Rapes (per 100,000)
4 (6.5)
0 (0.0)
1 (1.6)
1 (1.6)
8 (13.1)
4 (6.5)
6 (9.7)
8 (13.0)
10 (16.3)
4 (6.5)
7 (11.6)
11 (18.5)
7 (12.0)
Robberies (per 100,000)
95 (154.8)
57 (94.6)
60 (98.4)
42 (68.5)
60 (98.1)
41 (66.9)
57 (92.3)
59 (95.6)
55 (89.9)
73 (119.4)
59 (97.6)
51 (85.6)
70 (120.0)
Assaults (per 100,000)
46 (75.0)
36 (59.7)
40 (65.6)
28 (45.7)
36 (58.9)
45 (73.4)
40 (64.8)
63 (102.1)
46 (75.2)
47 (76.8)
60 (99.3)
49 (82.2)
77 (132.0)
Burglaries (per 100,000)
249 (405.8)
219 (363.4)
213 (349.3)
249 (406.4)
316 (516.7)
267 (435.7)
378 (612.1)
460 (745.4)
439 (717.2)
356 (582.1)
267 (441.9)
212 (355.7)
245 (419.9)
Thefts (per 100,000)
524 (854.1)
415 (688.6)
635 (1,041)
551 (899.3)
637 (1,042)
608 (992.1)
728 (1,179)
998 (1,617)
955 (1,560)
1,017 (1,663)
929 (1,537)
781 (1,310)
709 (1,215)
Auto thefts (per 100,000)
193 (314.6)
226 (375.0)
191 (313.2)
222 (362.3)
209 (341.8)
164 (267.6)
243 (393.5)
246 (398.6)
219 (357.8)
216 (353.2)
159 (263.1)
237 (397.6)
273 (467.9)
Arson (per 100,000)
2 (3.3)
0 (0.0)
0 (0.0)
2 (3.3)
0 (0.0)
0 (0.0)
3 (4.9)
1 (1.6)
4 (6.5)
2 (3.3)
0 (0.0)
15 (25.2)
3 (5.1)
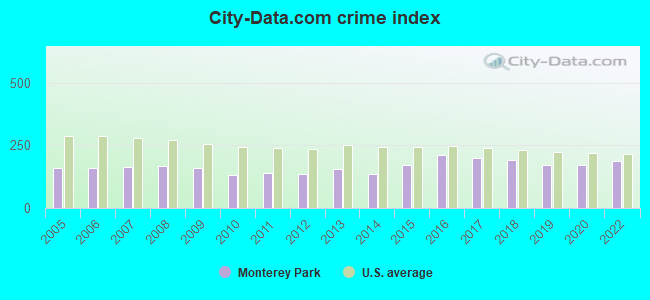
City-Data.com crime index
157.7
133.3
138.4
137.5
156.9
134.8
169.9
211.5
199.6
191.9
171.9
172.7
187.4
The City-Data.com crime index weighs serious crimes and violent crimes more heavily. Higher means more crime, U.S. average is 246.1. It adjusts for the number of visitors and daily workers commuting into cities.
- means the value is smaller than the state average. - means the value is about the same as the state average. - means the value is bigger than the state average. - means the value is much bigger than the state average.
Latest news from Monterey Park, CA collected exclusively by city-data.com from local newspapers, TV, and radio stations
Current Local Time: PST time zone
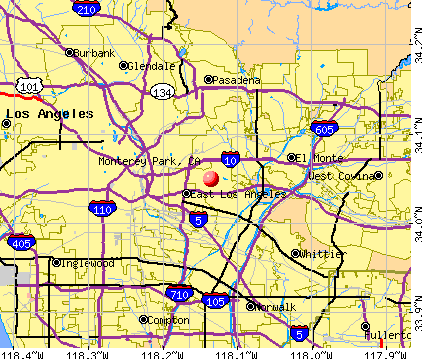
Elevation: 381 feet
Land area: 7.63 square miles.
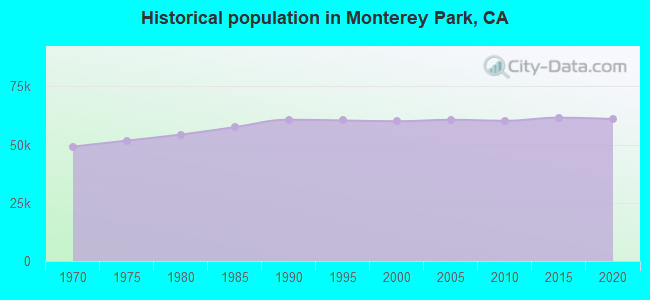
Population density: 7,673 people per square mile (high).
30,268 residents are foreign born (44.8% Asia, 6.1% Latin America).
This city:
51.2%
California:
26.5%
Median real estate property taxes paid for housing units with mortgages in 2022: $6,402 (0.7%) Median real estate property taxes paid for housing units with no mortgage in 2022: $4,145 (0.5%)
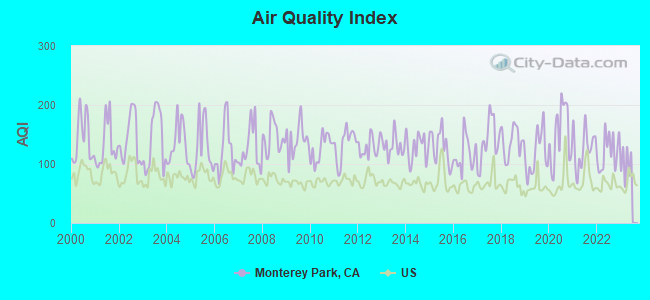
Air Quality Index (AQI) level in 2022 was 121. This is significantly worse than average.
City:
121
U.S.:
73
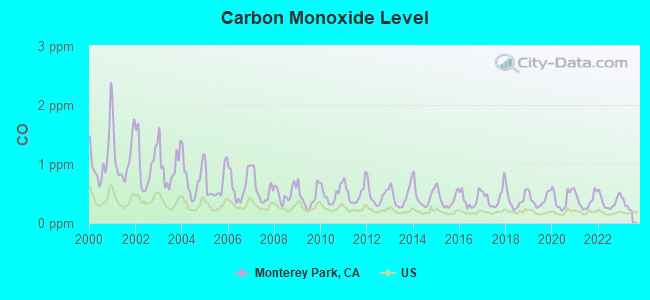
Carbon Monoxide (CO) [ppm] level in 2022 was 0.362. This is significantly worse than average.Closest monitor was 4.2 miles away from the city center.
City:
0.362
U.S.:
0.251
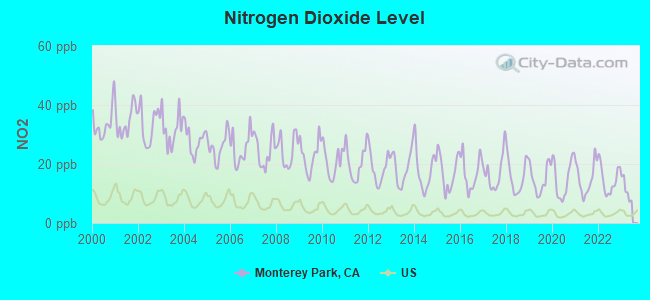
Nitrogen Dioxide (NO2) [ppb] level in 2022 was 14.7. This is significantly worse than average.Closest monitor was 4.2 miles away from the city center.
City:
14.7
U.S.:
5.1
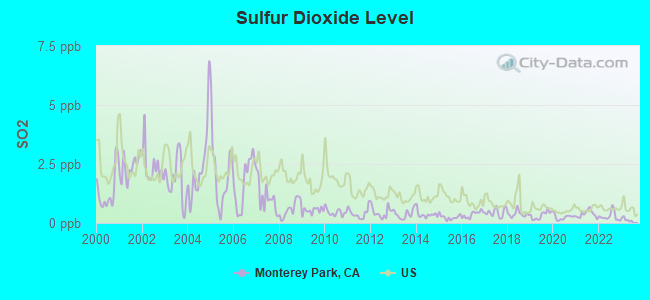
Sulfur Dioxide (SO2) [ppb] level in 2022 was 0.282. This is significantly better than average.Closest monitor was 4.7 miles away from the city center.
City:
0.282
U.S.:
1.515
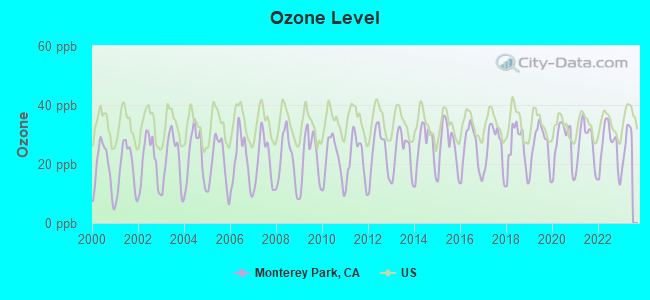
Ozone [ppb] level in 2022 was 26.0. This is better than average.Closest monitor was 4.1 miles away from the city center.
City:
26.0
U.S.:
33.3
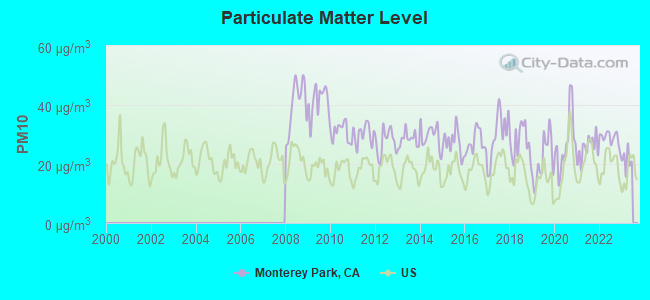
Particulate Matter (PM10) [µg/m3] level in 2022 was 28.7. This is significantly worse than average.Closest monitor was 5.4 miles away from the city center.
City:
28.7
U.S.:
19.2
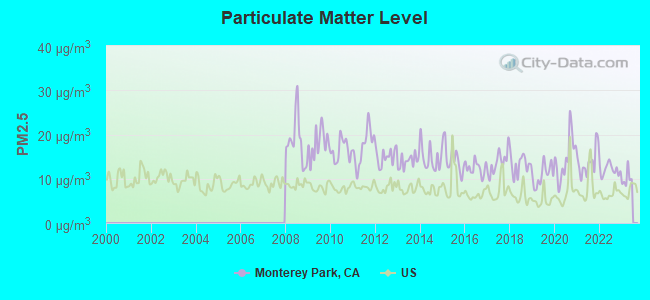
Particulate Matter (PM2.5) [µg/m3] level in 2022 was 12.1. This is significantly worse than average.Closest monitor was 4.7 miles away from the city center.
City:
12.1
U.S.:
8.1
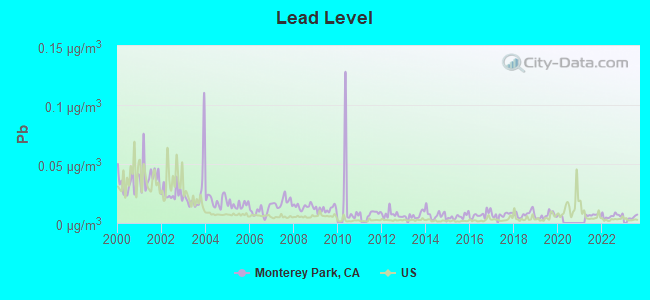
Lead (Pb) [µg/m3] level in 2022 was 0.00605. This is significantly better than average.Closest monitor was 3.8 miles away from the city center.
City:
0.00605
U.S.:
0.00931
Earthquake activity:
Monterey Park-area historical earthquake activity is significantly above California state average. It is 7058% greater than the overall U.S. average.
On 7/21/1952 at 11:52:14, a magnitude 7.7 (7.7 UK, Class: Major, Intensity: VIII - XII) earthquake occurred 82.2 miles away from the city center, causing $50,000,000 total damage On 6/28/1992 at 11:57:34, a magnitude 7.6 (6.2 MB, 7.6 MS, 7.3 MW, Depth: 0.7 mi) earthquake occurred 92.3 miles away from Monterey Park center, causing 3 deaths (1 shaking deaths, 2 other deaths) and 400 injuries, causing $100,000,000 total damage and $40,000,000 insured losses On 10/16/1999 at 09:46:44, a magnitude 7.4 (6.3 MB, 7.4 MS, 7.2 MW, 7.3 ML) earthquake occurred 102.4 miles away from Monterey Park center On 11/4/1927 at 13:51:53, a magnitude 7.5 (7.5 UK) earthquake occurred 175.6 miles away from the city center On 1/17/1994 at 12:30:55, a magnitude 6.8 (6.4 MB, 6.8 MS, 6.7 MW, Depth: 11.4 mi, Class: Strong, Intensity: VII - IX) earthquake occurred 26.2 miles away from the city center, causing 60 deaths (60 shaking deaths) and 7000 injuries On 4/21/1918 at 22:32:30, a magnitude 6.8 (6.8 UK) earthquake occurred 43.2 miles away from Monterey Park center Magnitude types: body-wave magnitude (MB), local magnitude (ML), surface-wave magnitude (MS), moment magnitude (MW)
Natural disasters:
The number of natural disasters in Los Angeles County (57) is a lot greater than the US average (15). Major Disasters (Presidential) Declared: 27 Emergencies Declared: 3
Causes of natural disasters: Fires: 37, Floods: 16, Storms: 9, Winter Storms: 6, Landslides: 5, Mudslides: 5, Earthquakes: 3, Freeze: 1, Heavy Rain: 1, Hurricane: 1, Snow: 1, Tornado: 1, Wind: 1, Other: 1 (Note: some incidents may be assigned to more than one category).
Main business address for: INTERNATIONAL ALUMINUM CORP (METAL DOORS, SASH, FRAMES, MOLDING & TRIM).
Hospitals in Monterey Park:
GARFIELD MEDICAL CENTER (Proprietary, provides emergency services, 525 N GARFIELD AVE)
MONTEREY PARK HOSPITAL (Proprietary, 900 S ATLANTIC BLVD)
Nursing Homes in Monterey Park:
HERITAGE MANOR (610 NORTH GARFIELD AVENUE)
MONTEREY PARK CONV HOSP (416 N GARFIELD AVE)
Dialysis Facilities in Monterey Park:
DAVITA-GARFIELD HEMODIALYSIS CENTER (118 HILLIARD AVENUE)
DAVITA-MONTEREY PARK DIALYSIS CENTER (2560 CORPORATE PLACE, BUILDING D, SUITE 100-101)
GARFIELD HOME PROGRAM (228 N. GARFIELD AVENUE, #301)
PERITONEAL DIALYSIS CENTER OF AMERICA SAN GABRIEL PC (809 S. ATLANTIC BLVD., SUITE 103)
Home Health Centers in Monterey Park:
GOODWILL PLUS, INC (2310 S GARFIELD AVENUE)
SUNRISE HOME CARE INC (941 S ATLANTIC BLVD, STE 222)
TRINITYCARE EXTENDED CARE (901 CORPORATE CENTER DRIVE SUITE 406)
Amtrak stations near Monterey Park:
6 miles: LOS ANGELES (800 N. ALAMEDA ST.) . Services: ticket office, fully wheelchair accessible, enclosed waiting area, public restrooms, public payphones, snack bar, free short-term parking, paid long-term parking, car rental agency, taxi stand, public transit connection.
7 miles: PASADENA (150 S. ROBLES AVE.) - Bus Station . Services: fully wheelchair accessible, enclosed waiting area, public restrooms, public payphones, full-service food facilities, paid short-term parking, paid long-term parking, taxi stand, public transit connection.
9 miles: GLENDALE (400 W. CERRITOS AVE.) . Services: fully wheelchair accessible, public payphones, free short-term parking, free long-term parking, call for taxi service, intercity bus service, public transit connection.
MONTEREY PARK BRUGGEMEYER LIBRARY (Operating income: $1,982,394; Location: 318 S. RAMONA AVENUE; 174,169 books; 3,779 audio materials; 7,072 video materials; 1 state licensed databases; 4 other licensed databases; 156 print serial subscriptions)
User-submitted facts and corrections:
Monterey Park United Methodist Preschool was closed last year, when the Pastor attempted to take over the school herself, she did not have the proper creditals, but it was too late. Too bad for the school, too bad for the community. It was one of the oldest and best Preschool in Monterey Park.
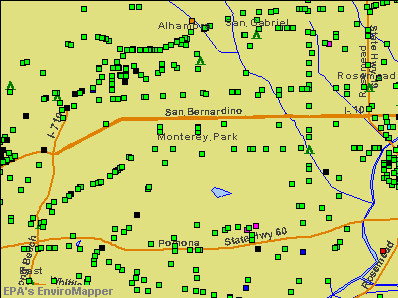
Notable locations in Monterey Park: Monterey Park Golf Course (A), Monterey Park City Hall (B), Bruggemeyer Memorial Library (C), City of Monterey Park Fire Department Station 63 (D), City of Monterey Park Fire Department Station 62 (E), City of Monterey Park Fire Department Station 61 Headquarters (F), Edison Center for the Performing Arts (G). Display/hide their locations on the map
Shopping Centers: Atlantic Square Shopping Center (1), Monterey Park Mall Shopping Center (2), Landmark Shopping Center (3). Display/hide their locations on the map
Churches in Monterey Park include: Saint Thomas More Roman Catholic Church (A), Chinese Christian Reformed Church (B), Christ Lutheran Church (C), Faith Lutheran Church (D), Monterey Park Church of the Nazarene (E), Monterey Park United Methodist Church (F), Saint Gabriels Episcopal Church (G), Saint Pauls Lutheran Church (H), Saint Stephen Catholic Church (I). Display/hide their locations on the map
Parks in Monterey Park include: Weingart Stadium (1), Barnes Memorial Park (2), Edison Trails Park (3), Garvey Ranch Park (4), Grandview Park (5), Highlands Park (6), La Loma Park (7), Sunnyslopes Park (8), George E Elder Park (9). Display/hide their locations on the map
Tourist attraction: Citslinc International Inc (108 North Ynez Avenue Suite 205).
Hotel: Best Western Hotel (434 Potrero Grande Drive).
Courts: Los Angeles County - Juvenile Court-Dependency Cases Edmund D Edelma (201 Centre Plaza Drive), Los Angeles County - Superior Court Of California-County Of Los Angeles- Juvenile C (201 Centre Plaza Drive), Children & Family Services Department - Edelmans Children's Court- Intake & Detention Con (201 Centre Plaza Drive).
Birthplace of: Vania King - Tennis player, Christina July Kim - Film actor, Danny Haren - 2005 Major League Baseball player (Oakland Athletics, born: Sep 17, 1980), John Andrews (baseball) - Professional baseball player, Robert S. Lancaster - Computer programmer & skeptic, Ellie Kawamura - Figure skater, Jason Ybarra - Actor, Andy Rincon - Baseball player, Mary Page Keller - Film actor, Mike Lansford - Football player.
Los Angeles County has a predicted average indoor radon screening level between 2 and 4 pCi/L (pico curies per liter) - Moderate Potential
Average household size:
This city:
3.0 people
California:
2.9 people
Percentage of family households:
This city:
76.3%
Whole state:
68.7%
Percentage of households with unmarried partners:
This city:
3.7%
Whole state:
7.2%
Likely homosexual households (counted as self-reported same-sex unmarried-partner households)
Lesbian couples: 0.2% of all households
Gay men: 0.2% of all households
People in group quarters in Monterey Park in 2010:
186 people in nursing facilities/skilled-nursing facilities
36 people in group homes intended for adults
5 people in other noninstitutional facilities
3 people in local jails and other municipal confinement facilities
People in group quarters in Monterey Park in 2000:
92 people in homes for the physically handicapped
85 people in nursing homes
79 people in homes for the mentally retarded
17 people in other noninstitutional group quarters
2 people in religious group quarters
2 people in other nonhousehold living situations
Banks with most branches in Monterey Park (2011 data):
East West Bank: Monterey Park-Ramona Branch, Monterey Park Branch, Monterey Park Branch. Info updated 2010/06/14: Bank assets: $21,962.4 mil, Deposits: $17,501.8 mil, headquarters in Pasadena, CA, positive income, Commercial Lending Specialization, 131 total offices, Holding Company: East West Bancorp, Inc.
Bank of America, National Association: Atlantic-Brightwood Branch, Monterey Park Branch, Atlantic-Garvey Branch. Info updated 2009/11/18: Bank assets: $1,451,969.3 mil, Deposits: $1,077,176.8 mil, headquarters in Charlotte, NC, positive income, 5782 total offices, Holding Company: Bank Of America Corporation
Wells Fargo Bank, National Association: Huntington And San Gabriel at 8204 Huntington Drive, Suite C, branch established on 2007/07/11; Monterey Park Branch at 2101 South Atlantic Boulevard, branch established on 1963/08/09. Info updated 2011/04/05: Bank assets: $1,161,490.0 mil, Deposits: $905,653.0 mil, headquarters in Sioux Falls, SD, positive income, 6395 total offices, Holding Company: Wells Fargo & Company
Chinatrust Bank (U.S.A.): Monterey Park Branch at 638 South Atlantic Boulevard, branch established on 1995/09/05. Info updated 2012/02/10: Bank assets: $1,418.6 mil, Deposits: $1,066.3 mil, headquarters in Torrance, CA, positive income, Commercial Lending Specialization, 12 total offices, Holding Company: Chinatrust Financial Holding Company, Ltd.
Bank of the West: Monterey Park Branch at 331 North Atlantic Boulevard, branch established on 1990/04/02. Info updated 2009/11/16: Bank assets: $62,408.3 mil, Deposits: $43,995.2 mil, headquarters in San Francisco, CA, positive income, 647 total offices, Holding Company: Bnp Paribas
Cathay Bank: Monterey Park Branch at 250 South Atlantic Boulevard, branch established on 1979/09/19. Info updated 2010/12/08: Bank assets: $10,628.9 mil, Deposits: $7,249.8 mil, headquarters in Los Angeles, CA, positive income, Commercial Lending Specialization, 52 total offices, Holding Company: Cathay General Bancorp
Community Commerce Bank: Monterey Park Branch at 2323 S. Atlantic Boulevard, branch established on 1990/11/15. Info updated 2009/03/12: Bank assets: $313.5 mil, Deposits: $245.1 mil, headquarters in Claremont, CA, positive income, Commercial Lending Specialization, 6 total offices
Far East National Bank: Monterey Park Branch at 809 So. Atlantic Blvd, #101-102, branch established on 1990/06/15. Info updated 2009/10/29: Bank assets: $1,397.6 mil, Deposits: $1,081.6 mil, headquarters in Los Angeles, CA, negative income in the last year, Commercial Lending Specialization, 10 total offices, Holding Company: Sinopac Financial Holdings Company Limited
California Bank & Trust: Monterey Park Branch at 2107 South Atlantic Boulevard, branch established on 1969/06/03. Info updated 2009/07/20: Bank assets: $10,894.1 mil, Deposits: $9,193.9 mil, headquarters in San Diego, CA, positive income, Commercial Lending Specialization, 109 total offices, Holding Company: Zions Bancorporation
8 other banks with 8 local branches
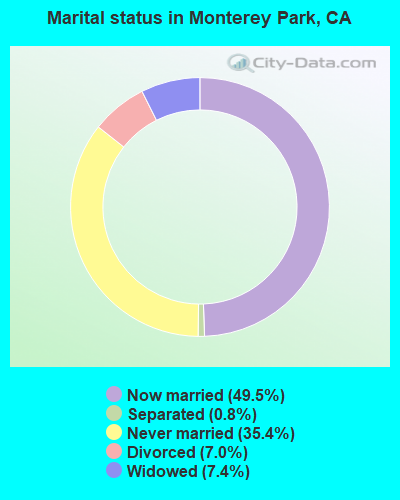
For population 15 years and over in Monterey Park:
Never married: 35.4%
Now married: 49.5%
Separated: 0.8%
Widowed: 7.4%
Divorced: 7.0%
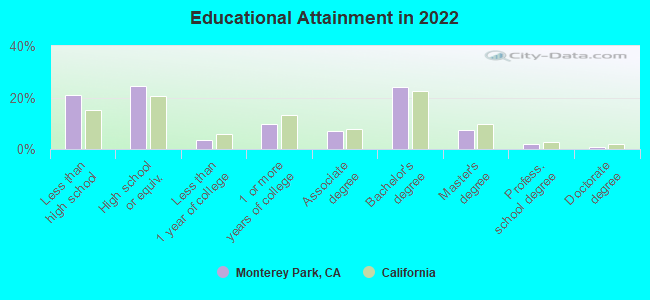
For population 25 years and over in Monterey Park:
Religion statistics for Monterey Park, CA (based on Los Angeles County data)
Religion
Adherents
Congregations
Catholic
3,542,994
275
Evangelical Protestant
814,611
3,249
Other
451,594
1,023
Mainline Protestant
229,056
860
Black Protestant
112,338
290
Orthodox
63,517
76
None
4,604,495
-
Source: Clifford Grammich, Kirk Hadaway, Richard Houseal, Dale E.Jones, Alexei Krindatch, Richie Stanley and Richard H.Taylor. 2012. 2010 U.S.Religion Census: Religious Congregations & Membership Study. Association of Statisticians of American Religious Bodies. Jones, Dale E., et al. 2002. Congregations and Membership in the United States 2000. Nashville, TN: Glenmary Research Center. Graphs represent county-level data
Richard Byrne, 2540 Corporate Place (Lat: 34.044611 Lon: -118.163611), Type: 19.5, Overall height: 18.2 m, Registrant: Towerco Assets LLC, Afry@towerco.Com, , Cary, Phone: (919) 653-5710
Richard Byrne, 2540 Corporate Place (Lat: 34.044611 Lon: -118.163611), Type: 19.5, Overall height: 18.2 m, Registrant: Towerco Assets LLC, Afry@towerco.Com, , Cary, Phone: (919) 653-5710
Edward G Roach, 2540 Corporate Place (Lat: 34.044611 Lon: -118.163611), Type: 19.5, Structure height: 06037 m, Overall height: 18.2 m, Registrant: Sba 2012 Tc Assets, LLC, Eroach@sbasite.Com, , Boca -Raton, Phone: (561) 995-7670
Edward G Roach, 2540 Corporate Place (Lat: 34.044611 Lon: -118.163611), Type: 19.5, Structure height: 06037 m, Overall height: 18.2 m, Registrant: Sba 2012 Tc Assets, LLC, Eroach@sbasite.Com, , Boca -Raton, Phone: (561) 995-7670
Mehran Nazari, 2525 Corporate Place (Lat: 34.046917 Lon: -118.163861), Type: 13.7, Structure height: 06037 m, Overall height: 12.5 m, Registrant: Los Angeles Regional Interoperable Communications System (La-Rics, Info@la-Rics.Org, Suite 100, Monte-rey Park, Phone: (323) 881-8049
Mehran Nazari, 2525 Corporate Place (Lat: 34.046917 Lon: -118.163861), Type: 13.7, Structure height: 06037 m, Overall height: 12.5 m, Licensee ID: G, Registrant: Los Angeles Regional Interoperable Communications System (La-Rics) Joint Power Authority C/O Pyramid Network Services, Swoodward@pyramidns.Com, Suite 1855, Los A-ngeles, Phone: (315) 857-6667
Aircraft: CESSNA 310 (Category: Land, Engines: 2, Seats: 5, Weight: Up to 12,499 Pounds, Speed: 167 mph), Engine: CONT MOTOR O-470 SERIES (230 HP) (Reciprocating) N-Number: 112HR, N112HR, N-112HR, Serial Number: 35217, Airworthiness Date: 12/07/1956, Certificate Issue Date: 03/27/2020 Registrant (Co-Owned): Howard Flexer, 1101 Kempton Ave, Monterey Park, CA 91755, Other Owners: Roger L Guran Deregistered:Cancel Date: 11/08/2013
Aircraft: FUNK B85C (Category: Land, Seats: 2, Weight: Up to 12,499 Pounds, Speed: 84 mph), Engine: CONT MOTOR C85 SERIES (85 HP) (Reciprocating) N-Number: 81156, N81156, N-81156, Serial Number: 286, Year manufactured: 1946 Registrant (Individual): Albert L Hanson, 1161 Ridgeside Dr, Monterey Park, CA 91754 Deregistered:Cancel Date: 05/04/2019
Aircraft: ENGINEERING & RESEARCH 415-C (Category: Land, Seats: 2, Weight: Up to 12,499 Pounds, Speed: 90 mph), Engine: CONT MOTOR A&C75 SERIES (75 HP) (Reciprocating) N-Number: 87192, N87192, N-87192, Serial Number: 365, Year manufactured: 1946 Registrant (Individual): James William Taylor, 855 El Repetto Drive Apt 41, Monterey Park, CA 91754 Deregistered:Cancel Date: 08/05/2019
Aircraft: YUNEEC INTERNATIONAL LTD YUNEEC E430 (Category: Land, Seats: 2, Weight: Up to 12,499 Pounds), Engine: AMA/EXPR UNKNOWN ENG (Unknown) N-Number: 418WZ, N418WZ, N-418WZ, Serial Number: YN-E430-0004, Year manufactured: 2010, Airworthiness Date: 12/22/2010, Certificate Issue Date: 01/26/2011 Registrant (Corporation): Flying Tian Inc, 939 S Atlantic Blvd Ste 217, Monterey Park, CA 91754 Deregistered:Cancel Date: 09/08/2017
Home Mortgage Disclosure Act Aggregated Statistics For Year 2009 (Based on 14 full and 1 partial tracts)
A) FHA, FSA/RHS & VA Home Purchase Loans
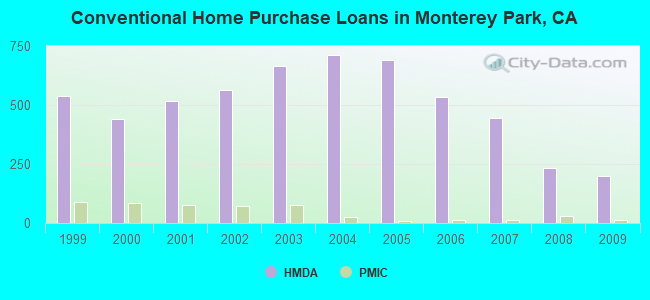
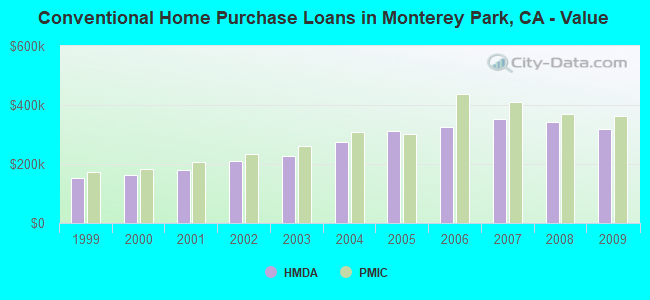
B) Conventional Home Purchase Loans
C) Refinancings
D) Home Improvement Loans
E) Loans on Dwellings For 5+ Families
F) Non-occupant Loans on < 5 Family Dwellings (A B C & D)
G) Loans On Manufactured Home Dwelling (A B C & D)
Number
Average Value
Number
Average Value
Number
Average Value
Number
Average Value
Number
Average Value
Number
Average Value
Number
Average Value
LOANS ORIGINATED
21
$390,604
198
$317,855
833
$297,347
41
$245,505
6
$781,333
76
$259,106
0
$0
APPLICATIONS APPROVED, NOT ACCEPTED
2
$258,000
25
$342,836
109
$304,915
9
$171,186
0
$0
8
$251,125
0
$0
APPLICATIONS DENIED
1
$451,000
48
$314,425
258
$313,124
18
$165,032
1
$560,000
33
$260,075
1
$395,000
APPLICATIONS WITHDRAWN
3
$376,667
44
$314,866
150
$339,037
11
$117,545
0
$0
13
$220,654
0
$0
FILES CLOSED FOR INCOMPLETENESS
1
$170,350
11
$327,055
64
$310,676
4
$338,750
0
$0
9
$290,222
0
$0
Aggregated Statistics For Year 2008 (Based on 14 full and 1 partial tracts)
A) FHA, FSA/RHS & VA Home Purchase Loans
B) Conventional Home Purchase Loans
C) Refinancings
D) Home Improvement Loans
E) Loans on Dwellings For 5+ Families
F) Non-occupant Loans on < 5 Family Dwellings (A B C & D)
G) Loans On Manufactured Home Dwelling (A B C & D)
Number
Average Value
Number
Average Value
Number
Average Value
Number
Average Value
Number
Average Value
Number
Average Value
Number
Average Value
LOANS ORIGINATED
10
$463,446
231
$343,238
414
$303,214
38
$171,841
16
$1,046,375
65
$275,095
0
$0
APPLICATIONS APPROVED, NOT ACCEPTED
0
$0
48
$328,267
98
$319,855
11
$272,821
0
$0
17
$240,201
4
$90,250
APPLICATIONS DENIED
2
$310,500
64
$352,363
241
$347,333
34
$144,103
1
$380,000
27
$329,149
3
$59,667
APPLICATIONS WITHDRAWN
2
$255,440
50
$342,987
108
$346,059
8
$309,188
0
$0
14
$325,679
0
$0
FILES CLOSED FOR INCOMPLETENESS
0
$0
19
$310,022
42
$324,041
11
$266,440
0
$0
7
$271,571
0
$0
Aggregated Statistics For Year 2007 (Based on 14 full and 1 partial tracts)
B) Conventional Home Purchase Loans
C) Refinancings
D) Home Improvement Loans
E) Loans on Dwellings For 5+ Families
F) Non-occupant Loans on < 5 Family Dwellings (A B C & D)
G) Loans On Manufactured Home Dwelling (A B C & D)
Number
Average Value
Number
Average Value
Number
Average Value
Number
Average Value
Number
Average Value
Number
Average Value
LOANS ORIGINATED
444
$352,088
624
$319,065
103
$221,282
14
$1,717,500
112
$310,489
0
$0
APPLICATIONS APPROVED, NOT ACCEPTED
117
$358,869
162
$327,887
29
$207,995
1
$1,000,000
26
$360,912
0
$0
APPLICATIONS DENIED
106
$430,761
299
$351,569
58
$197,857
1
$700,000
26
$358,885
2
$81,500
APPLICATIONS WITHDRAWN
50
$362,157
170
$319,313
32
$259,581
1
$460,000
12
$348,833
0
$0
FILES CLOSED FOR INCOMPLETENESS
28
$396,735
63
$334,024
3
$215,000
0
$0
8
$344,456
0
$0
Aggregated Statistics For Year 2006 (Based on 14 full and 1 partial tracts)
B) Conventional Home Purchase Loans
C) Refinancings
D) Home Improvement Loans
E) Loans on Dwellings For 5+ Families
F) Non-occupant Loans on < 5 Family Dwellings (A B C & D)
G) Loans On Manufactured Home Dwelling (A B C & D)
Number
Average Value
Number
Average Value
Number
Average Value
Number
Average Value
Number
Average Value
Number
Average Value
LOANS ORIGINATED
533
$324,428
824
$323,247
124
$224,316
15
$1,754,933
110
$313,766
2
$59,000
APPLICATIONS APPROVED, NOT ACCEPTED
128
$345,740
175
$318,315
12
$371,527
1
$730,000
27
$334,599
2
$70,000
APPLICATIONS DENIED
187
$320,795
315
$349,113
59
$187,813
4
$448,000
46
$254,664
0
$0
APPLICATIONS WITHDRAWN
113
$340,060
238
$317,455
35
$209,305
0
$0
16
$352,222
0
$0
FILES CLOSED FOR INCOMPLETENESS
21
$353,269
58
$283,076
4
$141,950
0
$0
6
$303,000
1
$487,000
Aggregated Statistics For Year 2005 (Based on 14 full and 1 partial tracts)
B) Conventional Home Purchase Loans
C) Refinancings
D) Home Improvement Loans
E) Loans on Dwellings For 5+ Families
F) Non-occupant Loans on < 5 Family Dwellings (A B C & D)
G) Loans On Manufactured Home Dwelling (A B C & D)
Number
Average Value
Number
Average Value
Number
Average Value
Number
Average Value
Number
Average Value
Number
Average Value
LOANS ORIGINATED
689
$312,174
977
$291,175
155
$204,146
28
$2,699,181
169
$289,716
1
$100,000
APPLICATIONS APPROVED, NOT ACCEPTED
103
$296,230
193
$288,176
17
$190,118
3
$885,000
23
$310,209
0
$0
APPLICATIONS DENIED
171
$305,762
298
$320,460
56
$178,852
5
$960,000
40
$354,377
0
$0
APPLICATIONS WITHDRAWN
99
$301,345
318
$291,186
38
$207,733
2
$1,250,000
23
$245,612
0
$0
FILES CLOSED FOR INCOMPLETENESS
39
$270,431
83
$313,045
7
$236,857
0
$0
1
$359,000
0
$0
Aggregated Statistics For Year 2004 (Based on 14 full and 1 partial tracts)
A) FHA, FSA/RHS & VA Home Purchase Loans
B) Conventional Home Purchase Loans
C) Refinancings
D) Home Improvement Loans
E) Loans on Dwellings For 5+ Families
F) Non-occupant Loans on < 5 Family Dwellings (A B C & D)
G) Loans On Manufactured Home Dwelling (A B C & D)
Number
Average Value
Number
Average Value
Number
Average Value
Number
Average Value
Number
Average Value
Number
Average Value
Number
Average Value
LOANS ORIGINATED
1
$280,440
712
$273,197
1,398
$240,722
147
$172,299
30
$630,700
175
$242,003
1
$27,000
APPLICATIONS APPROVED, NOT ACCEPTED
0
$0
160
$280,849
270
$235,172
20
$182,041
0
$0
49
$236,415
0
$0
APPLICATIONS DENIED
0
$0
156
$256,176
416
$264,017
73
$164,537
0
$0
41
$240,486
0
$0
APPLICATIONS WITHDRAWN
0
$0
83
$285,377
367
$244,098
30
$116,433
3
$1,255,000
28
$272,562
0
$0
FILES CLOSED FOR INCOMPLETENESS
0
$0
29
$238,844
108
$263,445
7
$132,571
0
$0
11
$198,217
0
$0
Aggregated Statistics For Year 2003 (Based on 14 full and 1 partial tracts)
A) FHA, FSA/RHS & VA Home Purchase Loans
B) Conventional Home Purchase Loans
C) Refinancings
D) Home Improvement Loans
E) Loans on Dwellings For 5+ Families
F) Non-occupant Loans on < 5 Family Dwellings (A B C & D)
Number
Average Value
Number
Average Value
Number
Average Value
Number
Average Value
Number
Average Value
Number
Average Value
LOANS ORIGINATED
6
$213,427
664
$228,321
3,126
$188,006
50
$99,416
41
$837,000
305
$188,684
APPLICATIONS APPROVED, NOT ACCEPTED
0
$0
106
$225,427
482
$200,156
10
$82,997
2
$889,000
50
$179,829
APPLICATIONS DENIED
0
$0
127
$220,240
548
$197,179
31
$66,381
1
$8,625,000
70
$198,294
APPLICATIONS WITHDRAWN
2
$202,500
85
$218,985
577
$196,691
11
$38,185
1
$500,000
32
$193,644
FILES CLOSED FOR INCOMPLETENESS
1
$261,000
36
$253,015
102
$208,871
2
$31,500
0
$0
16
$228,983
Aggregated Statistics For Year 2002 (Based on 10 full and 1 partial tracts)
A) FHA, FSA/RHS & VA Home Purchase Loans
B) Conventional Home Purchase Loans
C) Refinancings
D) Home Improvement Loans
E) Loans on Dwellings For 5+ Families
F) Non-occupant Loans on < 5 Family Dwellings (A B C & D)
Number
Average Value
Number
Average Value
Number
Average Value
Number
Average Value
Number
Average Value
Number
Average Value
LOANS ORIGINATED
9
$201,348
565
$209,410
1,647
$181,710
25
$58,149
27
$670,015
154
$176,134
APPLICATIONS APPROVED, NOT ACCEPTED
1
$173,000
70
$216,941
256
$173,607
9
$69,444
1
$345,000
16
$175,675
APPLICATIONS DENIED
1
$316,370
52
$161,813
287
$162,703
25
$41,591
3
$675,667
21
$160,284
APPLICATIONS WITHDRAWN
2
$205,000
62
$200,466
266
$185,640
6
$41,000
5
$811,600
12
$181,425
FILES CLOSED FOR INCOMPLETENESS
1
$316,370
23
$191,890
98
$174,592
1
$51,900
1
$1,388,000
7
$159,429
Aggregated Statistics For Year 2001 (Based on 10 full and 1 partial tracts)
A) FHA, FSA/RHS & VA Home Purchase Loans
B) Conventional Home Purchase Loans
C) Refinancings
D) Home Improvement Loans
E) Loans on Dwellings For 5+ Families
F) Non-occupant Loans on < 5 Family Dwellings (A B C & D)
Number
Average Value
Number
Average Value
Number
Average Value
Number
Average Value
Number
Average Value
Number
Average Value
LOANS ORIGINATED
25
$199,825
516
$178,244
967
$162,707
69
$40,931
17
$697,412
92
$159,275
APPLICATIONS APPROVED, NOT ACCEPTED
3
$194,857
47
$191,246
155
$158,789
9
$54,332
2
$635,000
17
$163,751
APPLICATIONS DENIED
1
$164,000
70
$190,685
304
$159,335
51
$27,961
1
$551,000
29
$157,250
APPLICATIONS WITHDRAWN
1
$160,000
59
$190,476
176
$170,130
18
$43,266
1
$469,000
14
$134,844
FILES CLOSED FOR INCOMPLETENESS
0
$0
21
$189,010
73
$153,866
2
$22,500
3
$1,040,000
4
$142,152
Aggregated Statistics For Year 2000 (Based on 10 full and 1 partial tracts)
A) FHA, FSA/RHS & VA Home Purchase Loans
B) Conventional Home Purchase Loans
C) Refinancings
D) Home Improvement Loans
E) Loans on Dwellings For 5+ Families
F) Non-occupant Loans on < 5 Family Dwellings (A B C & D)
Number
Average Value
Number
Average Value
Number
Average Value
Number
Average Value
Number
Average Value
Number
Average Value
LOANS ORIGINATED
17
$165,909
439
$164,403
216
$132,041
68
$44,965
13
$563,154
46
$147,622
APPLICATIONS APPROVED, NOT ACCEPTED
4
$196,912
72
$162,400
49
$110,362
25
$34,849
0
$0
3
$124,120
APPLICATIONS DENIED
4
$201,750
62
$152,965
118
$138,409
42
$25,732
0
$0
7
$133,040
APPLICATIONS WITHDRAWN
3
$121,347
54
$152,904
95
$115,523
8
$101,362
0
$0
11
$139,419
FILES CLOSED FOR INCOMPLETENESS
3
$160,897
14
$180,040
38
$155,274
2
$26,000
1
$1,000,000
1
$40,000
Aggregated Statistics For Year 1999 (Based on 8 full and 5 partial tracts)
A) FHA, FSA/RHS & VA Home Purchase Loans
B) Conventional Home Purchase Loans
C) Refinancings
D) Home Improvement Loans
E) Loans on Dwellings For 5+ Families
F) Non-occupant Loans on < 5 Family Dwellings (A B C & D)
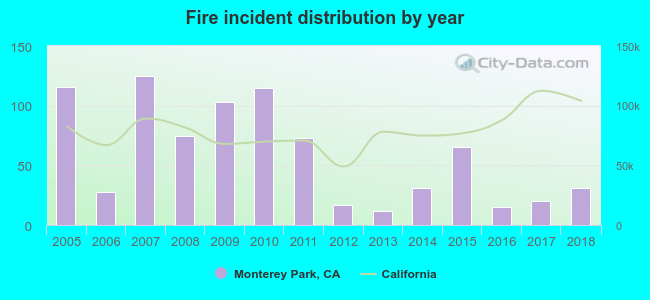
2005 - 2018 National Fire Incident Reporting System (NFIRS) incidents
Based on the data from the years 2005 - 2018 the average number of fire incidents per year is 59. The highest number of reported fires - 125 took place in 2007, and the least - 12 in 2013. The data has a decreasing trend.
When looking into fire subcategories, the most reports belonged to: Structure Fires (51.2%), and Outside Fires (24.1%).
Fire incident types reported to NFIRS in Monterey Park, CA
#1 on the list of "Top 101 cities with the most residents born in China, excluding Hong Kong and Taiwan (population 500+)"
#1 on the list of "Top 101 cities with the most residents born in China (population 500+)"
#4 on the list of "Top 101 cities with the most residents born in Eastern Asia (population 500+)"
#5 on the list of "Top 101 cities with the lowest number of rapes per 100,000 residents (population 50,000+)"
#5 on the list of "Top 101 cities with the most residents born in Hong Kong (population 500+)"
#11 on the list of "Top 101 cities with the most residents born in Asia (population 500+)"
#11 on the list of "Top 100 cities with highest percentage of foreign-born residents (pop. 50,000+)"
#18 on the list of "Top 101 cities with the lowest number of thefts per 100,000 residents (population 50,000+)"
#21 on the list of "Top 101 larger cities with the highest increase in house/condo value from 2000 (population 50,000+)"
#25 on the list of "Top 101 cities with the most residents born in Vietnam (population 500+)"
#25 on the list of "Top 101 cities with the most residents born in Taiwan (population 500+)"
#26 on the list of "Top 101 cities with the lowest percentage of English-only speaking households, population 50,000+"
#26 on the list of "Top 101 cities with the smallest percentage of likely homosexual households (counted as self-reported same-sex unmarried-partner households) (population 50,000+)"
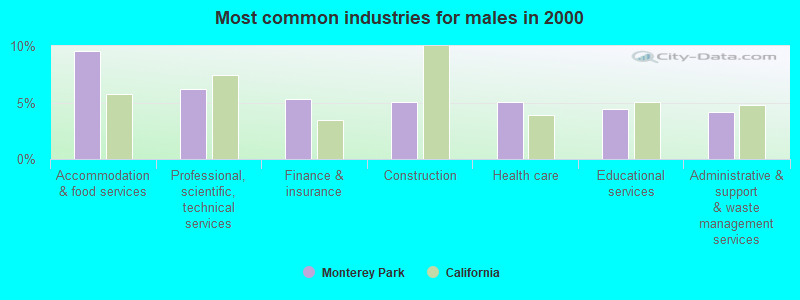
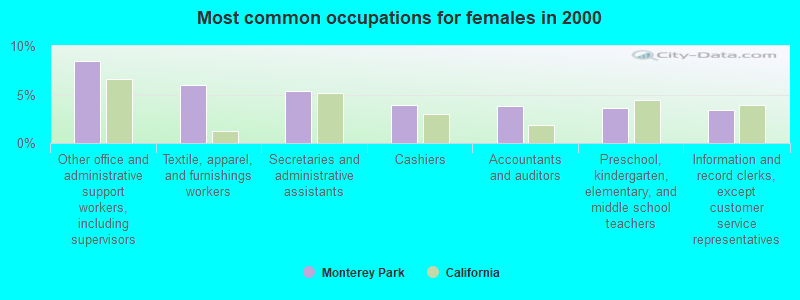
#27 on the list of "Top 101 cities with largest percentage of males in industries: wholesale trade (population 50,000+)"
#27 on the list of "Top 100 cities with highest ratio of median house value to median household income (pop. 50,000+)"
#38 on the list of "Top 101 cities with the smallest percentage of unmarried partner households (population 50,000+)"
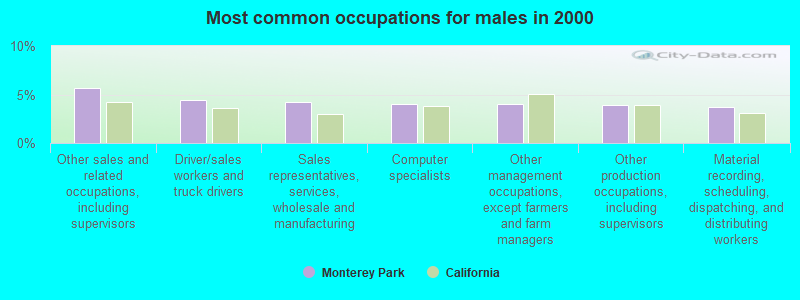
#40 on the list of "Top 101 cities with largest percentage of males in occupations: personal care and service occupations (population 50,000+)"
#41 on the list of "Top 101 cities with the highest ratio of murders to rapes between 2002 and 2012 (population 50,000+)"
#42 on the list of "Top 101 cities with the lowest number of assaults per 100,000 residents (population 50,000+)"
#42 on the list of "Top 100 cities with oldest residents (pop. 50,000+)"
#1 on the list of "Top 101 counties with the most Evangelical Protestant congregations"
#1 on the list of "Top 101 counties with the most Mainline Protestant congregations"
#1 on the list of "Top 101 counties with the most Orthodox adherents"
#1 on the list of "Top 101 counties with the highest ground withdrawal of fresh water for public supply (pop. 50,000+)"
#1 on the list of "Top 101 counties with the most Catholic adherents (pop. 50,000+)"


 Recent articles from our blog. Our writers, many of them Ph.D. graduates or candidates, create easy-to-read articles on a wide variety of topics.

 , pop. 320,008).


 Based on the data from the years 2005 - 2018 the average number of fire incidents per year is 59. The highest number of reported fires - 125 took place in 2007, and the least - 12 in 2013. The data has a decreasing trend.
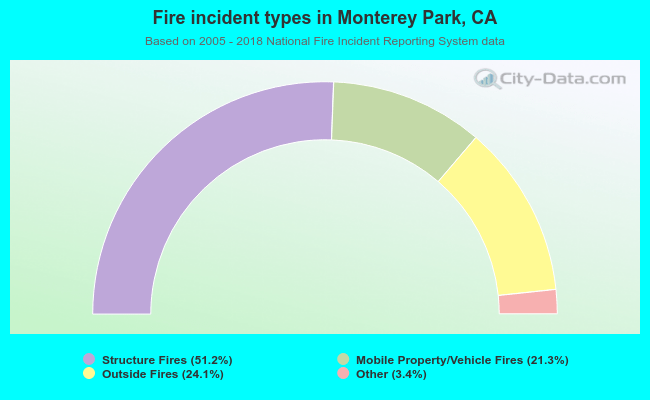 When looking into fire subcategories, the most reports belonged to: Structure Fires (51.2%), and Outside Fires (24.1%).