Estimated zip code population in 2022: 58,916 Zip code population in 2010: 62,097 Zip code population in 2000: 61,605
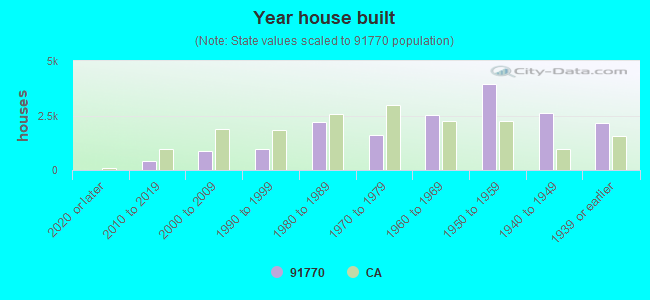
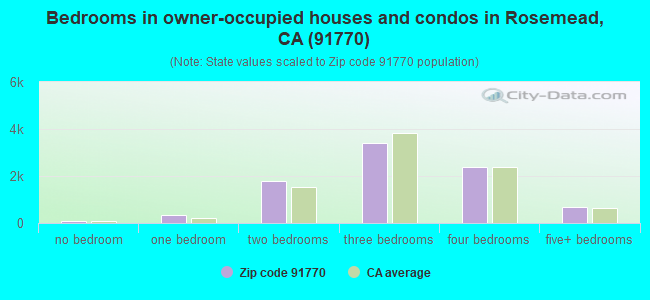
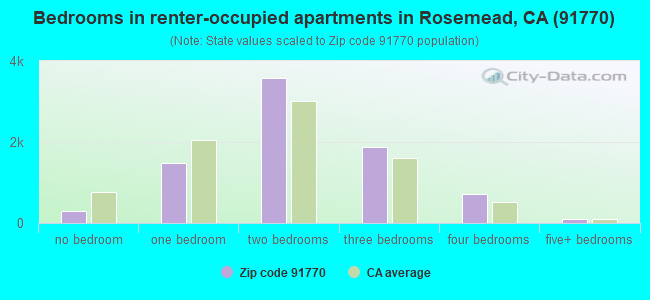
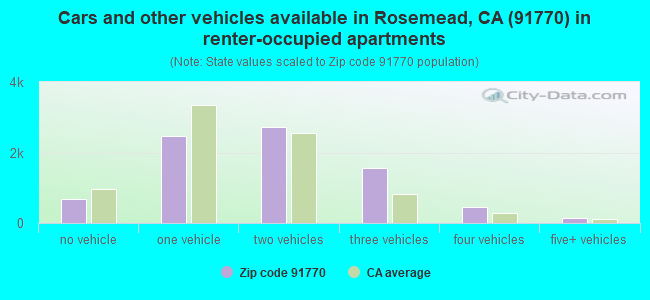
Houses and condos: 17,671 Renter-occupied apartments: 8,079
% of renters here:
48%
State:
44%
March 2022 cost of living index in zip code 91770: 136.9 (high, U.S. average is 100)
Land area: 6.4 sq. mi. Water area: 0.1 sq. mi.
Population density: 9,173 people per square mile
(high).
OSM Map
General Map
Google Map
MSN Map
OSM Map
General Map
Google Map
MSN Map
OSM Map
General Map
Google Map
MSN Map
OSM Map
General Map
Google Map
MSN Map
Please wait while loading the map...
Real estate property taxes paid for housing units in 2022:
This zip code:
0.7% ($4,948)
California:
0.7% ($4,831)
Median real estate property taxes paid for housing units with mortgages in 2022: $5,901 (0.8%) Median real estate property taxes paid for housing units with no mortgage in 2022: $4,139 (0.6%)
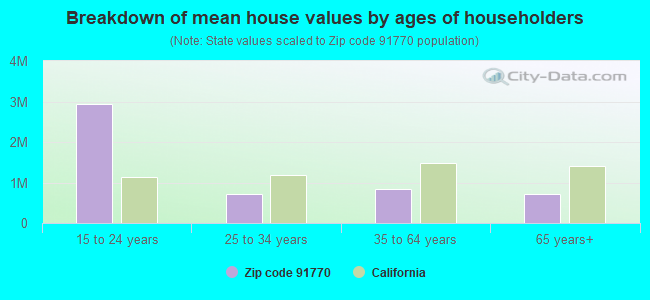
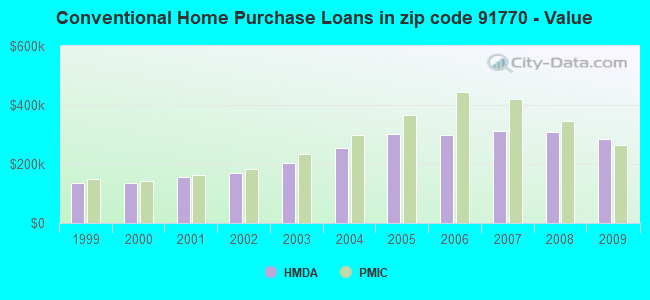
Estimated median house/condo value in 2022: $731,645
91770:
$731,645
California:
$715,900
According to our research of California and other state lists, there were 52 registered sex offenders living in 91770 zip code as of April 27, 2024. The ratio of all residents to sex offenders in zip code 91770 is 1,240 to 1. The ratio of registered sex offenders to all residents in this zip code is lower than the state average.
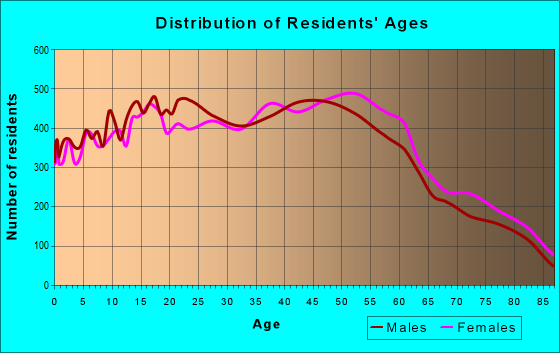
Median resident age:
This zip code:
43.9 years
California median age:
37.9 years
Average household size:
This zip code:
3.5 people
California:
2.8 people
Averages for the 2020 tax year for zip code 91770, filed in 2021:
Average Adjusted Gross Income (AGI) in 2020: $45,279 (Individual Income Tax Returns)
Here:
$45,279
State:
$95,910
Salary/wage: $41,972 (reported on 77.5% of returns)
Here:
$41,972
State:
$77,331
(% of AGI for various income ranges: 1103.3% for AGIs below $25k, 3869.5% for AGIs $25k-50k, 7637.7% for AGIs $50k-75k, 11280.2% for AGIs $75k-100k, 21265.6% for AGIs $100k-200k, 83055.8% for AGIs over 200k)
Taxable interest for individuals: $1,137 (reported on 26.5% of returns)
This zip code:
$1,137
California:
$2,294
(% of AGI for various income ranges: 15.7% for AGIs below $25k, 24.2% for AGIs $25k-50k, 52.8% for AGIs $50k-75k, 77.0% for AGIs $75k-100k, 215.8% for AGIs $100k-200k, 1484.2% for AGIs over 200k)
Ordinary dividends: $2,171 (reported on 13.4% of returns)
Here:
$2,171
State:
$10,949
(% of AGI for various income ranges: 9.0% for AGIs below $25k, 15.1% for AGIs $25k-50k, 48.2% for AGIs $50k-75k, 81.3% for AGIs $75k-100k, 201.5% for AGIs $100k-200k, 2300.8% for AGIs over 200k)
Net capital gain/loss in AGI: +$8,686 (reported on 15.2% of returns)
Here:
+$8,686
State:
+$49,306
(% of AGI for various income ranges: 5.3% for AGIs below $25k, 30.3% for AGIs $25k-50k, 103.9% for AGIs $50k-75k, 251.7% for AGIs $75k-100k, 920.5% for AGIs $100k-200k, 18263.3% for AGIs over 200k)
Profit/loss from business: +$8,346 (reported on 21.5% of returns)
Here:
+$8,346
State:
+$15,671
(% of AGI for various income ranges: 257.5% for AGIs below $25k, 262.3% for AGIs $25k-50k, 237.5% for AGIs $50k-75k, 294.9% for AGIs $75k-100k, 526.2% for AGIs $100k-200k, 2747.5% for AGIs over 200k)
Taxable individual retirement arrangement distribution: $15,552 (reported on 3.5% of returns)
91770:
$15,552
California:
$23,505
(% of AGI for various income ranges: 27.2% for AGIs below $25k, 38.5% for AGIs $25k-50k, 89.4% for AGIs $50k-75k, 181.1% for AGIs $75k-100k, 398.2% for AGIs $100k-200k, 2742.5% for AGIs over 200k)
Self-employed (Keogh) retirement plans: $12,925 (reported on 0.1% of returns)
91770:
$12,925
California:
$30,163
(% of AGI for various income ranges: 45.8% for AGIs $100k-200k)
Total itemized deductions: $30,466 (reported on 7.3% of returns)
Here:
$30,466
State:
$39,517
(% of AGI for various income ranges: 48.0% for AGIs below $25k, 139.2% for AGIs $25k-50k, 378.0% for AGIs $50k-75k, 790.4% for AGIs $75k-100k, 1856.1% for AGIs $100k-200k, 12434.2% for AGIs over 200k)
Charity contributions: $4,712 (reported on 5.3% of returns)
Here:
$4,712
State:
$12,598
(% of AGI for various income ranges: 1.0% for AGIs below $25k, 11.7% for AGIs $25k-50k, 37.2% for AGIs $50k-75k, 90.5% for AGIs $75k-100k, 248.4% for AGIs $100k-200k, 1588.3% for AGIs over 200k)
Taxes paid: $8,517 (reported on 7.3% of returns)
91770:
$8,517
State:
$8,807
(% of AGI for various income ranges: 13.4% for AGIs below $25k, 42.8% for AGIs $25k-50k, 122.6% for AGIs $50k-75k, 264.4% for AGIs $75k-100k, 596.1% for AGIs $100k-200k, 1740.0% for AGIs over 200k)
Earned income credit: $1,852 (reported on 23.2% of returns)
Here:
$1,852
State:
$2,074
(% of AGI for various income ranges: 101.8% for AGIs below $25k, 86.9% for AGIs $25k-50k, 1.4% for AGIs $50k-75k)
Percentage of individuals using paid preparers for their 2020 taxes: 90.0%
Here:
90%
State:
92%
(% for various income ranges: 88.4% for AGIs below $25k, 91.3% for AGIs $25k-50k, 91.0% for AGIs $50k-75k, 91.3% for AGIs $75k-100k, 90.6% for AGIs $100k-200k, 91.8% for AGIs over 200k)
Averages for the 2012 tax year for zip code 91770, filed in 2013:
Average Adjusted Gross Income (AGI) in 2012: $35,341 (Individual Income Tax Returns)
Here:
$35,341
State:
$72,726
Salary/wage: $34,091 (reported on 83.0% of returns)
Here:
$34,091
State:
$59,079
(% of AGI for various income ranges: 74.4% for AGIs below $25k, 86.0% for AGIs $25k-50k, 84.7% for AGIs $50k-75k, 81.0% for AGIs $75k-100k, 80.1% for AGIs $100k-200k, 51.5% for AGIs over 200k)
Taxable interest for individuals: $644 (reported on 27.3% of returns)
This zip code:
$644
California:
$2,146
(% of AGI for various income ranges: 0.5% for AGIs below $25k, 0.4% for AGIs $25k-50k, 0.5% for AGIs $50k-75k, 0.5% for AGIs $75k-100k, 0.6% for AGIs $100k-200k, 0.8% for AGIs over 200k)
Ordinary dividends: $2,046 (reported on 10.4% of returns)
Here:
$2,046
State:
$9,308
(% of AGI for various income ranges: 0.4% for AGIs below $25k, 0.4% for AGIs $25k-50k, 0.4% for AGIs $50k-75k, 0.6% for AGIs $75k-100k, 0.8% for AGIs $100k-200k, 2.6% for AGIs over 200k)
Net capital gain/loss in AGI: +$2,271 (reported on 9.6% of returns)
Here:
+$2,271
State:
+$30,460
(% of AGI for various income ranges: 0.7% for AGIs $75k-100k, 1.1% for AGIs $100k-200k, 8.6% for AGIs over 200k)
Profit/loss from business: +$9,858 (reported on 20.0% of returns)
Here:
+$9,858
State:
+$17,064
(% of AGI for various income ranges: 16.1% for AGIs below $25k, 4.9% for AGIs $25k-50k, 2.6% for AGIs $50k-75k, 1.8% for AGIs $75k-100k, 1.9% for AGIs $100k-200k, 3.9% for AGIs over 200k)
Taxable individual retirement arrangement distribution: $11,429 (reported on 3.8% of returns)
91770:
$11,429
California:
$19,557
(% of AGI for various income ranges: 1.1% for AGIs below $25k, 1.0% for AGIs $25k-50k, 1.4% for AGIs $50k-75k, 1.5% for AGIs $75k-100k, 1.8% for AGIs $100k-200k)
Self-employment retirement plans: $24,900 (reported on 0.1% of returns)
91770:
$24,900
California:
$24,530
Total itemized deductions: $21,640 (29% of AGI, reported on 21.4% of returns)
Here:
$21,640
State:
$34,004
Here:
29.3% of AGI
State:
22.7% of AGI
(% of AGI for various income ranges: 5.5% for AGIs below $25k, 10.4% for AGIs $25k-50k, 14.7% for AGIs $50k-75k, 17.1% for AGIs $75k-100k, 18.3% for AGIs $100k-200k, 19.6% for AGIs over 200k)
Charity contributions: $2,212 (reported on 15.4% of returns)
Here:
$2,212
State:
$4,659
(% of AGI for various income ranges: 0.2% for AGIs below $25k, 0.7% for AGIs $25k-50k, 1.2% for AGIs $50k-75k, 1.3% for AGIs $75k-100k, 1.6% for AGIs $100k-200k, 1.1% for AGIs over 200k)
Taxes paid: $7,400 (reported on 21.3% of returns)
91770:
$7,400
State:
$14,448
(% of AGI for various income ranges: 1.3% for AGIs below $25k, 2.8% for AGIs $25k-50k, 4.6% for AGIs $50k-75k, 5.9% for AGIs $75k-100k, 7.6% for AGIs $100k-200k, 9.0% for AGIs over 200k)
Earned income credit: $2,139 (reported on 32.1% of returns)
Here:
$2,139
State:
$2,286
(% of AGI for various income ranges: 8.4% for AGIs below $25k, 1.4% for AGIs $25k-50k)
Percentage of individuals using paid preparers for their 2012 taxes: 72.9%
Here:
73%
State:
64%
(% for various income ranges: 72.7% for AGIs below $25k, 73.6% for AGIs $25k-50k, 73.4% for AGIs $50k-75k, 72.5% for AGIs $75k-100k, 69.9% for AGIs $100k-200k, 80.0% for AGIs over 200k)
Averages for the 2004 tax year for zip code 91770, filed in 2005:
Average Adjusted Gross Income (AGI) in 2004: $30,581 (Individual Income Tax Returns)
Here:
$30,581
State:
$58,600
Salary/wage: $29,062 (reported on 85.8% of returns)
Here:
$29,062
State:
$49,455
(% of AGI for various income ranges: 97.7% for AGIs below $10k, 82.2% for AGIs $10k-25k, 89.2% for AGIs $25k-50k, 86.6% for AGIs $50k-75k, 84.0% for AGIs $75k-100k, 57.6% for AGIs over 100k)
Taxable interest for individuals: $979 (reported on 37.1% of returns)
This zip code:
$979
California:
$2,365
(% of AGI for various income ranges: 2.9% for AGIs below $10k, 1.0% for AGIs $10k-25k, 0.9% for AGIs $25k-50k, 0.9% for AGIs $50k-75k, 1.1% for AGIs $75k-100k, 1.9% for AGIs over 100k)
Taxable dividends: $1,284 (reported on 11.8% of returns)
Here:
$1,284
State:
$4,746
(% of AGI for various income ranges: 1.0% for AGIs below $10k, 0.4% for AGIs $10k-25k, 0.3% for AGIs $25k-50k, 0.5% for AGIs $50k-75k, 0.5% for AGIs $75k-100k, 0.8% for AGIs over 100k)
Net capital gain/loss: +$6,201 (reported on 11.1% of returns)
Here:
+$6,201
State:
+$23,418
(% of AGI for various income ranges: -1.3% for AGIs below $10k, -0.2% for AGIs $10k-25k, 0.1% for AGIs $25k-50k, 0.5% for AGIs $50k-75k, 1.4% for AGIs $75k-100k, 11.7% for AGIs over 100k)
Profit/loss from business: +$9,111 (reported on 17.0% of returns)
Here:
+$9,111
State:
+$16,826
(% of AGI for various income ranges: 17.6% for AGIs below $10k, 10.0% for AGIs $10k-25k, 3.9% for AGIs $25k-50k, 2.8% for AGIs $50k-75k, 2.1% for AGIs $75k-100k, 3.9% for AGIs over 100k)
IRA payment deduction: $3,241 (reported on 3.8% of returns)
91770:
$3,241
California:
$3,192
(% of AGI for various income ranges: 0.3% for AGIs below $10k, 0.3% for AGIs $10k-25k, 0.6% for AGIs $25k-50k, 0.4% for AGIs $50k-75k, 0.3% for AGIs $75k-100k, 0.2% for AGIs over 100k)
Self-employed pension: $11,313 (reported on 0.3% of returns)
Here:
$11,313
California:
$17,688
(% of AGI for various income ranges: 0.1% for AGIs $25k-50k, 0.1% for AGIs $50k-75k, 0.1% for AGIs $75k-100k, 0.2% for AGIs over 100k)
Total itemized deductions: $17,984 (29% of AGI, reported on 23.8% of returns)
Here:
$17,984
State:
$28,113
Here:
29.3% of AGI
State:
25.3% of AGI
(% of AGI for various income ranges: 7.2% for AGIs below $10k, 8.0% for AGIs $10k-25k, 13.0% for AGIs $25k-50k, 17.8% for AGIs $50k-75k, 18.0% for AGIs $75k-100k, 16.4% for AGIs over 100k)
Charity contributions deductions: $2,130 (3% of AGI, reported on 18.9% of returns)
Here:
$2,130
State:
$3,923
Here:
3.2% of AGI
State:
3.3% of AGI
(% of AGI for various income ranges: 0.2% for AGIs below $10k, 0.5% for AGIs $10k-25k, 1.1% for AGIs $25k-50k, 1.8% for AGIs $50k-75k, 1.9% for AGIs $75k-100k, 1.8% for AGIs over 100k)
Total tax: $3,860 (reported on 65.9% of returns)
91770:
$3,860
State:
$10,761
(% of AGI for various income ranges: 4.4% for AGIs below $10k, 3.9% for AGIs $10k-25k, 6.1% for AGIs $25k-50k, 8.5% for AGIs $50k-75k, 10.2% for AGIs $75k-100k, 16.1% for AGIs over 100k)
Earned income credit: $1,783 (reported on 29.4% of returns)
Here:
$1,783
State:
$1,763
Percentage of individuals using paid preparers for their 2004 taxes: 70.8%
Here:
71%
State:
66%
(% for various income ranges: 66.8% for AGIs below $10k, 73.0% for AGIs $10k-25k, 70.8% for AGIs $25k-50k, 72.6% for AGIs $50k-75k, 69.6% for AGIs $75k-100k, 71.8% for AGIs over 100k)
Likely homosexual households (counted as self-reported same-sex unmarried-partner households)
Lesbian couples: 0.1% of all households
Gay men: 0.0% of all households
Household received Food Stamps/SNAP in the past 12 months: 1,712 Household did not receive Food Stamps/SNAP in the past 12 months: 14,945
Women who had a birth in the past 12 months: 256 (155 now married, 101 unmarried) Women who did not have a birth in the past 12 months: 12,352 (5,039 now married, 7,306 unmarried)
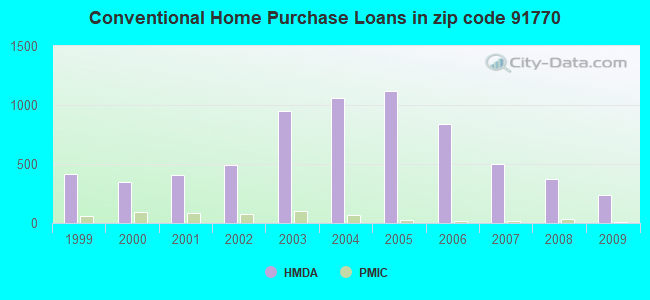
Housing units in zip code 91770 with a mortgage: 4,599 (338 second mortgage, 11 home equity loan, 241 both second mortgage and home equity loan) Houses without a mortgage: 64
Median monthly owner costs for units with a mortgage: $2,517 Median monthly owner costs for units without a mortgage: $626
Residents with income below the poverty level in 2022:
This zip code:
11.7%
Whole state:
12.2%
Residents with income below 50% of the poverty level in 2022:
This zip code:
7.5%
Whole state:
6.2%
Median number of rooms in houses and condos:
Here:
5.5
State:
6.0
Median number of rooms in apartments:
Here:
4.1
State:
3.9
Notable locations in this zip code not listed on our city pages
Notable locations in zip code 91770: Whittier Narrows Golf Course (A), Rosemead Branch County of Los Angeles Public Library (B), Maryvale Orphanage (C), Medic 1 Ambulance Service Rosemead (D), Specialty Transportation (E), California Christian Home (F), Los Angeles County Fire Department Station 42 (G), Los Angeles County Fire Department Station 4 (H). Display/hide their locations on the map
Shopping Centers: Universal Square Shopping Center (1), Garvey Square Shopping Center (2), Beaches Shopping Center (3), Rosemead Square Shopping Center (4). Display/hide their locations on the map
Churches in zip code 91770 include: Church of Jesus Christ of Latter Day Saints (A), First Baptist Church of Rosemead (B), First Evangelical Church (C), First Presbyterian Church (D), Kingdom Hall of Jehovahs Witnesses (E), Open Bible Church (F), Rosemead Christian Center (G), Rosemead Christian Church (H), Rosemead Church of the Nazarene (I). Display/hide their locations on the map
Parks in zip code 91770 include: Rod Marinelli Stadium (1), Community Center Park (2), Garvey Park (3), Jess Gonzales Sports Park (4), Klingerman Park (5), Potrero Heights Park (6), Rosemead Park (7), Sally Tanner Park (8), Zapopan Park (9). Display/hide their locations on the map
6,898 married couples with children.
1,804 single-parent households (358 men, 1,446 women).
20.0% of residents of 91770 zip code speak English at home.
23.4% of residents speak Spanish at home (67% very well, 12% well, 17% not well, 4% not at all).
0.7% of residents speak other Indo-European language at home (67% very well, 12% well, 11% not well, 9% not at all).
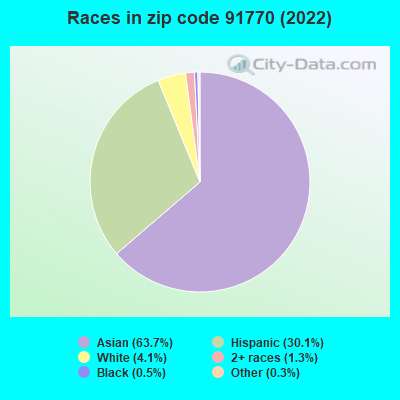
55.8% of residents speak Asian or Pacific Island language at home (30% very well, 23% well, 31% not well, 16% not at all).
0.1% of residents speak other language at home (83% very well, 17% well).
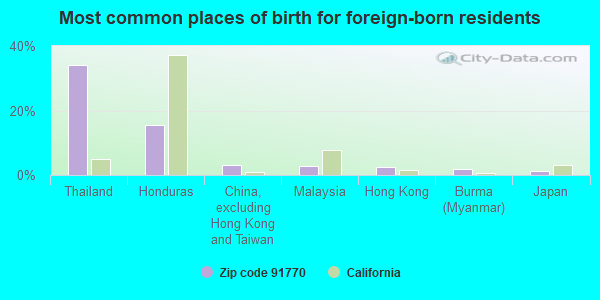
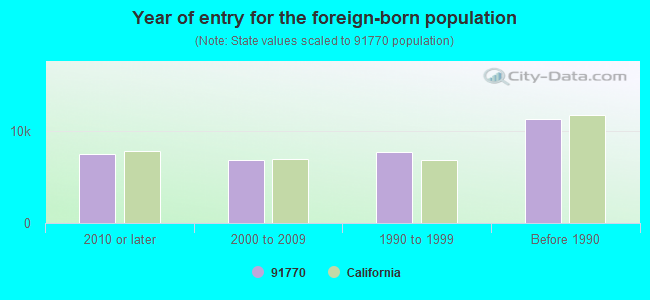
Foreign born population: 32,881 (55.8%) (65.6% of them are naturalized citizens)
Major facilities with environmental interests located in this zip code:
HERMETIC SEAL CORPORATION (4232 TEMPLE CITY BLVD. in ROSEMEAD, CA)
STATE MASTER (California - Hazardous Waste Tracking) - HAZARDOU WASTE PROGRAM COMPLIANCE ACTIVITY (Tracking inspections of insecticide, fungicide, and rodenticide, and toxic substances) CRITERIA AND HAZARDOUS AIR POLLUTANT INVENTORY (Inventory of air pollution sources) HAZARDOUS WASTE BIENNIAL REPORTER (Resource Conservation and Recovery Act (tracking hazardous waste)) Large Quantity Generators, more that 1000 kg of hazardous waste/month (Resource Conservation and Recovery Act (tracking hazardous waste)) TRI REPORTER (Tracking of toxic chemicals releasing facilities) Business SIC classification: ELECTRONIC CONNECTORS; ELECTRONIC COMPONENTS Business NAICS classification: ELECTRONIC CONNECTOR MANUFACTURING.
JIFFY LUBE #2224 (9655 VALLEY BLVD in ROSEMEAD, CA)
(Resource Conservation and Recovery Act (tracking hazardous waste)) STATE MASTER (California - Used Oil Recycling System ) - USED OIL RECYCLING Organizations: DAR MANARANG (CONTACT/OWNER)
Alternative names: MINIT LUBE 1309
CALTRANS DISTRICT 7/HELLMAN AVE. ELEC. (8555 E HELLMAN AVE in ROSEMEAD, CA) . Federal Facility
STATE MASTER (California - Hazardous Waste Tracking) - HAZARDOU WASTE PROGRAM Small Quantity Generators, between 100 kg and 1000 kg of hazardous waste/month (Resource Conservation and Recovery Act (tracking hazardous waste)) - notification Alternative names: SAN GABRIEL ELECTRI CAL
CALTRANS DISTRICT 7/ROSEMEAD MS. (9153 LOWER AZUSA RD in ROSEMEAD, CA) . Federal Facility
STATE MASTER (California - Hazardous Waste Tracking) - HAZARDOU WASTE PROGRAM Small Quantity Generators, between 100 kg and 1000 kg of hazardous waste/month (Resource Conservation and Recovery Act (tracking hazardous waste)) - notification Alternative names: ROSEMEAD MAINT STATION
HARRYS RADIATOR SHOP (9344 E VALLEY BLVD in ROSEMEAD, CA)
STATE MASTER (California - Hazardous Waste Tracking) - HAZARDOU WASTE PROGRAM Small Quantity Generators, between 100 kg and 1000 kg of hazardous waste/month (Resource Conservation and Recovery Act (tracking hazardous waste)) Business NAICS classification: OTHER AUTOMOTIVE MECHANICAL AND ELECTRICAL REPAIR AND MAINTENANCE.
EMERSON (RALPH WALDO) ELEMENTARY (7544 E. EMERSON PL. in ROSEMEAD, CA)
(National Center for Education Statistics) - STATE ID-6013593 Organizations: GARVEY ELEMENTARY (SCHOOL DISTRICT)
ENCINITA ELEMENTARY (4515 N. ENCINITA in ROSEMEAD, CA)
(National Center for Education Statistics) - STATE ID-6022172 Organizations: ROSEMEAD ELEMENTARY (SCHOOL DISTRICT)
GARVEY (RICHARD) INTERMEDIATE (2720 N. JACKSON AVE. in ROSEMEAD, CA)
(National Center for Education Statistics) - STATE ID-6013601 Organizations: GARVEY ELEMENTARY (SCHOOL DISTRICT)
JANSON (MILDRED B.) ELEMENTARY (8628 E. MARSHALL in ROSEMEAD, CA)
(National Center for Education Statistics) - STATE ID-6022180 Organizations: ROSEMEAD ELEMENTARY (SCHOOL DISTRICT)
MUSCATEL MIDDLE (420 N IVAR AVE in ROSEMEAD, CA)
(National Center for Education Statistics) - STATE ID-6022198 Organizations: ROSEMEAD ELEMENTARY (SCHOOL DISTRICT)
MARGE CARSON INCORPORATED (9056 E. GARVEY AVE. in ROSEMEAD, CA)
AIR MAJOR (AIRS/AFS) CRITERIA AND HAZARDOUS AIR POLLUTANT INVENTORY (Inventory of air pollution sources) Conditionally Exempt Small Quantity Generators, less than 100 kg/month of hazardous waste (Resource Conservation and Recovery Act (tracking hazardous waste)) HAZARDOUS WASTE BIENNIAL REPORTER (Resource Conservation and Recovery Act (tracking hazardous waste)) TRI REPORTER (Tracking of toxic chemicals releasing facilities) Business SIC classification: WOOD HOUSEHOLD FURNITURE, EXCEPT UPHOLSTERED; WOOD HOUSEHOLD FURNITURE, UPHOLSTERED Business NAICS classification: SHOWCASE, PARTITION, SHELVING, AND LOCKER MANUFACTURING.
CALIFORNIA FEDERAL ROSEMEAD FACILITY (1515 WALNUT GROVE in ROSEMEAD, CA)
Large Quantity Generators, more that 1000 kg of hazardous waste/month (Resource Conservation and Recovery Act (tracking hazardous waste)) - notification Organizations: DEBBIE GONZALES (CONTACT/OWNER)
Alternative names: CALIFORNIA FEDERAL S/L, CAL FED ROSEMEAD FACILITY
EXXON MOBIL OIL CORP (939 SAN GABRIEL BLVD in ROSEMEAD, CA)
HAZARDOUS WASTE BIENNIAL REPORTER (Resource Conservation and Recovery Act (tracking hazardous waste)) Large Quantity Generators, more that 1000 kg of hazardous waste/month (Resource Conservation and Recovery Act (tracking hazardous waste))
Housing units lacking complete plumbing facilities: 0.3% Housing units lacking complete kitchen facilities: 3.9%
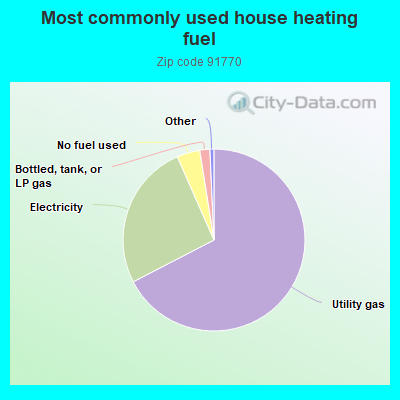
67.4%Utility gas
26.0%Electricity
4.1%No fuel used
1.8%Bottled, tank, or LP gas
Population in 1990: 59,898. Population change in the 1990s: +1,707 (+2.8%).
Place of birth for U.S.-born residents:
This state: 24,247
Northeast: 330
Midwest: 311
South: 691
West: 398
63% of the 91770 zip code residents lived in the same house 5 years ago. Out of people who lived in different houses, 92% lived in this county. Out of people who lived in different counties, 50% lived in California.
96% of the 91770 zip code residents lived in the same house 1 year ago. Out of people who lived in different houses, 83% moved from this county. Out of people who lived in different houses, 6% moved from different county within same state. Out of people who lived in different houses, 5% moved from different state. Out of people who lived in different houses, 15% moved from abroad.
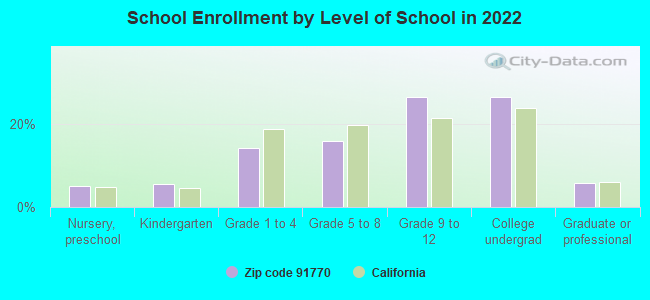
Private vs. public school enrollment:
Students in private schools in grades 1 to 8 (elementary and middle school): 288
Here:
7.4%
California:
10.5%
Students in private schools in grades 9 to 12 (high school): 58
Here:
1.7%
California:
8.5%
Students in private undergraduate colleges: 214
Here:
6.3%
California:
15.9%
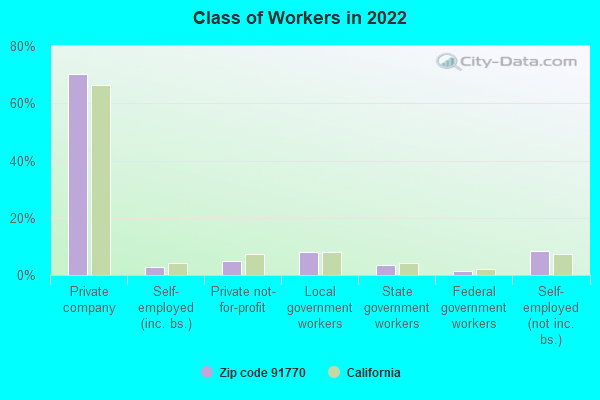
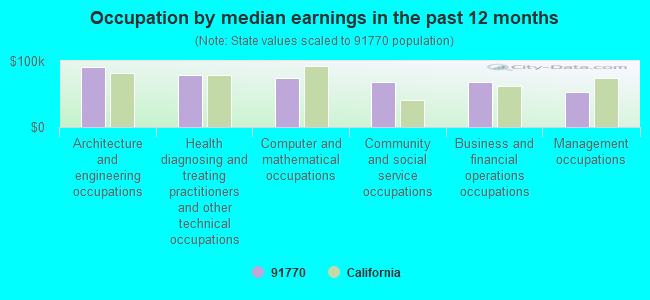
Occupation by median earnings in the past 12 months ($)
90,476Architecture and engineering occupations
78,499Health diagnosing and treating practitioners and other technical occupations
73,834Computer and mathematical occupations
67,674Community and social service occupations
67,433Business and financial operations occupations
53,595Management occupations
Companies with federal contracts located in this zip code (ROSEMEAD, CA):
FULFILL AMERICA, INC (8748 E VALLEY BL , SUITE#; small business) : $869,911 in 4 contractsfrom 2002 to 2003
$376,705 with Army for Other Defense -- Operational Systems Development (R&D). Signed on 2003-01-17. Completion date: 2005-01-15.
$353,291, same as above.Signed on 2003-11-13. Completion date: 2005-01-15.
$69,984 with Army for Other Defense -- Management and Support (R&D). Signed on 2002-01-23. Completion date: 2002-07-23.
$69,931 with Army for Textiles, Clothing and Equipage -- Advanced Development (R&D). Signed on 2002-01-31. Completion date: 2002-08-01.
HERMETIC SEAL CORPORATION (4232 TEMPLE CITY BLVD) : $207,570 in 12 contractsfrom 1999 to 2006
Contracts for Connectors, Electrical, by Defense Logistics Agency, NASA, Navy Signed by year:2000: $0; 2001: $32,078; 2002: $0; 2003: $0; 2004: $50,727; 2005: $49,739; 2006: $29,406.
Biggest contracts:
$45,620 with Defense Logistics Agency for Connectors, Electrical. Signed on 1999-12-09. Completion date: 2002-12-09.
$32,078, same as above.Signed on 2001-01-19. Completion date: 2001-06-01.
$26,049, same as above.Signed on 2004-06-14. Completion date: 2004-09-22.
$24,678, same as above.Signed on 2004-10-20. Completion date: 2005-01-29.
WICK & DENNIS INC (8464 E GARVEY AVE; small business)
$6,155 with Army for Maintenance, Repair or Alteration of Real Property -- Conference Space and Facilities. Signed on 2005-09-02. Completion date: 2005-09-22.
SOUTHERN CALIFORNIA EDISON COM (4930 EARLE AVE)
-$49,517 with Defense Logistics Agency for Telephone and/or Communications Services (includes Telegraph, Telex, and Cablevision Services). Signed on 2000-02-17. Completion date: 2000-09-30.
Top industries in this zip code by the number of employees in 2005:
Utilities: Electric Power Distribution (over 1000 employees: 1 establishment, 500-999 employees: 2 establishments, 100-249 employees: 1 establishment, 10-19 employees: 1 establishment, 1-4 employees: 5 establishments)
Finance and Insurance: Real Estate Credit (250-499: 2, 100-249: 4, 50-99: 1, 20-49: 1, 10-19: 1, 5-9: 1)
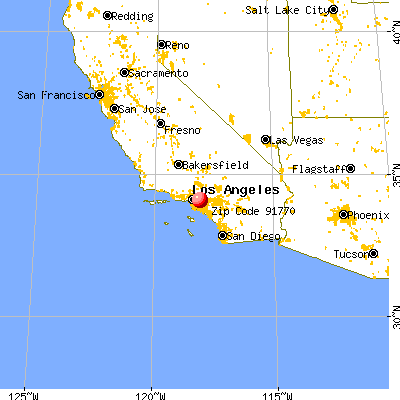


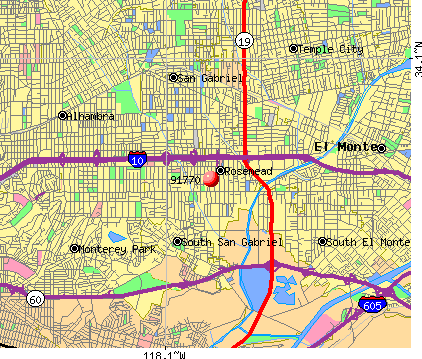 Nearest zip codes: 91776, 91755, 91733, 91731, 91780, 91775.