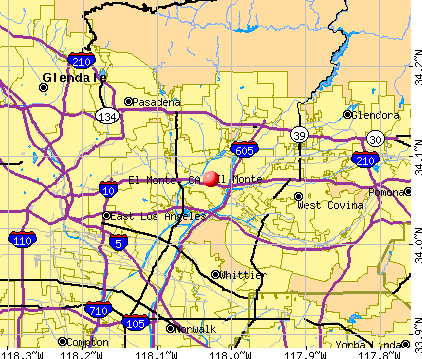
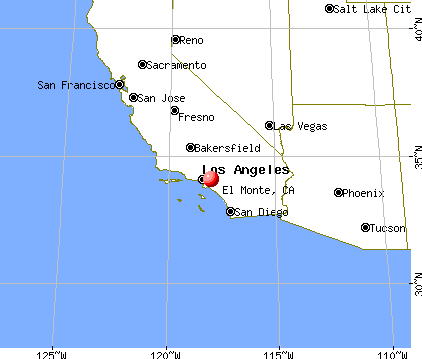
El Monte, California
Submit your own pictures of this city and show them to the world
- OSM Map
- General Map
- Google Map
- MSN Map
Population change since 2000: -9.2%
 |
| Males: 52,414 | |
| Females: 52,898 |
| Median resident age: | 36.9 years |
| California median age: | 37.9 years |
Zip codes: 91731, 91733, 91770.
El Monte Zip Code Map| El Monte: | $59,368 |
| CA: | $91,551 |
Estimated per capita income in 2022: $23,371 (it was $10,316 in 2000)
El Monte city income, earnings, and wages data
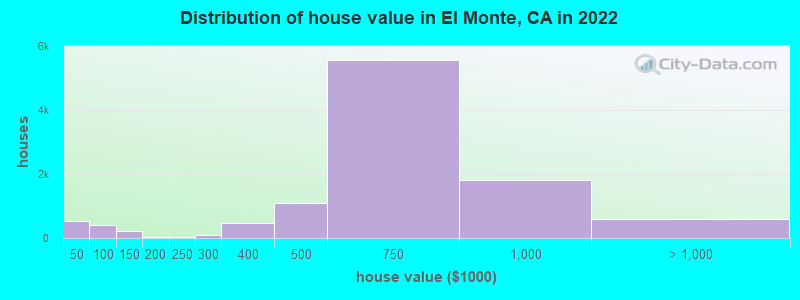
Estimated median house or condo value in 2022: $633,400 (it was $153,100 in 2000)
| El Monte: | $633,400 |
| CA: | $715,900 |
Mean prices in 2022: all housing units: $788,095; detached houses: $898,573; townhouses or other attached units: $619,394; in 5-or-more-unit structures: $744,208; mobile homes: $81,161
Median gross rent in 2022: $1,613.
(13.8% for White Non-Hispanic residents, 74.0% for Black residents, 16.5% for Hispanic or Latino residents, 34.5% for American Indian residents, 6.0% for Native Hawaiian and other Pacific Islander residents, 12.2% for other race residents, 15.3% for two or more races residents)
Detailed information about poverty and poor residents in El Monte, CA


Compare current foreclosures in El Monte, CA:
| Photo | Address | Area | Beds / Baths | Price | Details |
|---|---|---|---|---|---|

|
#1
Bryant Rd
El Monte, CA 91731
|
1,080 sq. feet
|
1 baths 2 beds |
show details | |

|
#2
Lansdale Ave
El Monte, CA 91732
|
1,866 sq. feet
|
3 baths 6 beds |
show details | |

|
#3
Maxson Rd
El Monte, CA 91732
|
2,310 sq. feet
|
2 baths 4 beds |
show details | |

|
#4
Mcgirk Ave
El Monte, CA 91732
|
2,325 sq. feet
|
3 baths 5 beds |
show details | |

|
#5
Tamarack St
El Monte, CA 91732
|
1,408 sq. feet
|
3 baths 3 beds |
show details | |

|
#6
Elmcrest St
El Monte, CA 91731
|
1,192 sq. feet
|
2 baths 3 beds |
show details | |

|
#7
Whitney Dr
El Monte, CA 91731
|
1,392 sq. feet
|
2 baths 4 beds |
show details | |

|
#8
Lexington Ave
El Monte, CA 91731
|
978 sq. feet
|
1 baths 2 beds |
show details | |

|
#9
Ranchito St
El Monte, CA 91732
|
2,114 sq. feet
|
3 baths 4 beds |
show details | |

|
#10
Pineville St
El Monte, CA 91732
|
1,330 sq. feet
|
2 baths 4 beds |
show details |
| Photo | Address | Area | Beds / Baths | Price | Details |
|---|---|---|---|---|---|

|
#11
Rio Hondo Pkwy
El Monte, CA 91732
|
664 sq. feet
|
2 baths 3 beds |
show details | |

|
#12
Killian St
El Monte, CA 91732
|
1,032 sq. feet
|
1 baths 2 beds |
show details | |

|
#13
Bryant Rd
El Monte, CA 91731
|
1,080 sq. feet
|
1 baths 2 beds |
show details | |

|
#14
Meadowlark St
El Monte, CA 91732
|
1,408 sq. feet
|
3 baths 3 beds |
show details | |

|
#15
Olney St
El Monte, CA 91731
|
732 sq. feet
|
1 baths 2 beds |
show details | |

|
#16
Lower Azusa Rd Apt 4
El Monte, CA 91731
|
- sq. feet
|
- baths - beds |
show details | |

|
#17
Daybreak St
El Monte, CA 91732
|
- sq. feet
|
- baths - beds |
show details | |

|
#18
La Madera Ave Apt 9
El Monte, CA 91732
|
- sq. feet
|
- baths - beds |
show details | |

|
#19
Elliott Ave Spc 158
El Monte, CA 91732
|
- sq. feet
|
- baths - beds |
show details | |

|
#20
1/2 Durfee Ave
El Monte, CA 91732
|
- sq. feet
|
- baths - beds |
show details |
| Photo | Address | Area | Beds / Baths | Price | Details |
|---|---|---|---|---|---|

|
#21
Lansdale Ave Apt 1
El Monte, CA 91732
|
- sq. feet
|
- baths - beds |
show details | |

|
#22
Ranchito St
El Monte, CA 91732
|
- sq. feet
|
- baths - beds |
show details | |

|
#23
Meeker Ave Apt 2
El Monte, CA 91731
|
- sq. feet
|
- baths - beds |
show details | |

|
#24
Maxson Rd
El Monte, CA 91732
|
- sq. feet
|
- baths - beds |
show details | |

|
#25
1/2 Eunice Ave
El Monte, CA 91731
|
- sq. feet
|
- baths - beds |
show details | |

|
#26
Magnolia St Spc 14
El Monte, CA 91732
|
- sq. feet
|
- baths - beds |
show details | |

|
#27
Eunice Ave
El Monte, CA 91731
|
- sq. feet
|
- baths - beds |
show details | |

|
#28
Maxson Rd Apt D
El Monte, CA 91732
|
- sq. feet
|
- baths - beds |
show details | |

|
#29
Montecito Dr
El Monte, CA 91731
|
- sq. feet
|
- baths - beds |
show details | |

|
#30
Lower Azusa Rd Unit C
El Monte, CA 91732
|
- sq. feet
|
- baths - beds |
show details |
| Photo | Address | Area | Beds / Baths | Price | Details |
|---|---|---|---|---|---|

|
#31
Gilman Rd Apt 20
El Monte, CA 91732
|
- sq. feet
|
- baths - beds |
show details | |

|
#32
Santa Fe Dr, Unit 330
El Monte, CA 91731
|
- sq. feet
|
- baths - beds |
show details | |

|
#33
Basye St
El Monte, CA 91731
|
- sq. feet
|
- baths - beds |
show details | |

|
#34
Elliott Ave Spc 425
El Monte, CA 91732
|
- sq. feet
|
- baths - beds |
show details | |

|
#35
Lower Azusa Rd
El Monte, CA 91732
|
- sq. feet
|
- baths - beds |
show details | |

|
#36
Maxson Rd Apt G
El Monte, CA 91732
|
- sq. feet
|
- baths - beds |
show details | |

|
#37
Gibson Rd Apt G
El Monte, CA 91731
|
- sq. feet
|
- baths - beds |
show details | |

|
Check over 1 million property listings on Foreclosure.com!
|
browse all offers | |||


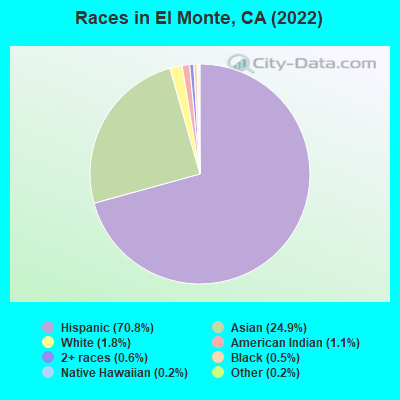
- 74,51270.8%Hispanic
- 26,22524.9%Asian alone
- 1,8861.8%White alone
- 1,1901.1%American Indian alone
- 6330.6%Two or more races
- 5310.5%Black alone
- 1700.2%Native Hawaiian and Other
Pacific Islander alone - 1600.2%Other race alone
According to our research of California and other state lists, there were 183 registered sex offenders living in El Monte, California as of April 27, 2024.
The ratio of all residents to sex offenders in El Monte is 637 to 1.
The ratio of registered sex offenders to all residents in this city is near the state average.
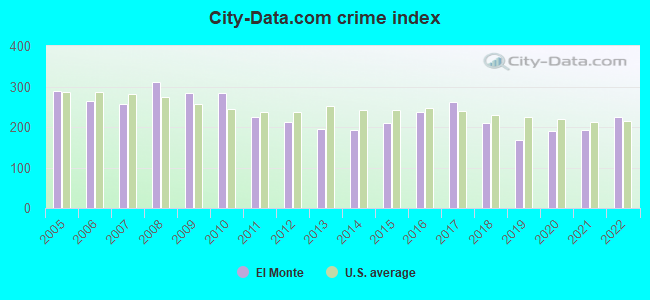
The City-Data.com crime index weighs serious crimes and violent crimes more heavily. Higher means more crime, U.S. average is 246.1. It adjusts for the number of visitors and daily workers commuting into cities.
- means the value is smaller than the state average.- means the value is about the same as the state average.
- means the value is bigger than the state average.
- means the value is much bigger than the state average.
Crime rate in El Monte detailed stats: murders, rapes, robberies, assaults, burglaries, thefts, arson
Full-time law enforcement employees in 2021, including police officers: 152 (116 officers - 104 male; 12 female).
| Officers per 1,000 residents here: | 1.03 |
| California average: | 2.30 |
 Recent articles from our blog. Our writers, many of them Ph.D. graduates or candidates, create easy-to-read articles on a wide variety of topics.

 | A life of perfect weather nearly everyday of the year (138 replies) |
| So, where do all the white people live then? (230 replies) |
| Public transportation in California... (55 replies) |
| Loud Noise in El Monte Area - What is it? (6 replies) |
| Why so many covid 19 cases and deaths in LA County (1268 replies) |
| Bay Area Cities that are rapidly ageing (39 replies) |
Latest news from El Monte, CA collected exclusively by city-data.com from local newspapers, TV, and radio stations
Current Local Time: PST time zone
Elevation: 283 feet
Land area: 9.55 square miles.
Population density: 11,024 people per square mile (high).
52,008 residents are foreign born (26.8% Latin America, 21.9% Asia).
| This city: | 48.9% |
| California: | 26.5% |
Median real estate property taxes paid for housing units with mortgages in 2022: $5,751 (0.9%)
Median real estate property taxes paid for housing units with no mortgage in 2022: $3,272 (0.6%)
Nearest city with pop. 200,000+: Upper San Gabriel Valley, CA (2.5 miles  , pop. 320,969).
Nearest city with pop. 1,000,000+: Los Angeles, CA (20.0 miles , pop. 3,694,820).
Nearest cities:
), ), Latitude: 34.07 N, Longitude: 118.03 W
Daytime population change due to commuting: -13,162 (-12.5%)
Workers who live and work in this city: 7,527 (15.9%)
Area code: 626
Property values in El Monte, CA
El Monte, California accommodation & food services, waste management - Economy and Business Data
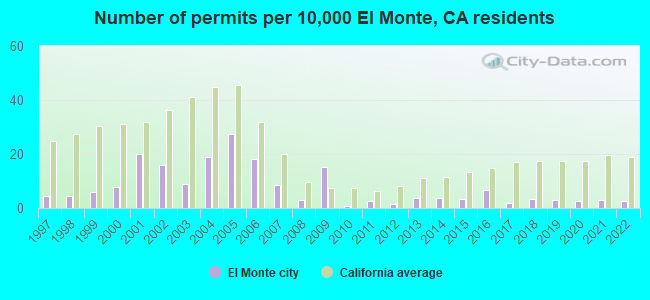
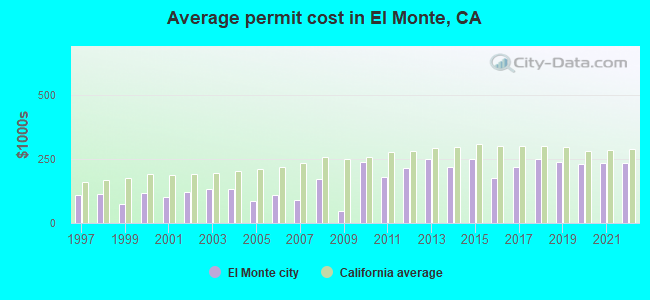
Single-family new house construction building permits:
- 2022: 29 buildings, average cost: $233,700
- 2021: 36 buildings, average cost: $234,400
- 2020: 31 buildings, average cost: $232,300
- 2019: 35 buildings, average cost: $238,700
- 2018: 39 buildings, average cost: $248,700
- 2017: 23 buildings, average cost: $218,500
- 2016: 76 buildings, average cost: $177,000
- 2015: 39 buildings, average cost: $248,800
- 2014: 43 buildings, average cost: $218,500
- 2013: 42 buildings, average cost: $250,000
- 2012: 19 buildings, average cost: $213,900
- 2011: 32 buildings, average cost: $180,200
- 2010: 9 buildings, average cost: $236,800
- 2009: 178 buildings, average cost: $47,100
- 2008: 33 buildings, average cost: $172,500
- 2007: 99 buildings, average cost: $90,100
- 2006: 211 buildings, average cost: $107,700
- 2005: 317 buildings, average cost: $87,500
- 2004: 221 buildings, average cost: $133,500
- 2003: 105 buildings, average cost: $133,200
- 2002: 186 buildings, average cost: $123,000
- 2001: 232 buildings, average cost: $101,100
- 2000: 92 buildings, average cost: $118,200
- 1999: 69 buildings, average cost: $73,300
- 1998: 50 buildings, average cost: $112,300
- 1997: 50 buildings, average cost: $109,200
| Here: | 4.8% |
| California: | 5.1% |
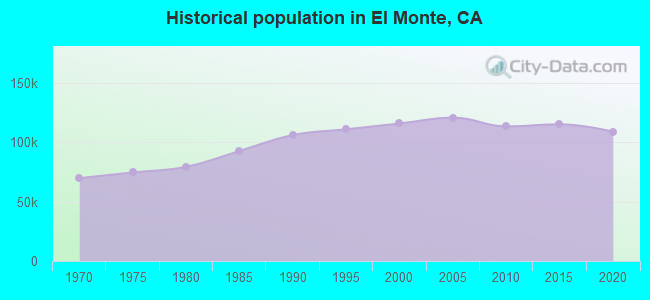
Population change in the 1990s: +9,663 (+9.1%).
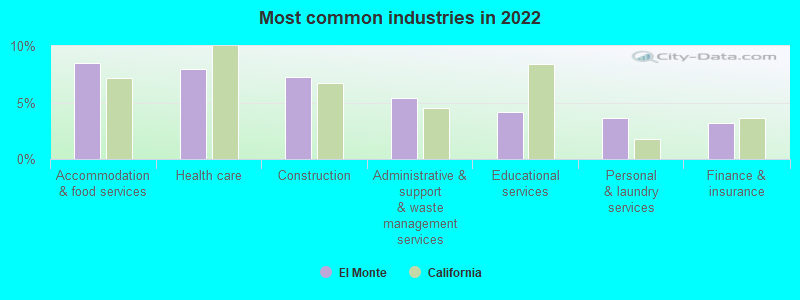
- Accommodation & food services (8.5%)
- Health care (8.0%)
- Construction (7.3%)
- Administrative & support & waste management services (5.4%)
- Educational services (4.2%)
- Personal & laundry services (3.6%)
- Finance & insurance (3.2%)
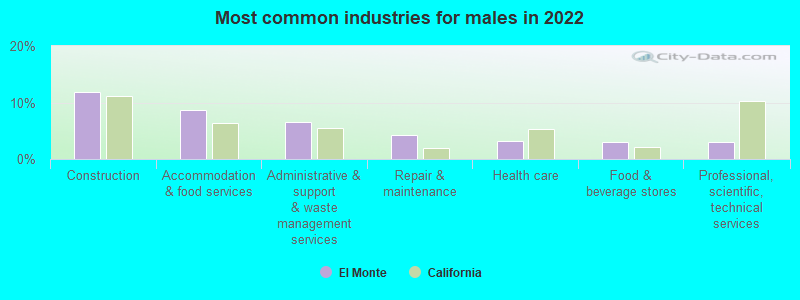
- Construction (11.9%)
- Accommodation & food services (8.7%)
- Administrative & support & waste management services (6.6%)
- Repair & maintenance (4.2%)
- Health care (3.2%)
- Food & beverage stores (3.0%)
- Professional, scientific, technical services (2.9%)
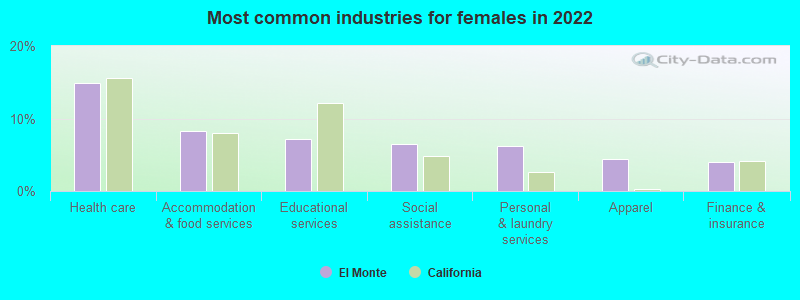
- Health care (14.9%)
- Accommodation & food services (8.2%)
- Educational services (7.1%)
- Social assistance (6.4%)
- Personal & laundry services (6.3%)
- Apparel (4.4%)
- Finance & insurance (4.0%)
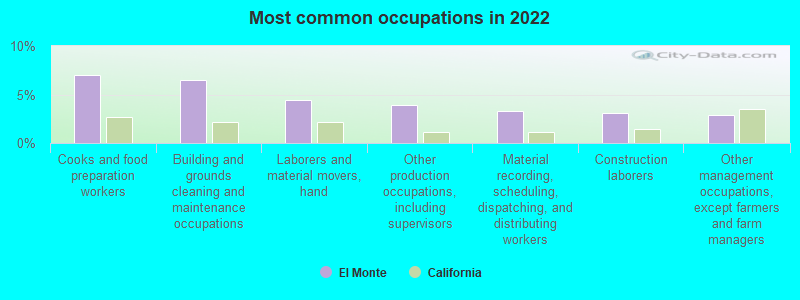
- Cooks and food preparation workers (7.0%)
- Building and grounds cleaning and maintenance occupations (6.5%)
- Laborers and material movers, hand (4.4%)
- Other production occupations, including supervisors (3.9%)
- Material recording, scheduling, dispatching, and distributing workers (3.3%)
- Construction laborers (3.1%)
- Other management occupations, except farmers and farm managers (2.9%)
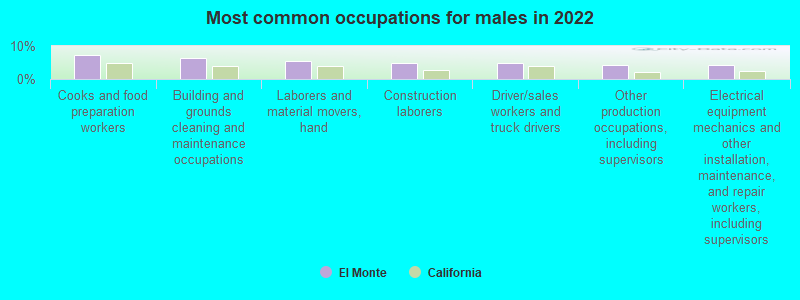
- Cooks and food preparation workers (7.4%)
- Building and grounds cleaning and maintenance occupations (6.3%)
- Laborers and material movers, hand (5.4%)
- Construction laborers (5.0%)
- Driver/sales workers and truck drivers (4.8%)
- Other production occupations, including supervisors (4.4%)
- Electrical equipment mechanics and other installation, maintenance, and repair workers, including supervisors (4.3%)
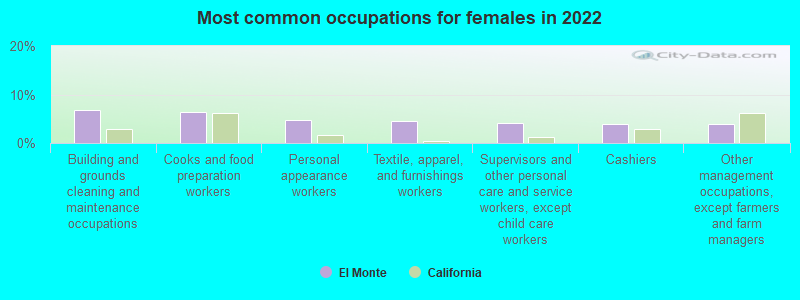
- Building and grounds cleaning and maintenance occupations (6.9%)
- Cooks and food preparation workers (6.5%)
- Personal appearance workers (4.7%)
- Textile, apparel, and furnishings workers (4.5%)
- Supervisors and other personal care and service workers, except child care workers (4.2%)
- Cashiers (3.9%)
- Other management occupations, except farmers and farm managers (3.8%)
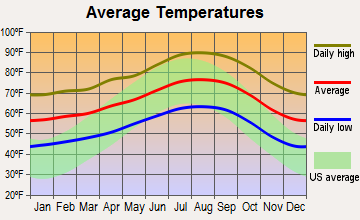
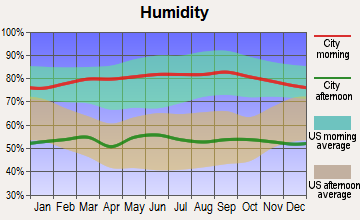
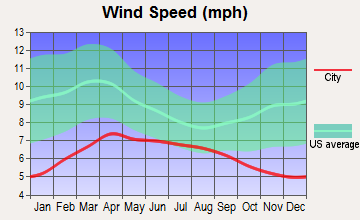
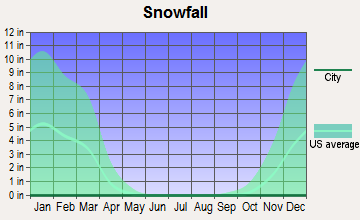
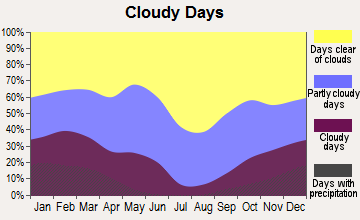
Average climate in El Monte, California
Based on data reported by over 4,000 weather stations


|
|

(lower is better)
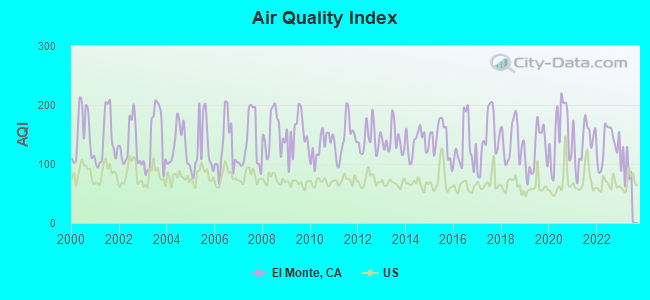
Air Quality Index (AQI) level in 2022 was 133. This is significantly worse than average.
| City: | 133 |
| U.S.: | 73 |
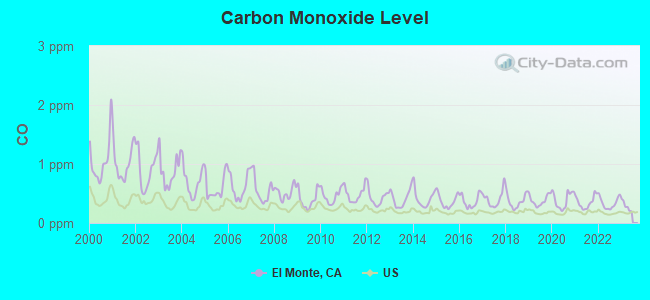
Carbon Monoxide (CO) [ppm] level in 2022 was 0.337. This is worse than average. Closest monitor was 3.3 miles away from the city center.
| City: | 0.337 |
| U.S.: | 0.251 |
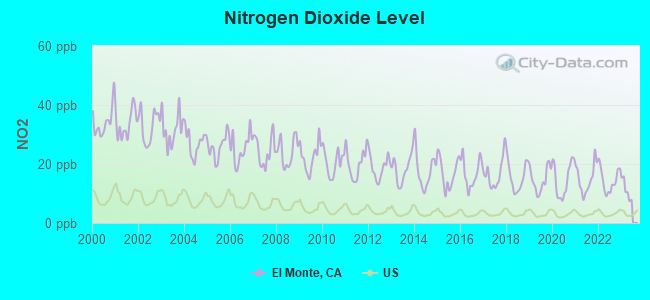
Nitrogen Dioxide (NO2) [ppb] level in 2022 was 14.5. This is significantly worse than average. Closest monitor was 0.8 miles away from the city center.
| City: | 14.5 |
| U.S.: | 5.1 |
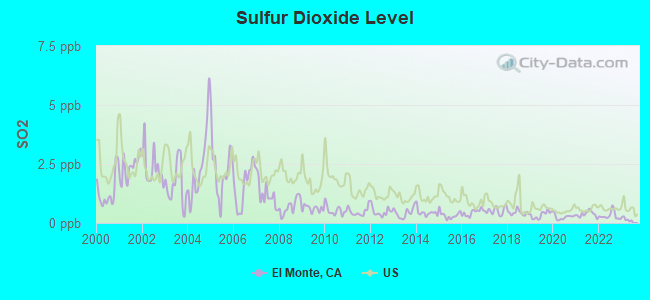
Sulfur Dioxide (SO2) [ppb] level in 2022 was 0.311. This is significantly better than average. Closest monitor was 0.8 miles away from the city center.
| City: | 0.311 |
| U.S.: | 1.515 |
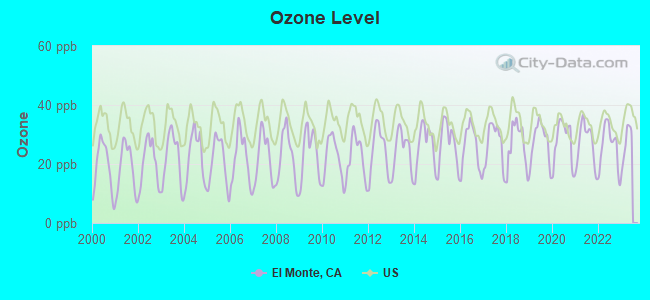
Ozone [ppb] level in 2022 was 26.0. This is better than average. Closest monitor was 0.8 miles away from the city center.
| City: | 26.0 |
| U.S.: | 33.3 |
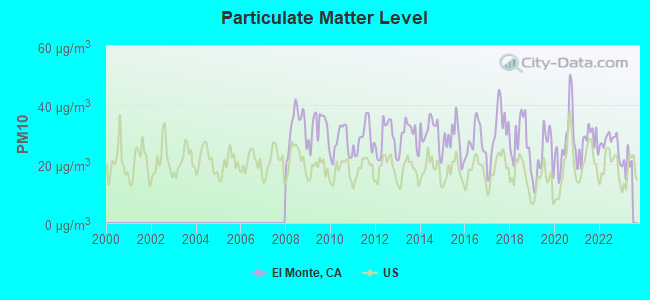
Particulate Matter (PM10) [µg/m3] level in 2022 was 27.3. This is significantly worse than average. Closest monitor was 7.4 miles away from the city center.
| City: | 27.3 |
| U.S.: | 19.2 |
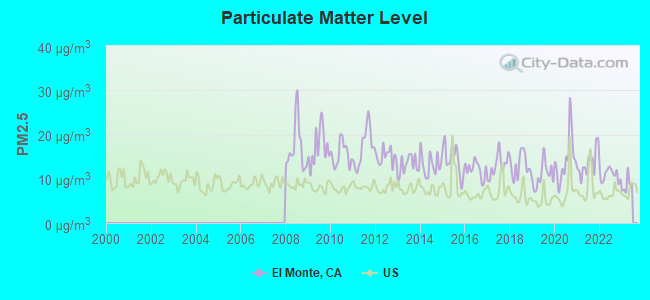
Particulate Matter (PM2.5) [µg/m3] level in 2022 was 10.9. This is worse than average. Closest monitor was 4.5 miles away from the city center.
| City: | 10.9 |
| U.S.: | 8.1 |
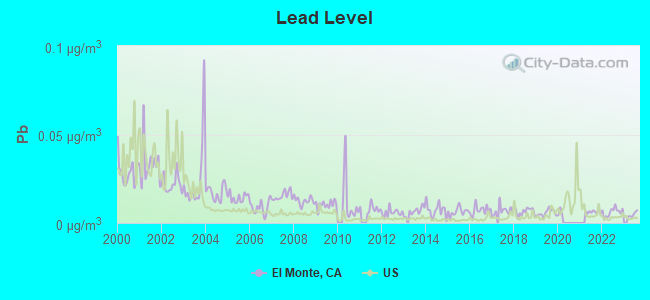
Lead (Pb) [µg/m3] level in 2022 was 0.00620. This is significantly better than average. Closest monitor was 2.3 miles away from the city center.
| City: | 0.00620 |
| U.S.: | 0.00931 |
Earthquake activity:
El Monte-area historical earthquake activity is significantly above California state average. It is 7130% greater than the overall U.S. average.On 7/21/1952 at 11:52:14, a magnitude 7.7 (7.7 UK, Class: Major, Intensity: VIII - XII) earthquake occurred 84.7 miles away from El Monte center, causing $50,000,000 total damage
On 6/28/1992 at 11:57:34, a magnitude 7.6 (6.2 MB, 7.6 MS, 7.3 MW, Depth: 0.7 mi) earthquake occurred 86.0 miles away from El Monte center, causing 3 deaths (1 shaking deaths, 2 other deaths) and 400 injuries, causing $100,000,000 total damage and $40,000,000 insured losses
On 10/16/1999 at 09:46:44, a magnitude 7.4 (6.3 MB, 7.4 MS, 7.2 MW, 7.3 ML) earthquake occurred 96.0 miles away from the city center
On 11/4/1927 at 13:51:53, a magnitude 7.5 (7.5 UK) earthquake occurred 180.8 miles away from El Monte center
On 1/17/1994 at 12:30:55, a magnitude 6.8 (6.4 MB, 6.8 MS, 6.7 MW, Depth: 11.4 mi, Class: Strong, Intensity: VII - IX) earthquake occurred 31.9 miles away from the city center, causing 60 deaths (60 shaking deaths) and 7000 injuries
On 4/21/1918 at 22:32:30, a magnitude 6.8 (6.8 UK) earthquake occurred 38.2 miles away from the city center
Magnitude types: body-wave magnitude (MB), local magnitude (ML), surface-wave magnitude (MS), moment magnitude (MW)
Natural disasters:
The number of natural disasters in Los Angeles County (57) is a lot greater than the US average (15).Major Disasters (Presidential) Declared: 27
Emergencies Declared: 3
Causes of natural disasters: Fires: 37, Floods: 16, Storms: 9, Winter Storms: 6, Landslides: 5, Mudslides: 5, Earthquakes: 3, Freeze: 1, Heavy Rain: 1, Hurricane: 1, Snow: 1, Tornado: 1, Wind: 1, Other: 1 (Note: some incidents may be assigned to more than one category).

Hospitals in El Monte:
Nursing Homes in El Monte:
- ALLIANCE CHERRYLEE CENTER (5053 NORTH PECK RD.)
- ALLIANCE EL MONTE CARE CENTER (5043 N. PECK RD)
- ALLIANCE NURSING AND REHAB CTR (3825 N DURFEE AVE)
- EL MONTE CONVALESCENT HOSPITAL (4096 EASY STREET)
- ELMCREST CARE CENTER (3111 SANTA ANITA AVE)
- FIDELITY HEALTH CARE (11210 LOWER AZUSA RD.)
- IDLE ACRE CONVALESCENT (5044 BUFFINGTON RD.)
- PENN MAR THERAPEUTIC CENTER (3938 COGSWELL ROAD)
- RAMONA NURSING AND REHABILITATION CENTER (11900 RAMONA BOULEVARD)
- SUNSET MANOR CONV HOSP (2720 NEVADA AVENUE)
Dialysis Facilities in El Monte:
Home Health Centers in El Monte:
Airports and heliports located in El Monte:
- El Monte Airport (EMT) (Runways: 1, Air Taxi Ops: 734, Itinerant Ops: 37,124, Local Ops: 51,421, Military Ops: 28)
- Wells Fargo-El Monte Heliport (CL27)
Amtrak stations near El Monte:
- 9 miles: PASADENA (150 S. ROBLES AVE.) - Bus Station . Services: fully wheelchair accessible, enclosed waiting area, public restrooms, public payphones, full-service food facilities, paid short-term parking, paid long-term parking, taxi stand, public transit connection.
- 13 miles: LOS ANGELES (800 N. ALAMEDA ST.) . Services: ticket office, fully wheelchair accessible, enclosed waiting area, public restrooms, public payphones, snack bar, free short-term parking, paid long-term parking, car rental agency, taxi stand, public transit connection.
- 14 miles: GLENDALE (400 W. CERRITOS AVE.) . Services: fully wheelchair accessible, public payphones, free short-term parking, free long-term parking, call for taxi service, intercity bus service, public transit connection.
Colleges/Universities in El Monte:
- Diamond Beauty College (Full-time enrollment: 140; Location: 10301 Garvey Avenue #200; Private, for-profit; Website: www.diamondbeauty.edu)
- Professional Institute of Beauty (Full-time enrollment: 126; Location: 10801 E. Valley Mall; Private, for-profit; Website: www.pib.edu)
- Palladium Technical Academy (Full-time enrollment: 99; Location: 10503 Valley Blvd; Private, for-profit; Website: palladiumta.com)
Colleges/universities with over 2000 students nearest to El Monte:
- Rio Hondo College (about 4 miles; Whittier, CA; Full-time enrollment: 9,610)
- Hacienda La Puente Adult Education (about 6 miles; La Puente, CA; FT enrollment: 2,750)
- Pasadena City College (about 8 miles; Pasadena, CA; FT enrollment: 14,712)
- California Institute of Technology (about 8 miles; Pasadena, CA; FT enrollment: 2,246)
- East Los Angeles College (about 8 miles; Monterey Park, CA; FT enrollment: 17,297)
- California State University-Los Angeles (about 9 miles; Los Angeles, CA; FT enrollment: 17,545)
- Le Cordon Bleu College of Culinary Arts-Pasadena (about 9 miles; Pasadena, CA; FT enrollment: 2,934)
Public high schools in El Monte:
- ARROYO HIGH (Students: 1,573, Location: 4921 N. CEDAR AVE., Grades: 9-12)
- EL MONTE HIGH (Students: 1,379, Location: 3048 N. TYLER AVE., Grades: 9-12)
- MOUNTAIN VIEW HIGH (Students: 1,368, Location: 2900 PKWY. DR., Grades: 9-12)
- FERNANDO R. LEDESMA CONTINUATION HIGH (Students: 82, Location: 12347 RAMONA BLVD., Grades: 10-12)
- EL MONTE UNION HIGH SCHOOL COMMUNITY DAY (Students: 11, Location: 5050 KINGS ROW, Grades: 9-12)
Biggest public elementary/middle schools in El Monte:
- ALFRED S. MADRID MIDDLE (Students: 1,030, Location: 3300 GILMAN RD., Grades: 6-8)
- CHARLES T. KRANZ INTERMEDIATE (Students: 1,016, Location: 12460 FINEVIEW ST., Grades: 7-8)
- POTRERO ELEMENTARY (Students: 770, Location: 2611 N. POTRERO AVE., Grades: KG-8)
- WRIGHT ELEMENTARY (Students: 702, Location: 11317 E. MCGIRK RD., Grades: KG-8)
- DURFEE ELEMENTARY (Students: 686, Location: 12233 STAR ST., Grades: KG-8)
- GIDLEY ELEMENTARY (Students: 539, Location: 10226 E. LOWER AZUSA RD., Grades: KG-8)
- MAXSON ELEMENTARY (Students: 531, Location: 12380 FELIPE ST., Grades: KG-6)
- BAKER ELEMENTARY (Students: 513, Location: 12043 EXLINE ST., Grades: KG-5)
- MONTE VISTA ELEMENTARY (Students: 399, Location: 11111 THIENES AVE., Grades: KG-8)
- TWIN LAKES ELEMENTARY (Students: 398, Location: 3900 GILMAN RD., Grades: KG-6)
Private elementary/middle schools in El Monte:
User-submitted facts and corrections:
- El Monte Vietnamese Seventh-day Adventist Church 11601 East Bryant Road, El Monte, CA 91732 626 454-1304
- The list of El Monte Churches also include Truth Chinese Alliance Church at 4047 N. Durfee Ave. El Monte, California 91732 added by Dizzy
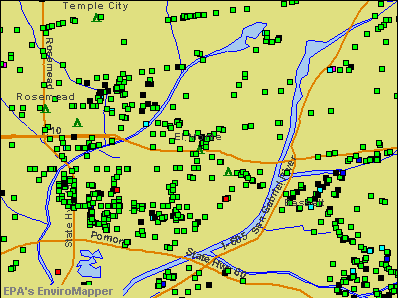
Points of interest:
Notable locations in El Monte: Norwood Branch County of Los Angeles Public Library (A), El Monte Branch County of Los Angeles Public Library (B), MacLaren Hall (C), Los Angeles County Fire Department Station 169 (D), Los Angeles County Fire Department Station 168 (E), Los Angeles County Fire Department Station 167 (F), Los Angeles County Fire Department Station 166 (G). Display/hide their locations on the map
Shopping Centers: El Monte Shopping Center (1), Five Points Plaza Shopping Center (2). Display/hide their locations on the map
Churches in El Monte include: Assembly Pentecostal Church (A), Calvary Assembly of God Church (B), Calvary Southern Baptist Church (C), Community Presbyterian Church (D), Divine Light Presbyterian Church (E), Estudiando Las Escrituras (F), Evangelical Methodist Church (G), Iglesia Bautista De Jesus (H), Kingdom Hall of Jehovahs Witnesses (I). Display/hide their locations on the map
Streams, rivers, and creeks: Eaton Wash (A), Arcadia Wash (B). Display/hide their locations on the map
Parks in El Monte include: Lambert Park (1), Mountain View Park (2), Arceo Park (3), Fletcher Park (4), Pioneer Park (5), Zamora Park (6). Display/hide their locations on the map
Hotels: Ale's Bridal Shop (11837 Valley Boulevard), Budget Inn (10038 Valley Boulevard).
Birthplace of: Scatman John - Dance musician, Glenn Corbett - Film actor, Red Embree - Major League Baseball pitcher, Tom Morgan (baseball) - Baseball player and coach, Virginia Gilmore - Film actor, Felipe Rodriguez (soccer) - Soccer player, Mary Ford - (1928-1977), singer, Rob Bottin - Make-up artist, Roger Hernandez - Politician.
Drinking water stations with addresses in El Monte and their reported violations in the past:
CHAMPION WATER MUTUAL (Population served: 250, Groundwater):Past monitoring violations:
- Initial Tap Sampling for Pb and Cu - In JUL-01-1993, Contaminant: Lead and Copper Rule
| This city: | 4.0 people |
| California: | 2.9 people |
| This city: | 83.9% |
| Whole state: | 68.7% |
| This city: | 8.0% |
| Whole state: | 7.2% |
Likely homosexual households (counted as self-reported same-sex unmarried-partner households)
- Lesbian couples: 0.3% of all households
- Gay men: 0.2% of all households
People in group quarters in El Monte in 2010:
- 618 people in nursing facilities/skilled-nursing facilities
- 119 people in residential treatment centers for adults
- 62 people in other noninstitutional facilities
- 59 people in correctional residential facilities
- 54 people in emergency and transitional shelters (with sleeping facilities) for people experiencing homelessness
- 51 people in workers' group living quarters and job corps centers
- 50 people in residential treatment centers for juveniles (non-correctional)
- 36 people in group homes for juveniles (non-correctional)
- 31 people in group homes intended for adults
People in group quarters in El Monte in 2000:
- 572 people in nursing homes
- 322 people in other noninstitutional group quarters
- 81 people in homes for the mentally retarded
- 74 people in homes for the mentally ill
- 71 people in other group homes
- 56 people in homes or halfway houses for drug/alcohol abuse
- 37 people in other nonhousehold living situations
- 36 people in schools, hospitals, or wards for the intellectually disabled
- 15 people in hospitals or wards for drug/alcohol abuse
- 6 people in religious group quarters
Banks with branches in El Monte (2011 data):
- Wells Fargo Bank, National Association: Loan Production Branch, El Monte Branch, Flair Industrial Business Center. Info updated 2011/04/05: Bank assets: $1,161,490.0 mil, Deposits: $905,653.0 mil, headquarters in Sioux Falls, SD, positive income, 6395 total offices, Holding Company: Wells Fargo & Company
- Bank of America, National Association: Midway Center Branch at 10426 Lower Azusa Road, branch established on 1956/01/20; El Monte Branch at 11138 Valley Mall, branch established on 1936/10/19. Info updated 2009/11/18: Bank assets: $1,451,969.3 mil, Deposits: $1,077,176.8 mil, headquarters in Charlotte, NC, positive income, 5782 total offices, Holding Company: Bank Of America Corporation
- East West Bank: El Monte Branch at 9550 Flair Drive, branch established on 1996/04/25; N. El Monte Branch at 3920 North Peck Road, branch established on 1972/12/08. Info updated 2010/06/14: Bank assets: $21,962.4 mil, Deposits: $17,501.8 mil, headquarters in Pasadena, CA, positive income, Commercial Lending Specialization, 131 total offices, Holding Company: East West Bancorp, Inc.
- JPMorgan Chase Bank, National Association: Lower Azusa & Santa Anita Banking Ce at 4749 Santa Anita Avenue, branch established on 2011/11/08; 11001 East Valley Mall Branch at 11001 East Valley Mall, branch established on 1965/05/05. Info updated 2011/11/10: Bank assets: $1,811,678.0 mil, Deposits: $1,190,738.0 mil, headquarters in Columbus, OH, positive income, International Specialization, 5577 total offices, Holding Company: Jpmorgan Chase & Co.
- Citibank, National Association: Valley Mall Branch at 11141 Valley Mall Boulevard, branch established on 1934/10/01. Info updated 2012/01/10: Bank assets: $1,288,658.0 mil, Deposits: $882,541.0 mil, headquarters in Sioux Falls, SD, positive income, International Specialization, 1048 total offices, Holding Company: Citigroup Inc.
- Union Bank, National Association: El Monte Branch at 3520 Peck Rd, branch established on 2010/12/06. Info updated 2011/09/01: Bank assets: $88,967.5 mil, Deposits: $65,286.4 mil, headquarters in San Francisco, CA, positive income, Commercial Lending Specialization, 403 total offices, Holding Company: Mitsubishi Ufj Financial Group, Inc.
- Cathay Bank: El Monte Office at 9650 Flair Drive, branch established on 1980/03/18. Info updated 2010/12/08: Bank assets: $10,628.9 mil, Deposits: $7,249.8 mil, headquarters in Los Angeles, CA, positive income, Commercial Lending Specialization, 52 total offices, Holding Company: Cathay General Bancorp
- Banco Popular North America: El Monte Branch at 11840 East Valley Boulevard, branch established on 1997/12/29. Info updated 2012/01/27: Bank assets: $8,605.3 mil, Deposits: $6,167.7 mil, headquarters in New York, NY, positive income, Commercial Lending Specialization, 97 total offices, Holding Company: Popular, Inc.
For population 15 years and over in El Monte:
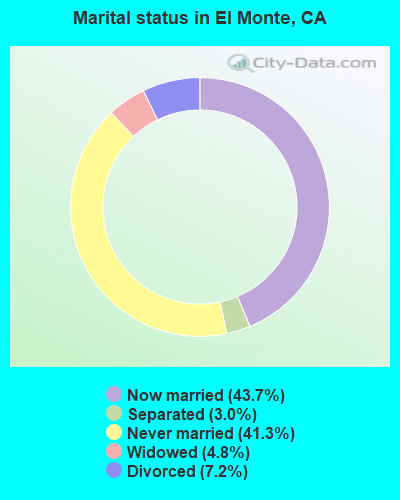
- Never married: 41.3%
- Now married: 43.7%
- Separated: 3.0%
- Widowed: 4.8%
- Divorced: 7.2%
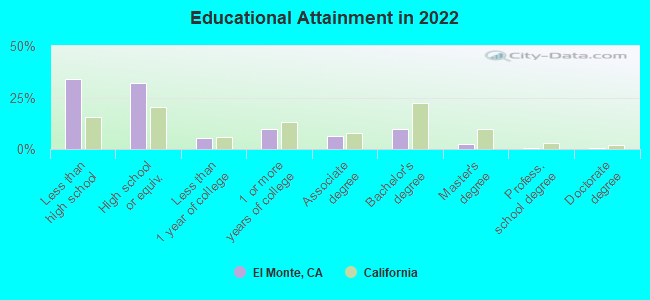
For population 25 years and over in El Monte:
- High school or higher: 66.2%
- Bachelor's degree or higher: 13.2%
- Graduate or professional degree: 3.3%
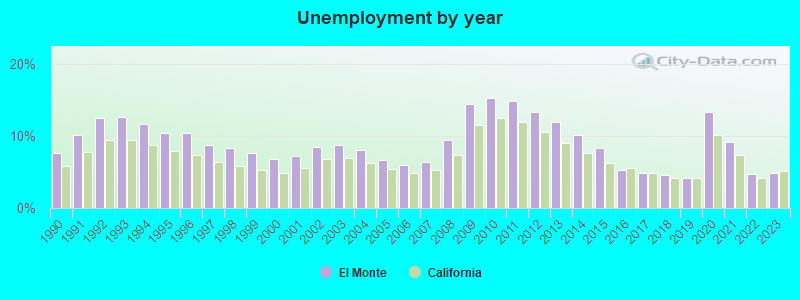
- Unemployed: 9.9%
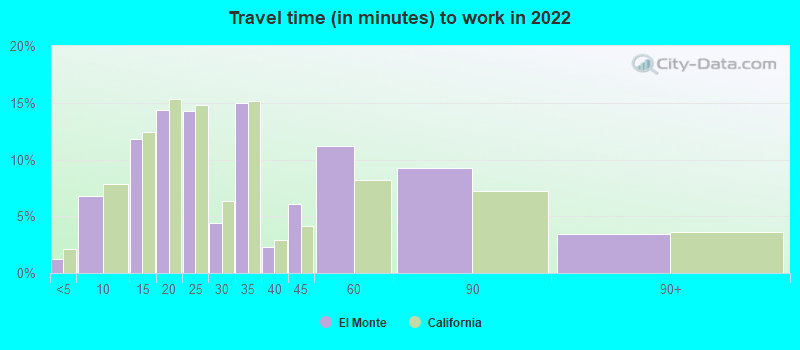
- Mean travel time to work (commute): 26.8 minutes
| Here: | 22.5 |
| California average: | 15.5 |


Graphs represent county-level data. Detailed 2008 Election Results
Neighborhoods in El Monte:
(El Monte, California Neighborhood Map)Religion statistics for El Monte, CA (based on Los Angeles County data)


| Religion | Adherents | Congregations |
|---|---|---|
| Catholic | 3,542,994 | 275 |
| Evangelical Protestant | 814,611 | 3,249 |
| Other | 451,594 | 1,023 |
| Mainline Protestant | 229,056 | 860 |
| Black Protestant | 112,338 | 290 |
| Orthodox | 63,517 | 76 |
| None | 4,604,495 | - |
Food Environment Statistics:
| This county: | 2.12 / 10,000 pop. |
| California: | 2.14 / 10,000 pop. |
| Los Angeles County: | 0.03 / 10,000 pop. |
| California: | 0.04 / 10,000 pop. |
| This county: | 0.58 / 10,000 pop. |
| California: | 0.62 / 10,000 pop. |
| Los Angeles County: | 1.23 / 10,000 pop. |
| California: | 1.49 / 10,000 pop. |
| Los Angeles County: | 7.15 / 10,000 pop. |
| State: | 7.42 / 10,000 pop. |
| Here: | 7.5% |
| California: | 7.3% |
| This county: | 20.4% |
| California: | 21.3% |
| Los Angeles County: | 18.6% |
| State: | 17.9% |
Health and Nutrition:
| El Monte: | 47.2% |
| State: | 49.4% |
| El Monte: | 46.6% |
| California: | 48.0% |
| This city: | 27.9 |
| California: | 28.1 |
| This city: | 22.5% |
| California: | 20.2% |
| El Monte: | 12.9% |
| California: | 11.2% |
| El Monte: | 6.8 |
| California: | 6.8 |
| This city: | 28.7% |
| California: | 31.5% |
| El Monte: | 53.9% |
| California: | 56.4% |
| This city: | 81.9% |
| State: | 80.9% |
More about Health and Nutrition of El Monte, CA Residents
| Local government employment and payroll (March 2022) | |||||
| Function | Full-time employees | Monthly full-time payroll | Average yearly full-time wage | Part-time employees | Monthly part-time payroll |
|---|---|---|---|---|---|
| Police Protection - Officers | 108 | $1,487,462 | $165,274 | 0 | $0 |
| Streets and Highways | 44 | $369,287 | $100,715 | 12 | $21,310 |
| Police - Other | 38 | $299,474 | $94,571 | 3 | $7,374 |
| Housing and Community Development (Local) | 26 | $246,329 | $113,690 | 3 | $7,216 |
| Other Government Administration | 19 | $85,529 | $54,018 | 6 | $10,775 |
| Financial Administration | 17 | $178,743 | $126,172 | 1 | $1,002 |
| Water Supply | 13 | $78,702 | $72,648 | 0 | $0 |
| Parks and Recreation | 11 | $95,981 | $104,707 | 39 | $63,731 |
| Transit | 9 | $60,771 | $81,028 | 5 | $10,807 |
| Totals for Government | 285 | $2,902,277 | $122,201 | 69 | $122,216 |
El Monte government finances - Expenditure in 2017 (per resident):
- Construction - Housing and Community Development: $7,744,000 ($73.53)
Parks and Recreation: $3,573,000 ($33.93)
Central Staff Services: $2,173,000 ($20.63)
Regular Highways: $678,000 ($6.44)
Police Protection: $627,000 ($5.95)
- Current Operations - Central Staff Services: $25,407,000 ($241.25)
Police Protection: $24,827,000 ($235.75)
Local Fire Protection: $12,183,000 ($115.68)
Regular Highways: $6,345,000 ($60.25)
Parks and Recreation: $3,920,000 ($37.22)
Transit Utilities: $3,797,000 ($36.05)
Housing and Community Development: $3,079,000 ($29.24)
Protective Inspection and Regulation - Other: $2,417,000 ($22.95)
Water Utilities: $2,298,000 ($21.82)
Sewerage: $1,753,000 ($16.65)
Financial Administration: $1,125,000 ($10.68)
Health - Other: $374,000 ($3.55)
Parking Facilities: $95,000 ($0.90)
- General - Interest on Debt: $3,455,000 ($32.81)
- Other Capital Outlay - General - Other: $1,100,000 ($10.45)
Housing and Community Development: $773,000 ($7.34)
- Water Utilities - Interest on Debt: $1,469,000 ($13.95)
El Monte government finances - Revenue in 2017 (per resident):
- Charges - Other: $4,546,000 ($43.17)
Sewerage: $2,474,000 ($23.49)
Parks and Recreation: $695,000 ($6.60)
Parking Facilities: $223,000 ($2.12)
Housing and Community Development: $66,000 ($0.63)
- Federal Intergovernmental - Other: $4,174,000 ($39.63)
Housing and Community Development: $686,000 ($6.51)
- Local Intergovernmental - Other: $1,094,000 ($10.39)
Water Utilities: $8,000 ($0.08)
- Miscellaneous - General Revenue - Other: $1,383,000 ($13.13)
Fines and Forfeits: $1,120,000 ($10.64)
Donations From Private Sources: $716,000 ($6.80)
Interest Earnings: $704,000 ($6.68)
Rents: $652,000 ($6.19)
- Revenue - Water Utilities: $5,135,000 ($48.76)
Transit Utilities: $489,000 ($4.64)
- State Intergovernmental - Highways: $2,143,000 ($20.35)
Other: $1,531,000 ($14.54)
General Local Government Support: $124,000 ($1.18)
- Tax - Property: $34,773,000 ($330.19)
General Sales and Gross Receipts: $25,478,000 ($241.93)
Public Utilities Sales: $10,161,000 ($96.48)
Occupation and Business License - Other: $2,087,000 ($19.82)
Other License: $1,775,000 ($16.85)
Other: $1,385,000 ($13.15)
Other Selective Sales: $476,000 ($4.52)
Documentary and Stock Transfer: $290,000 ($2.75)
El Monte government finances - Debt in 2017 (per resident):
- Long Term Debt - Beginning Outstanding - Unspecified Public Purpose: $72,649,000 ($689.85)
Outstanding Unspecified Public Purpose: $69,494,000 ($659.89)
Retired Unspecified Public Purpose: $35,165,000 ($333.91)
Issue, Unspecified Public Purpose: $32,010,000 ($303.95)
Beginning Outstanding - Public Debt for Private Purpose: $3,955,000 ($37.56)
Outstanding Nonguaranteed - Industrial Revenue: $3,155,000 ($29.96)
Retired Nonguaranteed - Public Debt for Private Purpose: $800,000 ($7.60)
El Monte government finances - Cash and Securities in 2017 (per resident):
- Bond Funds - Cash and Securities: $1,318,000 ($12.52)
- Other Funds - Cash and Securities: $109,520,000 ($1039.96)
- Sinking Funds - Cash and Securities: $6,632,000 ($62.97)
2.98% of this county's 2021 resident taxpayers lived in other counties in 2020 ($81,235 average adjusted gross income)
| Here: | 2.98% |
| California average: | 5.19% |
0.01% of residents moved from foreign countries ($155 average AGI)
Los Angeles County: 0.01% California average: 0.03%
Top counties from which taxpayers relocated into this county between 2020 and 2021:
| from Orange County, CA | |
| from San Bernardino County, CA | |
| from Riverside County, CA |
4.68% of this county's 2020 resident taxpayers moved to other counties in 2021 ($97,324 average adjusted gross income)
| Here: | 4.68% |
| California average: | 6.14% |
0.01% of residents moved to foreign countries ($196 average AGI)
Los Angeles County: 0.01% California average: 0.02%
Top counties to which taxpayers relocated from this county between 2020 and 2021:
| to Orange County, CA | |
| to San Bernardino County, CA | |
| to Riverside County, CA |
| Businesses in El Monte, CA | ||||
| Name | Count | Name | Count | |
|---|---|---|---|---|
| 7-Eleven | 6 | Kroger | 1 | |
| 99 Cents Only Stores | 1 | Little Caesars Pizza | 2 | |
| AT&T | 1 | MasterBrand Cabinets | 2 | |
| Ace Hardware | 1 | McDonald's | 3 | |
| AutoZone | 1 | Motel 6 | 1 | |
| Baskin-Robbins | 1 | Nike | 6 | |
| Budget Car Rental | 1 | Nissan | 1 | |
| Burger King | 1 | Payless | 1 | |
| CVS | 3 | Pizza Hut | 1 | |
| Carl\s Jr. | 1 | RadioShack | 2 | |
| Chuck E. Cheese's | 1 | Rite Aid | 1 | |
| Church's Chicken | 1 | SAS Shoes | 1 | |
| Circle K | 3 | Sam's Club | 1 | |
| Curves | 1 | Sears | 1 | |
| DHL | 1 | Skechers USA | 1 | |
| Dennys | 2 | Sprint Nextel | 1 | |
| Domino's Pizza | 1 | Staples | 1 | |
| El Pollo Loco | 3 | Starbucks | 3 | |
| FedEx | 5 | Subway | 3 | |
| GameStop | 1 | Taco Bell | 2 | |
| Goodwill | 2 | Toyota | 1 | |
| H&R Block | 4 | True Value | 1 | |
| Home Depot | 1 | U-Haul | 2 | |
| HomeTown Buffet | 1 | UPS | 4 | |
| Honda | 1 | Vans | 2 | |
| Jamba Juice | 1 | Verizon Wireless | 1 | |
| KFC | 1 | Walgreens | 2 | |
Strongest AM radio stations in El Monte:
- KLAC (570 AM; 50 kW; LOS ANGELES, CA; Owner: AMFM RADIO LICENSES, L.L.C.)
- KDIS (1110 AM; 50 kW; PASADENA, CA; Owner: ABC,INC.)
- KTNQ (1020 AM; 50 kW; LOS ANGELES, CA; Owner: KTNQ-AM LICENSE CORP.)
- KXTA (1150 AM; 50 kW; LOS ANGELES, CA; Owner: CITICASTERS LICENSES, L.P.)
- KFWB (980 AM; 50 kW; LOS ANGELES, CA; Owner: INFINITY BROADCASTING OPERATIONS, INC.)
- KFI (640 AM; 50 kW; LOS ANGELES, CA; Owner: CAPSTAR TX LIMITED PARTNERSHIP)
- KMPC (1540 AM; 50 kW; LOS ANGELES, CA; Owner: ROSE CITY RADIO CORPORATION)
- KXMX (1190 AM; 25 kW; ANAHEIM, CA; Owner: NEW INSPIRATION BROADCASTING COMPANY)
- KBLA (1580 AM; 50 kW; SANTA MONICA, CA)
- KALI (900 AM; 6 kW; WEST COVINA, CA; Owner: MULTICULTURAL RADIO BROADCASTING, INC.)
- KMRB (1430 AM; 5 kW; SAN GABRIEL, CA; Owner: POLYETHNIC BROADCASTING, INC.)
- KRLA (870 AM; 20 kW; GLENDALE, CA; Owner: NEW INSPIRATION BROADCASTING COMPANY)
- KSPN (710 AM; 50 kW; LOS ANGELES, CA; Owner: KABC-AM RADIO, INC.)
Strongest FM radio stations in El Monte:
- KCBS-FM (93.1 FM; LOS ANGELES, CA; Owner: INFINITY BROADCASTING OPERATIONS, INC.)
- KSCA (101.9 FM; GLENDALE, CA; Owner: HBC LICENSE CORPORATION)
- KOST (103.5 FM; LOS ANGELES, CA; Owner: CAPSTAR TX LIMITED PARTNERSHIP)
- KLOS (95.5 FM; LOS ANGELES, CA; Owner: KLOS-FM RADIO, INC.)
- K212FA (90.3 FM; TEMPLE CITY, CA; Owner: EDUCATIONAL MEDIA FOUNDATION)
- KIIS-FM (102.7 FM; LOS ANGELES, CA; Owner: CITICASTERS LICENSES, L.P.)
- KLVE (107.5 FM; LOS ANGELES, CA; Owner: KLVE-FM LICENSE CORP.)
- KPCC (89.3 FM; PASADENA, CA; Owner: PASADENA AREA COMMUNITY COLLEGE DISTRICT)
- KHHT (92.3 FM; LOS ANGELES, CA; Owner: AMFM RADIO LICENSES, L.L.C.)
- KBIG-FM (104.3 FM; LOS ANGELES, CA; Owner: AMFM RADIO LICENSES, L.L.C.)
- KZLA-FM (93.9 FM; LOS ANGELES, CA; Owner: EMMIS RADIO LICENSE CORPORATION)
- KTWV (94.7 FM; LOS ANGELES, CA; Owner: INFINITY BROADCASTING OPERATIONS, INC.)
- KMZT-FM (105.1 FM; LOS ANGELES, CA; Owner: MOUNT WILSON FM BROADCASTERS, INC.)
- KPFK (90.7 FM; LOS ANGELES, CA; Owner: PACIFICA FOUNDATION, INC)
- K216EM (91.1 FM; ARCADIA, CA; Owner: LIFE ON THE WAY COMMUNICATIONS, INC.)
- KPWR (105.9 FM; LOS ANGELES, CA; Owner: EMMIS RADIO LICENSE CORPORATION)
- KLSX (97.1 FM; LOS ANGELES, CA; Owner: INFINITY BROADCASTING OPERATIONS, INC.)
- KUSC (91.5 FM; LOS ANGELES, CA; Owner: UNIVERSITY OF SOUTHERN CALIFORNIA)
- KKLA-FM (99.5 FM; LOS ANGELES, CA; Owner: NEW INSPIRATION BROADCASTING CO., INC.)
- KRTH-FM (101.1 FM; LOS ANGELES, CA; Owner: INFINITY BROADCASTING OPERATIONS, INC.)
TV broadcast stations around El Monte:
- KCBS-TV (Channel 2; LOS ANGELES, CA; Owner: CBS BROADCASTING INC.)
- KTRO-LP (Channel 50; LANCASTER, CA; Owner: ROBERT D. ADELMAN)
- KTLA-TV (Channel 5; LOS ANGELES, CA; Owner: KTLA INC.)
- KABC-TV (Channel 7; LOS ANGELES, CA; Owner: ABC HOLDING COMPANY, INC.)
- KNBC (Channel 4; LOS ANGELES, CA; Owner: NBC SUBSIDIARY (KNBC-TV), INC.)
- KCAL-TV (Channel 9; LOS ANGELES, CA; Owner: VIACOM TELEVISION STATIONS GROUP OF LOS ANGELES LLC)
- KMEX-TV (Channel 34; LOS ANGELES, CA; Owner: KMEX LICENSE PARTNERSHIP, G.P.)
- KSCI (Channel 18; LONG BEACH, CA; Owner: KSLS, INC.)
- KAZA-TV (Channel 54; AVALON, CA; Owner: PAPPAS SOUTHERN CALIFORNIA LICENSE LLC)
- KDOC-TV (Channel 56; ANAHEIM, CA; Owner: GOLDEN ORANGE BROADCASTING CO., INC.)
- KOCE-TV (Channel 50; HUNTINGTON BEACH, CA; Owner: BD. OF TRUSTEES, COAST COMMUNITY COLLEGE DIST.)
- KCET (Channel 28; LOS ANGELES, CA; Owner: COMMUNITY TELEVISION OF SOUTHERN CALIFORNIA)
- KXLA (Channel 44; RANCHO PALOS VERDES, CA; Owner: RANCHO PALOS VERDES BROADCASTERS, INC.)
- KFTR (Channel 46; ONTARIO, CA; Owner: TELEFUTURA LOS ANGELES LLC)
- KTTV (Channel 11; LOS ANGELES, CA; Owner: FOX TELEVISION STATIONS, INC.)
- KWHY-TV (Channel 22; LOS ANGELES, CA; Owner: TELEMUNDO OF LOS ANGELES LICENSE CORPORATION)
- KVEA (Channel 52; CORONA, CA; Owner: ESTRELLA LICENSE CORPORATION)
- KHIZ (Channel 64; BARSTOW, CA; Owner: SUNBELT TELEVISION, INC.)
- KCOP-TV (Channel 13; LOS ANGELES, CA; Owner: FOX TELEVISION STATIONS, INC.)
- KTBN-TV (Channel 40; SANTA ANA, CA; Owner: TRINITY BROADCASTING NETWORK, INC.)
- KSFV-LP (Channel 26; SAN FERNANDO VALLEY, CA; Owner: VENTURE TECHNOLOGIES GROUP, LLC)
- KLCS (Channel 58; LOS ANGELES, CA; Owner: LOS ANGELES UNIFIED SCHOOL DISTRICT)
- KHTV-LP (Channel 48; INLAND EMPIRE, CA; Owner: VENTURE TECHNOLOGIES GROUP, LLC)
- KLAU-LP (Channel 66; REDLANDS, CA; Owner: GERALD BENAVIDES)
- KNET-LP (Channel 38; LOS ANGELES, CA; Owner: VENTURE TECHNOLOGIES GROUP, LLC)
- National Bridge Inventory (NBI) Statistics
- 62Number of bridges
- 430ft / 131mTotal length
- $5,744,000Total costs
- 4,520,349Total average daily traffic
- 151,712Total average daily truck traffic
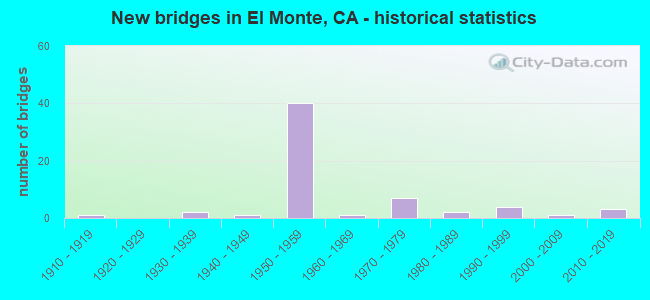
- New bridges - historical statistics
- 11910-1919
- 21930-1939
- 11940-1949
- 401950-1959
- 11960-1969
- 71970-1979
- 21980-1989
- 41990-1999
- 12000-2009
- 32010-2019
FCC Registered Private Land Mobile Towers: 1 (See the full list of FCC Registered Private Land Mobile Towers in El Monte, CA)
FCC Registered Broadcast Land Mobile Towers: 29 (See the full list of FCC Registered Broadcast Land Mobile Towers)
FCC Registered Microwave Towers: 38 (See the full list of FCC Registered Microwave Towers in this town)
FCC Registered Maritime Coast & Aviation Ground Towers: 2 (See the full list of FCC Registered Maritime Coast & Aviation Ground Towers)
FCC Registered Amateur Radio Licenses: 158 (See the full list of FCC Registered Amateur Radio Licenses in El Monte)
FAA Registered Aircraft: 34 (See the full list of FAA Registered Aircraft in El Monte)
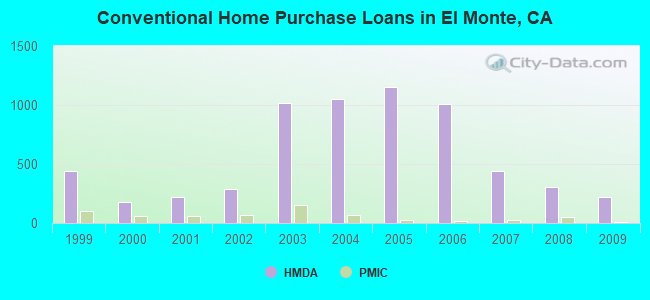
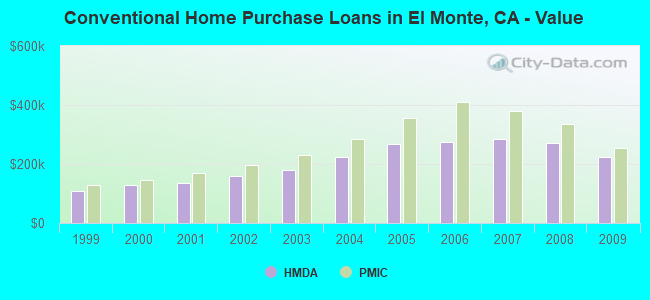
| Home Mortgage Disclosure Act Aggregated Statistics For Year 2009 (Based on 16 full and 9 partial tracts) | ||||||||||||||
| A) FHA, FSA/RHS & VA Home Purchase Loans | B) Conventional Home Purchase Loans | C) Refinancings | D) Home Improvement Loans | E) Loans on Dwellings For 5+ Families | F) Non-occupant Loans on < 5 Family Dwellings (A B C & D) | G) Loans On Manufactured Home Dwelling (A B C & D) | ||||||||
|---|---|---|---|---|---|---|---|---|---|---|---|---|---|---|
| Number | Average Value | Number | Average Value | Number | Average Value | Number | Average Value | Number | Average Value | Number | Average Value | Number | Average Value | |
| LOANS ORIGINATED | 29 | $279,742 | 219 | $224,884 | 546 | $227,062 | 32 | $193,050 | 14 | $656,604 | 58 | $222,465 | 1 | $22,000 |
| APPLICATIONS APPROVED, NOT ACCEPTED | 4 | $376,140 | 36 | $247,549 | 91 | $240,541 | 8 | $133,711 | 0 | $0 | 8 | $257,394 | 2 | $30,115 |
| APPLICATIONS DENIED | 14 | $284,410 | 83 | $240,457 | 329 | $267,621 | 34 | $97,816 | 5 | $509,072 | 43 | $277,977 | 5 | $36,400 |
| APPLICATIONS WITHDRAWN | 9 | $367,158 | 47 | $223,808 | 135 | $247,625 | 13 | $166,312 | 0 | $0 | 18 | $240,182 | 0 | $0 |
| FILES CLOSED FOR INCOMPLETENESS | 6 | $249,700 | 19 | $254,111 | 48 | $262,067 | 6 | $132,275 | 1 | $616,340 | 4 | $199,085 | 0 | $0 |
Detailed mortgage data for all 25 tracts in El Monte, CA
| Private Mortgage Insurance Companies Aggregated Statistics For Year 2009 (Based on 11 full and 6 partial tracts) | ||||
| A) Conventional Home Purchase Loans | B) Refinancings | |||
|---|---|---|---|---|
| Number | Average Value | Number | Average Value | |
| LOANS ORIGINATED | 9 | $254,143 | 4 | $300,325 |
| APPLICATIONS APPROVED, NOT ACCEPTED | 8 | $304,125 | 4 | $355,878 |
| APPLICATIONS DENIED | 5 | $220,596 | 6 | $282,133 |
| APPLICATIONS WITHDRAWN | 3 | $236,623 | 2 | $222,275 |
| FILES CLOSED FOR INCOMPLETENESS | 0 | $0 | 0 | $0 |
2005 - 2018 National Fire Incident Reporting System (NFIRS) incidents
- Fire incident types reported to NFIRS in El Monte, CA
- 68842.7%Outside Fires
- 47029.2%Structure Fires
- 33020.5%Mobile Property/Vehicle Fires
- 1237.6%Other
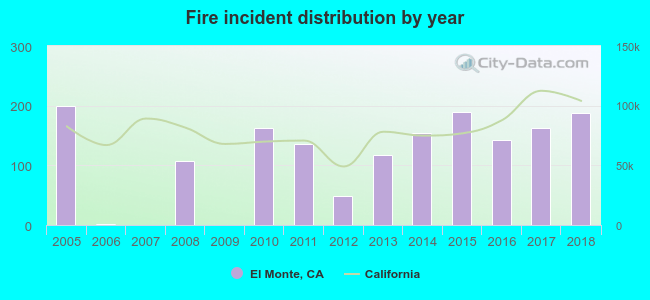 Based on the data from the years 2005 - 2018 the average number of fire incidents per year is 115. The highest number of fire incidents - 200 took place in 2005, and the least - 0 in 2007. The data has a dropping trend.
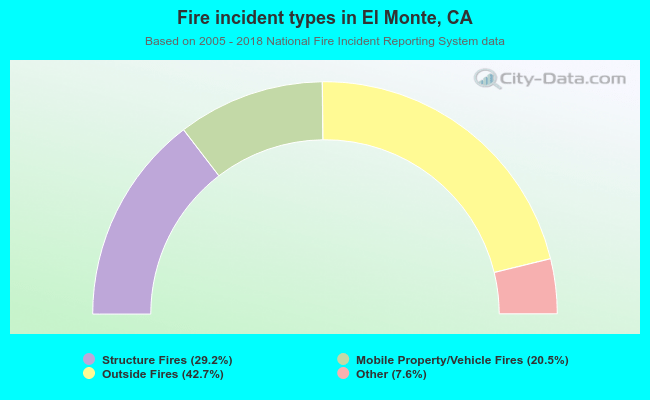 When looking into fire subcategories, the most incidents belonged to: Outside Fires (42.7%), and Structure Fires (29.2%).
Fire-safe hotels and motels in El Monte, California:
- La Bonita Motel, 10407 E Garvey Ave, El Monte, California 91733 , Phone: (626) 448-0886
- America's Best Value Inn & Suites, 12040 Garvey Ave, El Monte, California 91732 , Phone: (626) 442-8354, Fax: (626) 442-8357
- Aqua Inn Motel, 12031 Garvey Ave, El Monte, California 91732 , Phone: (626) 443-4111, Fax: (626) 443-4144
- Holiday Inn El Monte-Los Angeles, 9920 Valley Blvd, El monte, California 91731 , Phone: (626) 350-0600
| Most common first names in El Monte, CA among deceased individuals | ||
| Name | Count | Lived (average) |
|---|---|---|
| John | 295 | 73.8 years |
| William | 244 | 74.8 years |
| Mary | 227 | 76.8 years |
| Maria | 183 | 74.1 years |
| Robert | 167 | 67.3 years |
| George | 165 | 75.3 years |
| James | 157 | 71.0 years |
| Charles | 151 | 74.8 years |
| Frank | 138 | 73.5 years |
| Joseph | 124 | 74.4 years |
| Most common last names in El Monte, CA among deceased individuals | ||
| Last name | Count | Lived (average) |
|---|---|---|
| Smith | 97 | 75.0 years |
| Garcia | 92 | 68.4 years |
| Rodriguez | 80 | 73.0 years |
| Martinez | 71 | 70.4 years |
| Lopez | 69 | 70.4 years |
| Hernandez | 68 | 71.8 years |
| Gonzalez | 60 | 69.3 years |
| Sanchez | 57 | 70.8 years |
| Johnson | 57 | 75.0 years |
| Brown | 49 | 75.3 years |
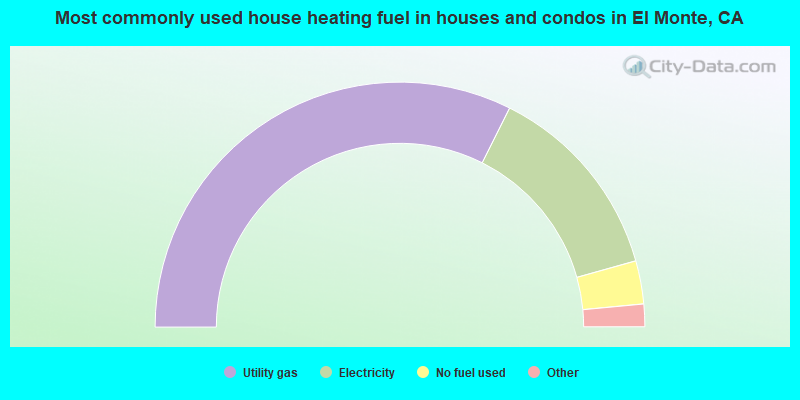
- 64.8%Utility gas
- 26.5%Electricity
- 5.7%No fuel used
- 2.1%Bottled, tank, or LP gas
- 0.5%Solar energy
- 0.1%Wood
- 0.1%Fuel oil, kerosene, etc.
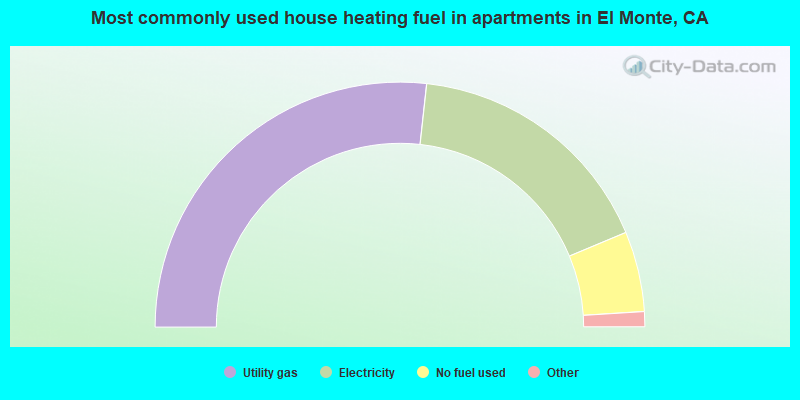
- 53.5%Utility gas
- 33.9%Electricity
- 10.6%No fuel used
- 1.7%Bottled, tank, or LP gas
- 0.1%Solar energy
El Monte compared to California state average:
- Median household income below state average.
- Black race population percentage significantly below state average.
- Foreign-born population percentage above state average.
- Percentage of population with a bachelor's degree or higher below state average.
El Monte, CA compared to other similar cities:
El Monte on our top lists:
- #3 on the list of "Top 101 cities with the highest percentage of family households, population 100,000+"
- #5 on the list of "Top 101 cities with largest percentage of females in occupations: personal care and service occupations (population 50,000+)"
- #7 on the list of "Top 101 cities with the most cars per house, population 50,000+"
- #7 on the list of "Top 101 cities with the least people having Doctorate degrees (population 50,000+)"
- #8 on the list of "Top 101 cities with largest percentage of females in industries: manufacturing (population 50,000+)"
- #8 on the list of "Top 101 cities with the least people having professional degrees (population 50,000+)"
- #10 on the list of "Top 100 cities with highest ratio of median house value to median household income (pop. 50,000+)"
- #10 on the list of "Top 101 cities with largest percentage of males in industries: other services, except public administration (population 50,000+)"
- #13 on the list of "Top 101 cities with largest percentage of males in industries: wholesale trade (population 50,000+)"
- #14 on the list of "Top 101 cities with the lowest percentage of English-only speaking households, population 50,000+"
- #14 on the list of "Top 101 cities with the least people having Master's or Doctorate degrees (population 50,000+)"
- #15 on the list of "Top 101 cities with the most residents born in Vietnam (population 500+)"
- #16 on the list of "Top 101 cities with largest percentage of females in occupations: production occupations (population 50,000+)"
- #17 on the list of "Top 101 larger cities with the highest increase in house/condo value from 2000 (population 50,000+)"
- #18 on the list of "Top 100 cities with highest percentage of foreign-born residents (pop. 50,000+)"
- #19 on the list of "Top 100 least-educated cities (pop. 50,000+)"
- #24 on the list of "Top 101 cities with the lowest number of thefts per 100,000 residents (population 50,000+)"
- #32 on the list of "Top 101 larger cities with the largest decrease or smallest increase in household income from 2000 (population 50,000+)"
- #34 on the list of "Top 101 cities with largest percentage of males in occupations: installation, maintenance, and repair occupations (population 50,000+)"
- #36 on the list of "Top 101 cities with largest percentage of males in occupations: material moving occupations (population 50,000+)"
- #1 on the list of "Top 101 counties with the most Evangelical Protestant congregations"
- #1 on the list of "Top 101 counties with the most Mainline Protestant congregations"
- #1 on the list of "Top 101 counties with the most Orthodox adherents"
- #1 on the list of "Top 101 counties with the highest ground withdrawal of fresh water for public supply (pop. 50,000+)"
- #1 on the list of "Top 101 counties with the most Catholic adherents (pop. 50,000+)"

|
|
Total of 209 patent applications in 2008-2024.