Estimated zip code population in 2022: 26,362 Zip code population in 2010: 25,616 Zip code population in 2000: 23,975
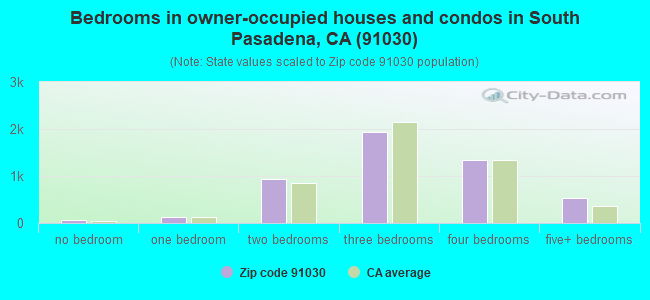
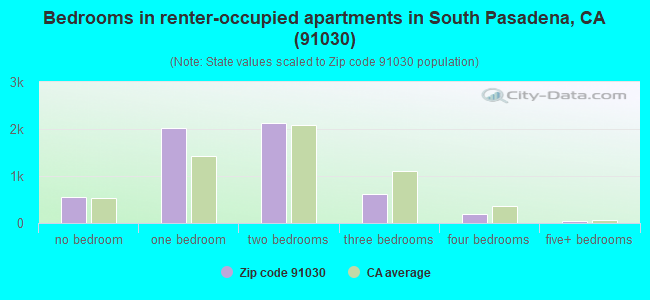
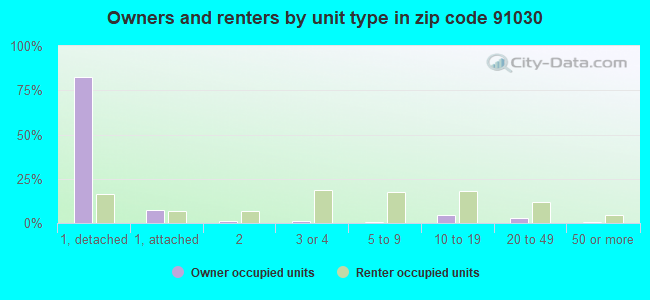
Houses and condos: 11,122 Renter-occupied apartments: 5,558
% of renters here:
53%
State:
44%
March 2022 cost of living index in zip code 91030: 141.4 (very high, U.S. average is 100)
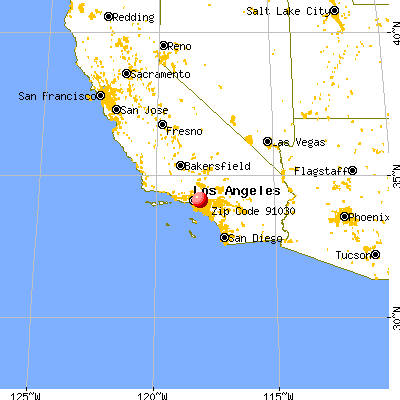
Land area: 3.4 sq. mi. Water area: 0.0 sq. mi.
Population density: 7,729 people per square mile
(high).
OSM Map
General Map
Google Map
MSN Map
OSM Map
General Map
Google Map
MSN Map
OSM Map
General Map
Google Map
MSN Map
OSM Map
General Map
Google Map
MSN Map
Please wait while loading the map...
Real estate property taxes paid for housing units in 2022:
This zip code:
0.5% ($8,600)
California:
0.7% ($4,831)
Median real estate property taxes paid for housing units with mortgages in 2022: $9,571 (0.6%) Median real estate property taxes paid for housing units with no mortgage in 2022: $5,648 (0.4%)
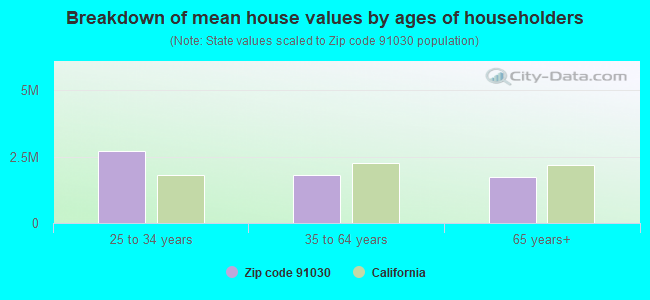
Estimated median house/condo value in 2022: $1,578,281
91030:
$1,578,281
California:
$715,900
According to our research of California and other state lists, there were 8 registered sex offenders living in 91030 zip code as of April 27, 2024. The ratio of all residents to sex offenders in zip code 91030 is 3,285 to 1. The ratio of registered sex offenders to all residents in this zip code is much lower than the state average.
Median resident age:
This zip code:
41.3 years
California median age:
37.9 years
Average household size:
This zip code:
2.5 people
California:
2.8 people
Averages for the 2020 tax year for zip code 91030, filed in 2021:
Average Adjusted Gross Income (AGI) in 2020: $152,860 (Individual Income Tax Returns)
Here:
$152,860
State:
$95,910
Salary/wage: $112,111 (reported on 76.7% of returns)
Here:
$112,111
State:
$77,331
(% of AGI for various income ranges: 1171.0% for AGIs below $25k, 3748.5% for AGIs $25k-50k, 7495.4% for AGIs $50k-75k, 10830.6% for AGIs $75k-100k, 20980.3% for AGIs $100k-200k, 108067.6% for AGIs over 200k)
Taxable interest for individuals: $4,157 (reported on 48.8% of returns)
This zip code:
$4,157
California:
$2,294
(% of AGI for various income ranges: 45.4% for AGIs below $25k, 62.3% for AGIs $25k-50k, 91.3% for AGIs $50k-75k, 111.6% for AGIs $75k-100k, 306.3% for AGIs $100k-200k, 3278.8% for AGIs over 200k)
Ordinary dividends: $14,490 (reported on 36.6% of returns)
Here:
$14,490
State:
$10,949
(% of AGI for various income ranges: 91.6% for AGIs below $25k, 106.1% for AGIs $25k-50k, 218.5% for AGIs $50k-75k, 258.6% for AGIs $75k-100k, 692.5% for AGIs $100k-200k, 9097.9% for AGIs over 200k)
Net capital gain/loss in AGI: +$45,205 (reported on 34.7% of returns)
Here:
+$45,205
State:
+$49,306
(% of AGI for various income ranges: 61.8% for AGIs below $25k, 122.0% for AGIs $25k-50k, 186.2% for AGIs $50k-75k, 403.5% for AGIs $75k-100k, 923.7% for AGIs $100k-200k, 31430.5% for AGIs over 200k)
Profit/loss from business: +$19,115 (reported on 24.7% of returns)
Here:
+$19,115
State:
+$15,671
(% of AGI for various income ranges: 231.4% for AGIs below $25k, 491.7% for AGIs $25k-50k, 486.8% for AGIs $50k-75k, 477.8% for AGIs $75k-100k, 913.6% for AGIs $100k-200k, 5306.6% for AGIs over 200k)
Taxable individual retirement arrangement distribution: $25,486 (reported on 9.1% of returns)
91030:
$25,486
California:
$23,505
(% of AGI for various income ranges: 74.9% for AGIs below $25k, 114.3% for AGIs $25k-50k, 242.3% for AGIs $50k-75k, 283.0% for AGIs $75k-100k, 709.0% for AGIs $100k-200k, 2442.1% for AGIs over 200k)
Self-employed (Keogh) retirement plans: $34,442 (reported on 2.4% of returns)
91030:
$34,442
California:
$30,163
(% of AGI for various income ranges: 28.6% for AGIs $50k-75k, 62.9% for AGIs $100k-200k, 1665.9% for AGIs over 200k)
Total itemized deductions: $45,429 (reported on 21.6% of returns)
Here:
$45,429
State:
$39,517
(% of AGI for various income ranges: 154.6% for AGIs below $25k, 279.5% for AGIs $25k-50k, 462.8% for AGIs $50k-75k, 824.6% for AGIs $75k-100k, 2140.3% for AGIs $100k-200k, 14414.0% for AGIs over 200k)
Charity contributions: $14,864 (reported on 18.8% of returns)
Here:
$14,864
State:
$12,598
(% of AGI for various income ranges: 7.5% for AGIs below $25k, 23.2% for AGIs $25k-50k, 54.9% for AGIs $50k-75k, 122.5% for AGIs $75k-100k, 365.1% for AGIs $100k-200k, 5110.9% for AGIs over 200k)
Taxes paid: $9,267 (reported on 21.5% of returns)
91030:
$9,267
State:
$8,807
(% of AGI for various income ranges: 34.9% for AGIs below $25k, 62.2% for AGIs $25k-50k, 116.2% for AGIs $50k-75k, 218.3% for AGIs $75k-100k, 586.6% for AGIs $100k-200k, 2481.2% for AGIs over 200k)
Earned income credit: $1,497 (reported on 8.1% of returns)
Here:
$1,497
State:
$2,074
(% of AGI for various income ranges: 52.0% for AGIs below $25k, 53.4% for AGIs $25k-50k)
Percentage of individuals using paid preparers for their 2020 taxes: 91.5%
Here:
91%
State:
92%
(% for various income ranges: 89.9% for AGIs below $25k, 91.4% for AGIs $25k-50k, 91.8% for AGIs $50k-75k, 90.4% for AGIs $75k-100k, 92.6% for AGIs $100k-200k, 93.0% for AGIs over 200k)
Averages for the 2012 tax year for zip code 91030, filed in 2013:
Average Adjusted Gross Income (AGI) in 2012: $118,060 (Individual Income Tax Returns)
Here:
$118,060
State:
$72,726
Salary/wage: $87,317 (reported on 79.0% of returns)
Here:
$87,317
State:
$59,079
(% of AGI for various income ranges: 65.9% for AGIs below $25k, 76.4% for AGIs $25k-50k, 79.8% for AGIs $50k-75k, 73.0% for AGIs $75k-100k, 74.3% for AGIs $100k-200k, 45.0% for AGIs over 200k)
Taxable interest for individuals: $2,614 (reported on 49.7% of returns)
This zip code:
$2,614
California:
$2,146
(% of AGI for various income ranges: 2.2% for AGIs below $25k, 0.7% for AGIs $25k-50k, 0.9% for AGIs $50k-75k, 0.8% for AGIs $75k-100k, 0.9% for AGIs $100k-200k, 1.2% for AGIs over 200k)
Ordinary dividends: $13,236 (reported on 33.6% of returns)
Here:
$13,236
State:
$9,308
(% of AGI for various income ranges: 3.6% for AGIs below $25k, 1.6% for AGIs $25k-50k, 1.5% for AGIs $50k-75k, 2.3% for AGIs $75k-100k, 2.0% for AGIs $100k-200k, 5.2% for AGIs over 200k)
Net capital gain/loss in AGI: +$42,228 (reported on 29.6% of returns)
Here:
+$42,228
State:
+$30,460
(% of AGI for various income ranges: 0.2% for AGIs below $25k, 0.3% for AGIs $25k-50k, 0.7% for AGIs $50k-75k, 0.7% for AGIs $75k-100k, 1.3% for AGIs $100k-200k, 18.5% for AGIs over 200k)
Profit/loss from business: +$20,630 (reported on 24.4% of returns)
Here:
+$20,630
State:
+$17,064
(% of AGI for various income ranges: 17.8% for AGIs below $25k, 9.1% for AGIs $25k-50k, 3.0% for AGIs $50k-75k, 5.1% for AGIs $75k-100k, 4.2% for AGIs $100k-200k, 3.2% for AGIs over 200k)
Taxable individual retirement arrangement distribution: $24,251 (reported on 10.1% of returns)
91030:
$24,251
California:
$19,557
(% of AGI for various income ranges: 3.7% for AGIs below $25k, 2.4% for AGIs $25k-50k, 1.6% for AGIs $50k-75k, 2.8% for AGIs $75k-100k, 2.5% for AGIs $100k-200k, 1.8% for AGIs over 200k)
Self-employment retirement plans: $27,978 (reported on 2.6% of returns)
91030:
$27,978
California:
$24,530
(% of AGI for various income ranges: 0.3% for AGIs $25k-50k, 0.3% for AGIs $75k-100k, 0.4% for AGIs $100k-200k, 0.9% for AGIs over 200k)
Total itemized deductions: $43,825 (20% of AGI, reported on 45.3% of returns)
Here:
$43,825
State:
$34,004
Here:
20.4% of AGI
State:
22.7% of AGI
(% of AGI for various income ranges: 14.8% for AGIs below $25k, 10.9% for AGIs $25k-50k, 13.1% for AGIs $50k-75k, 15.8% for AGIs $75k-100k, 19.6% for AGIs $100k-200k, 17.1% for AGIs over 200k)
Charity contributions: $7,159 (reported on 39.7% of returns)
Here:
$7,159
State:
$4,659
(% of AGI for various income ranges: 0.9% for AGIs below $25k, 1.0% for AGIs $25k-50k, 1.5% for AGIs $50k-75k, 1.9% for AGIs $75k-100k, 2.1% for AGIs $100k-200k, 2.9% for AGIs over 200k)
Taxes paid: $20,726 (reported on 45.2% of returns)
91030:
$20,726
State:
$14,448
(% of AGI for various income ranges: 3.1% for AGIs below $25k, 2.6% for AGIs $25k-50k, 4.0% for AGIs $50k-75k, 5.8% for AGIs $75k-100k, 8.3% for AGIs $100k-200k, 9.4% for AGIs over 200k)
Earned income credit: $1,676 (reported on 10.1% of returns)
Here:
$1,676
State:
$2,286
(% of AGI for various income ranges: 4.0% for AGIs below $25k, 0.7% for AGIs $25k-50k)
Percentage of individuals using paid preparers for their 2012 taxes: 62.2%
Here:
62%
State:
64%
(% for various income ranges: 57.1% for AGIs below $25k, 59.0% for AGIs $25k-50k, 60.1% for AGIs $50k-75k, 64.4% for AGIs $75k-100k, 65.6% for AGIs $100k-200k, 74.8% for AGIs over 200k)
Averages for the 2004 tax year for zip code 91030, filed in 2005:
Average Adjusted Gross Income (AGI) in 2004: $80,139 (Individual Income Tax Returns)
Here:
$80,139
State:
$58,600
Salary/wage: $65,146 (reported on 79.8% of returns)
Here:
$65,146
State:
$49,455
(% of AGI for various income ranges: 671.5% for AGIs below $10k, 68.1% for AGIs $10k-25k, 82.1% for AGIs $25k-50k, 81.1% for AGIs $50k-75k, 79.6% for AGIs $75k-100k, 55.8% for AGIs over 100k)
Taxable interest for individuals: $2,950 (reported on 57.3% of returns)
This zip code:
$2,950
California:
$2,365
(% of AGI for various income ranges: 83.2% for AGIs below $10k, 2.9% for AGIs $10k-25k, 1.7% for AGIs $25k-50k, 1.4% for AGIs $50k-75k, 1.4% for AGIs $75k-100k, 2.2% for AGIs over 100k)
Taxable dividends: $7,404 (reported on 35.4% of returns)
Here:
$7,404
State:
$4,746
(% of AGI for various income ranges: 77.4% for AGIs below $10k, 3.1% for AGIs $10k-25k, 1.3% for AGIs $25k-50k, 1.8% for AGIs $50k-75k, 1.5% for AGIs $75k-100k, 4.0% for AGIs over 100k)
Net capital gain/loss: +$18,977 (reported on 31.2% of returns)
Here:
+$18,977
State:
+$23,418
(% of AGI for various income ranges: -38.4% for AGIs below $10k, 0.2% for AGIs $10k-25k, 0.4% for AGIs $25k-50k, 0.7% for AGIs $50k-75k, 1.4% for AGIs $75k-100k, 11.1% for AGIs over 100k)
Profit/loss from business: +$18,117 (reported on 23.2% of returns)
Here:
+$18,117
State:
+$16,826
(% of AGI for various income ranges: 49.0% for AGIs below $10k, 12.4% for AGIs $10k-25k, 5.8% for AGIs $25k-50k, 4.0% for AGIs $50k-75k, 4.7% for AGIs $75k-100k, 5.0% for AGIs over 100k)
IRA payment deduction: $3,482 (reported on 4.6% of returns)
91030:
$3,482
California:
$3,192
(% of AGI for various income ranges: 4.7% for AGIs below $10k, 0.4% for AGIs $10k-25k, 0.5% for AGIs $25k-50k, 0.3% for AGIs $50k-75k, 0.3% for AGIs $75k-100k, 0.1% for AGIs over 100k)
Self-employed pension: $22,109 (reported on 3.1% of returns)
Here:
$22,109
California:
$17,688
(% of AGI for various income ranges: 0.1% for AGIs $10k-25k, 0.2% for AGIs $25k-50k, 0.2% for AGIs $50k-75k, 0.4% for AGIs $75k-100k, 1.2% for AGIs over 100k)
Total itemized deductions: $32,227 (23% of AGI, reported on 44.8% of returns)
Here:
$32,227
State:
$28,113
Here:
22.8% of AGI
State:
25.3% of AGI
(% of AGI for various income ranges: 132.2% for AGIs below $10k, 15.3% for AGIs $10k-25k, 12.7% for AGIs $25k-50k, 16.3% for AGIs $50k-75k, 20.3% for AGIs $75k-100k, 18.7% for AGIs over 100k)
Charity contributions deductions: $5,837 (4% of AGI, reported on 40.7% of returns)
Here:
$5,837
State:
$3,923
Here:
3.9% of AGI
State:
3.3% of AGI
(% of AGI for various income ranges: 8.2% for AGIs below $10k, 1.3% for AGIs $10k-25k, 1.6% for AGIs $25k-50k, 2.0% for AGIs $50k-75k, 2.8% for AGIs $75k-100k, 3.4% for AGIs over 100k)
Total tax: $15,427 (reported on 83.4% of returns)
91030:
$15,427
State:
$10,761
(% of AGI for various income ranges: 36.6% for AGIs below $10k, 5.5% for AGIs $10k-25k, 8.5% for AGIs $25k-50k, 11.0% for AGIs $50k-75k, 11.7% for AGIs $75k-100k, 19.4% for AGIs over 100k)
Earned income credit: $1,324 (reported on 8.4% of returns)
Here:
$1,324
State:
$1,763
Percentage of individuals using paid preparers for their 2004 taxes: 62.6%
Here:
63%
State:
66%
(% for various income ranges: 56.3% for AGIs below $10k, 61.0% for AGIs $10k-25k, 58.8% for AGIs $25k-50k, 60.9% for AGIs $50k-75k, 65.8% for AGIs $75k-100k, 72.5% for AGIs over 100k)
Likely homosexual households (counted as self-reported same-sex unmarried-partner households)
Lesbian couples: 0.2% of all households
Gay men: 0.2% of all households
Household received Food Stamps/SNAP in the past 12 months: 207 Household did not receive Food Stamps/SNAP in the past 12 months: 10,007
Women who had a birth in the past 12 months: 225 (169 now married, 56 unmarried) Women who did not have a birth in the past 12 months: 6,228 (2,968 now married, 3,238 unmarried)
Housing units in zip code 91030 with a mortgage: 3,345 (444 second mortgage, 14 home equity loan, 376 both second mortgage and home equity loan) Houses without a mortgage: 107
Median monthly owner costs for units with a mortgage: $3,876 Median monthly owner costs for units without a mortgage: $1,047
Residents with income below the poverty level in 2022:
This zip code:
4.9%
Whole state:
12.2%
Residents with income below 50% of the poverty level in 2022:
This zip code:
1.5%
Whole state:
6.2%
Median number of rooms in houses and condos:
Here:
6.8
State:
6.0
Median number of rooms in apartments:
Here:
4.0
State:
3.9
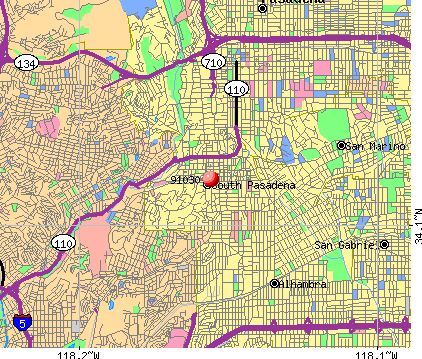
Notable locations in this zip code not listed on our city pages
Notable locations in zip code 91030: Arroyo Seco Golf Course (A), South Pasadena Public Library (B), South Pasadena City Hall (C), South Pasadena Fire Department (D). Display/hide their locations on the map
Churches in zip code 91030 include: Calvary Presbyterian Church (A), Grace Brethren Church (B), Holy Family Catholic Church (C), Oneonto Congregational Church (D), South Pasadena Chinese Church (E). Display/hide their locations on the map
4,750 married couples with children.
1,020 single-parent households (230 men, 790 women).
63.6% of residents of 91030 zip code speak English at home.
10.9% of residents speak Spanish at home (84% very well, 14% well, 1% not well).
3.9% of residents speak other Indo-European language at home (76% very well, 20% well, 3% not well).
21.3% of residents speak Asian or Pacific Island language at home (57% very well, 31% well, 9% not well, 3% not at all).
0.1% of residents speak other language at home (33% very well, 67% well).
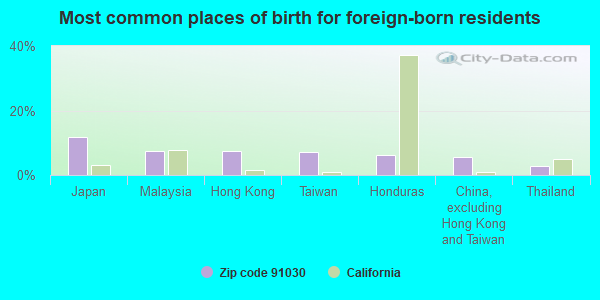
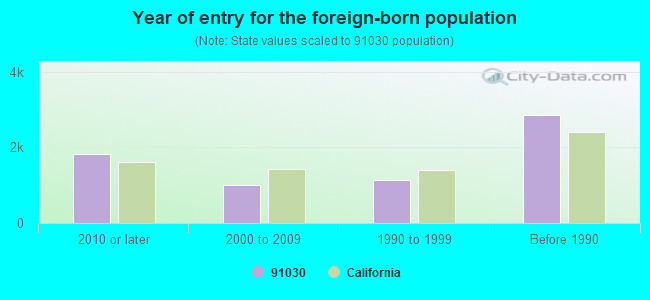
Foreign born population: 6,532 (24.8%) (65.1% of them are naturalized citizens)
Major facilities with environmental interests located in this zip code:
MICRODOT INCORPORATED MALCO (306 PASADENA AVE. in SOUTH PASADENA, CA)
STATE MASTER (California - Hazardous Waste Tracking) - HAZARDOU WASTE PROGRAM Large Quantity Generators, more that 1000 kg of hazardous waste/month (Resource Conservation and Recovery Act (tracking hazardous waste)) TRI REPORTER (Tracking of toxic chemicals releasing facilities) Business SIC classification: PLASTICS PRODUCTS; ELECTROPLATING, PLATING, POLISHING, ANODIZING, AND COLORING; CURRENT-CARRYING WIRING DEVICES Business NAICS classification: CURRENT-CARRYING WIRING DEVICE MANUFACTURING. Organizations: TYCO ELECTRONICS CORP. (CONTACT/OPERATOR)
Alternative names: MALCO A MICRODOT CO INC, MICRODOT CONNECTORS, ROBIN ADAIR, TYCO ELECTRONICS MICRODOT CONNECTORS
HUNTINGTON CLEANERS (1935 HUNTINGTON in SOUTH PASADENA, CA)
STATE MASTER (California - Hazardous Waste Tracking) - HAZARDOU WASTE PROGRAM Small Quantity Generators, between 100 kg and 1000 kg of hazardous waste/month (Resource Conservation and Recovery Act (tracking hazardous waste)) - notification Organizations: BOB PENLAND (CONTACT/OWNER)
JACK'S AUTO REPAIR (1001 GLENDON WAY in SOUTH PASADENA, CA)
STATE MASTER (California - Hazardous Waste Tracking) - HAZARDOU WASTE PROGRAM Small Quantity Generators, between 100 kg and 1000 kg of hazardous waste/month (Resource Conservation and Recovery Act (tracking hazardous waste)) - notification Business NAICS classification: GENERAL AUTOMOTIVE REPAIR. Organizations: FRANK GONSALEZ (CONTACT/OWNER)
MOCK PRINTING (1122 MISSION ST in SOUTH PASADENA, CA)
STATE MASTER (California - Hazardous Waste Tracking) - HAZARDOU WASTE PROGRAM Small Quantity Generators, between 100 kg and 1000 kg of hazardous waste/month (Resource Conservation and Recovery Act (tracking hazardous waste)) - notification Business NAICS classification: OTHER COMMERCIAL PRINTING. Organizations: WJ JJ SAMARIN (CONTACT/OWNER)
ABBOTT LABORATORIES (820 MISSION ST in SOUTH PASADENA, CA)
STATE MASTER (California - Hazardous Waste Tracking) - HAZARDOU WASTE PROGRAM Small Quantity Generators, between 100 kg and 1000 kg of hazardous waste/month (Resource Conservation and Recovery Act (tracking hazardous waste)) Business NAICS classification: IN-VITRO DIAGNOSTIC SUBSTANCE MANUFACTURING.
ELITE CLEANERS (1310 FAIR OAKS AVE in SOUTH PASADENA, CA)
STATE MASTER (California - Hazardous Waste Tracking) - HAZARDOU WASTE PROGRAM Small Quantity Generators, between 100 kg and 1000 kg of hazardous waste/month (Resource Conservation and Recovery Act (tracking hazardous waste))
FAIR OAKS CLEANER (1113 FAIR OAKS in SOUTH PASADENA, CA)
STATE MASTER (California - Hazardous Waste Tracking) - HAZARDOU WASTE PROGRAM Small Quantity Generators, between 100 kg and 1000 kg of hazardous waste/month (Resource Conservation and Recovery Act (tracking hazardous waste))
L A TESTING (159 PASADENA AVE in SOUTH PASADENA, CA)
STATE MASTER (California - Hazardous Waste Tracking) - HAZARDOU WASTE PROGRAM Small Quantity Generators, between 100 kg and 1000 kg of hazardous waste/month (Resource Conservation and Recovery Act (tracking hazardous waste)) - notification Organizations: DR PETER FRASCA (CONTACT/OWNER)
CHEVRON STATION 90623 (1200 FAIR OAKS AVE in SOUTH PASADENA, CA)
STATE MASTER (California - Hazardous Waste Tracking) - HAZARDOU WASTE PROGRAM Small Quantity Generators, between 100 kg and 1000 kg of hazardous waste/month (Resource Conservation and Recovery Act (tracking hazardous waste)) - notification Organizations: CHEVRON PRODUCTS CO (CONTACT/OWNER)
MARENGO ELEMENTARY (1400 MARENGO AVE. in SOUTH PASADENA, CA)
(National Center for Education Statistics) - STATE ID-6022776 Organizations: SOUTH PASADENA UNIFIED (SCHOOL DISTRICT)
MONTEREY HILLS ELEMENTARY (1624 VIA DEL REY in SOUTH PASADENA, CA)
(National Center for Education Statistics) - STATE ID-6022784 Organizations: SOUTH PASADENA UNIFIED (SCHOOL DISTRICT)
EXXONMOBIL OIL CORP NO 11342 (1401 MISSION ST in SOUTH PASADENA, CA)
Large Quantity Generators, more that 1000 kg of hazardous waste/month (Resource Conservation and Recovery Act (tracking hazardous waste)) Organizations: EXXONMOBIL OIL CORPORATION (CONTACT/OPERATOR)
HALVORSONS BLK & WHT CLEANERS (701 MISSION ST in SOUTH PASADENA, CA)
Housing units lacking complete plumbing facilities: 1.2% Housing units lacking complete kitchen facilities: 2.4%
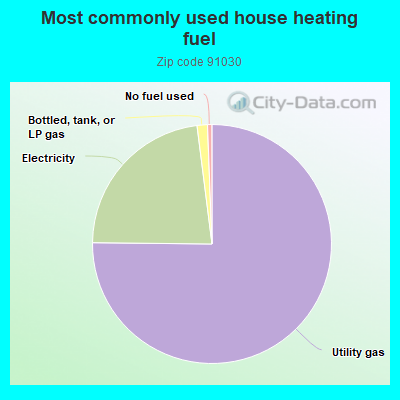
75.1%Utility gas
22.8%Electricity
1.4%Bottled, tank, or LP gas
0.6%No fuel used
Population in 1990: 23,936. Population change in the 1990s: +39 (+0.2%).
Place of birth for U.S.-born residents:
This state: 13,626
Northeast: 2,120
Midwest: 1,722
South: 1,220
West: 820
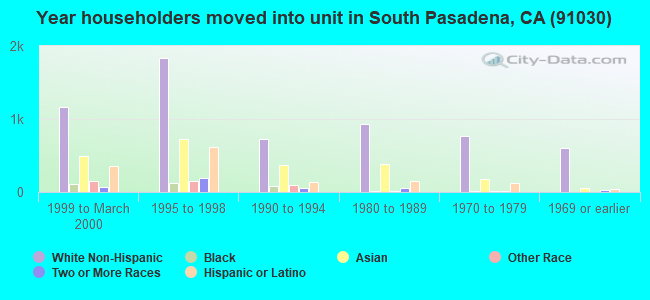
55% of the 91030 zip code residents lived in the same house 5 years ago. Out of people who lived in different houses, 77% lived in this county. Out of people who lived in different counties, 50% lived in California.
90% of the 91030 zip code residents lived in the same house 1 year ago. Out of people who lived in different houses, 67% moved from this county. Out of people who lived in different houses, 4% moved from different county within same state. Out of people who lived in different houses, 18% moved from different state. Out of people who lived in different houses, 11% moved from abroad.
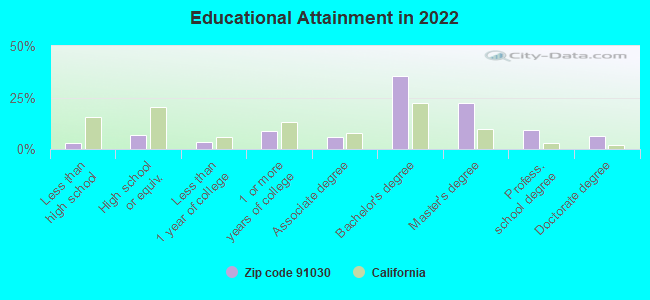
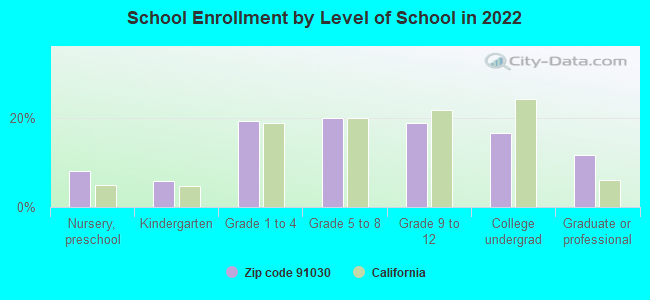
Private vs. public school enrollment:
Students in private schools in grades 1 to 8 (elementary and middle school): 273
Here:
10.0%
California:
10.5%
Students in private schools in grades 9 to 12 (high school): 139
Here:
10.6%
California:
8.5%
Students in private undergraduate colleges: 278
Here:
24.2%
California:
15.9%
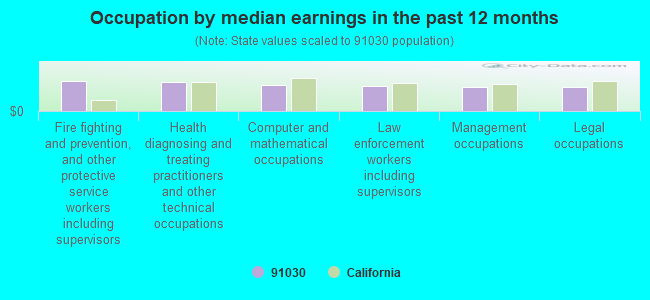
Occupation by median earnings in the past 12 months ($)
134,589Fire fighting and prevention, and other protective service workers including supervisors
129,532Health diagnosing and treating practitioners and other technical occupations
118,916Computer and mathematical occupations
112,870Law enforcement workers including supervisors
110,518Management occupations
110,289Legal occupations
Companies with federal contracts located in this zip code (SOUTH PASADENA, CA):
SEIJAS COURT REPORTERS (625 FAIR OAKS AVE; small business) : $948,853 in 8 contractsfrom 1999 to 2005
Contracts for Court Reporting Services by Offices, Boards and Divisions (includes Attorney General, Deputy Attorney General, etc.), U.S. Customs Service Signed by year:2000: $0; 2001: $322,000; 2002: $250,000; 2003: $125,000; 2004: $0; 2005: $1,853; 2006: $0.
Biggest contracts:
$287,000 with Offices, Boards and Divisions (includes Attorney General, Deputy Attorney General, etc.) for Court Reporting Services. Signed on 2001-10-15. Completion date: 2002-09-15.
$250,000, same as above.Signed on 2002-10-15. Completion date: 2003-10-15.
$250,000, same as above.Signed on 1999-12-15. Completion date: 2000-09-15.
$125,000, same as above.Signed on 2003-10-01. Completion date: 2004-09-30.
KARNA TECH, INC (2046 LA FREMONTIA; small business) : $848,607 in 4 contractsfrom 2000 to 2002
$467,649 with Army for Other Defense -- Basic Research (R&D). Signed on 2002-03-01. Completion date: 2004-02-20.
$261,480, same as above.Signed on 2002-09-03. Completion date: 2004-02-20.
$69,857, same as above.Signed on 2000-12-07. Completion date: 2001-07-30.
$49,621, same as above.Signed on 2001-09-04. Completion date: 2002-03-17.
PRECO AIRCRAFT MOTORS, INC (1133 MISSION ST; small business) : $533,140 in 12 contractsfrom 2000 to 2005
Contracts for Motors, Electrical, Studs, Electrical Insulators and Insulating Materials by Defense Logistics Agency, Navy Signed by year:2000: $39,900; 2001: $0; 2002: $107,460; 2003: $0; 2004: $371,599; 2005: $14,181; 2006: $0.
Biggest contracts:
$153,419 with Defense Logistics Agency for Motors, Electrical. Signed on 2004-08-25. Completion date: 2005-02-01.
$101,607, same as above.Signed on 2004-12-15. Completion date: 2005-03-15.
$73,830, same as above.Signed on 2002-09-05. Completion date: 2002-11-01.
$57,020, same as above.Signed on 2004-03-19. Completion date: 2004-08-16.
DAY-RAY PRODUCTS INC (1133 MISSION ST; small business) : $168,820 in 7 contractsfrom 2000 to 2006
Contracts for Ballasts, Lampholders, and Starters by Defense Logistics Agency Signed by year:2000: $32,700; 2001: $68,800; 2002: $0; 2003: $0; 2004: $0; 2005: $50,155; 2006: $17,165.
Biggest contracts:
$68,800 with Defense Logistics Agency for Ballasts, Lampholders, and Starters. Signed on 2001-11-15. Completion date: 2002-02-22.
$32,700, same as above.Signed on 2000-08-27. Completion date: 2000-11-05.
$20,790, same as above.Signed on 2005-02-15. Completion date: 2005-07-06.
$16,711, same as above.Signed on 2005-05-05. Completion date: 2005-06-05.
KRUEGER, WILLIAM J (1118 FAIR OAKS AVE; small business)
$6,566 with Air Force for Miscellaneous Items. Signed on 2004-10-28. Completion date: 2004-11-15.
DIVERSIFIED MAINTENANCE SERVIC (145 PASADENA AVE; small business)
$2,400 with Navy for Custodial Janitorial Services. Signed on 2004-11-17. Completion date: 2005-09-30.
KILLER SEARCH, INC (1305 HUNTINGTON DRIVE; small business) : $0 in 3 contractsfrom 2001 to 2002
$40,110 with Department of Defense for Other Professional Services. Signed on 2001-12-19. Completion date: 2002-01-18.
$0, same as above.Signed on 2002-11-08. Completion date: 2002-01-18.
-$40,110, same as above.Signed on 2002-11-08. Completion date: 2002-01-18.
Top industries in this zip code by the number of employees in 2005:
Administrative and Support and Waste Management and Remediation Services: Janitorial Services (over 1000 employees: 1 establishment, 50-99 employees: 1 establishment, 1-4 employees: 2 establishments)
Administrative and Support and Waste Management and Remediation Services: Temporary Help Services (500-999: 1)
2005 - 2018 National Fire Incident Reporting System (NFIRS) incidents
Based on the data from the years 2005 - 2018 the average number of fires per year is 38. The highest number of reported fire incidents - 63 took place in 2009, and the least - 6 in 2006. The data has a growing trend.
When looking into fire subcategories, the most incidents belonged to: Structure Fires (53.6%), and Outside Fires (24.5%).
Fire incident types reported to NFIRS in Zip Code 91030


 Nearest zip codes: 91105, 91801, 91803, 90042, 91106, 91101.


 Based on the data from the years 2005 - 2018 the average number of fires per year is 38. The highest number of reported fire incidents - 63 took place in 2009, and the least - 6 in 2006. The data has a growing trend.
 When looking into fire subcategories, the most incidents belonged to: Structure Fires (53.6%), and Outside Fires (24.5%).